-
Paper Information
- Paper Submission
-
Journal Information
- About This Journal
- Editorial Board
- Current Issue
- Archive
- Author Guidelines
- Contact Us
International Journal of Psychology and Behavioral Sciences
p-ISSN: 2163-1948 e-ISSN: 2163-1956
2012; 2(4): 94-102
doi:10.5923/j.ijpbs.20120204.04
Impact of Information Technology on Quality of Life and Well – Being of Secondary School Children
 Abstract
 Reference
 Full-Text PDF
 Full-text HTML
Nakhat Nasreen Azizul Haq, Gamal Ahmed Ahmed Abdullah
(Department of Education), Aligarh Muslim University (AMU), Aligarh 202002, India
Correspondence to: Gamal Ahmed Ahmed Abdullah, (Department of Education), Aligarh Muslim University (AMU), Aligarh 202002, India.
| Email: |  |
Copyright © 2012 Scientific & Academic Publishing. All Rights Reserved.
The aim of this study was to assess the impact of Information Technology on the Quality of Life (QOL) and Well-Being (WB) of children studying at secondary school level. Through education online, children make use of various applications of information technology in different walks of life such as health care, personal safety, technologies in education, training in education, etc. These applications of information technology were assessed in terms of their impact on Quality of Life. The study was conducted in the schools of Aligarh Muslim University, which is a renowned university in the world. Aligarh, the place of this study is a B grade city of Uttar Pradesh in India. The sample consisted of, N= 200 students, who were randomly selected from two groups, one from the senior secondary level (n1 =100) and the other from the Secondary level (n2 =100). Students were observed during the study. The students’ views on the application of Technology they had used in studying were elicited through a questionnaire. Data analysis showed that the use of Information technology impacted positively upon the QOL of students and helped them enormously to gain knowledge. The results suggest that within secondary schools, education online can be exploited as effective and motivational learning environment and the use should be promoted at a faster speed.
Keywords: Quality of Life, Information Technology, Internet
Cite this paper: Nakhat Nasreen Azizul Haq, Gamal Ahmed Ahmed Abdullah, Impact of Information Technology on Quality of Life and Well – Being of Secondary School Children, International Journal of Psychology and Behavioral Sciences, Vol. 2 No. 4, 2012, pp. 94-102. doi: 10.5923/j.ijpbs.20120204.04.
Article Outline
1. Introduction
- New technologies, such as computers and the Internet, which are developed, have affected the very structure of American society, and the world at large including the transportation system, security, economic stability, and overall sense of well-being. The terror attacks on the World Trade Center and the Pentagon struck the core of two of America's largest and most influential communities. Dillman (1979) writes that, "if people were free to choose, they would prefer to live in rural areas rather than in cities" (Cited in[28], p. 14). Many people are choosing rural settings that can provide similar benefits to those in the city, minus the crowded living conditions. Can society build virtual communities that will satisfy the needs of its members as well as traditional communities? If so, then what are these levels?Technology, as defined by various authors, has several meanings, such as, it is the practical application of knowledge especially in a particular area such as engineering or medical technology, a capability given by the practical application of knowledge such as a car's fuel-saving technology, a manner of accomplishing a task especially using technical processes, methods, or knowledge as in new technologies for information storage, and the specialized aspects of a particular field of endeavor, for example, in educational technology. Rogers' definition of technology as information is based upon Thompson, J. D. (1967)[30] and Eveland, J. (1986)[5], who stressed the uncertainty-reduction aspect of technology. Technology is information and transfer is a communication process, and so technology transfer is the communication of information[5]. Lane, R. E. (1996) further described that any technology had two components, hardware and software. The hardware is the tool that embodies the technology. The software provides the information base that drives the hardware tool.Never in the history of the world has society experienced such rapid advancement in technology, ranging from the discovery and application of natural phenomena such as fire and electricity, to the development of the wheel and thereafter till the modern and the post- modern period. Most of the people view the adoption of new technologies as a prerequisite for improved quality of life. With this rapidly advancing growth of technology have come an increased life expectancy and a growing world population.The dramatic improvement in life expectancy occurred during the first half of the 20th century because of improvements in public sanitation, personal hygiene, and food safety. During the second half of the century, new medical technologies such as antibiotics and vaccines, in their ability to fight and prevent disease, were the greatest contributions to a longer life expectancy ([6], pp. 122-23). Now the question arises that, can information and education technologies improve the quality of life in the same way as it has increased quantity or length of life? Consequently, information technology (IT) is the most important factor driving improvement in a wide array of areas critical for the quality of life for individuals and healthy societies.According to eminent researchers in the present area it is imperative that policymakers around the globe need to follow at least ten key principles if their citizens and societies are to fully benefit from the digital revolution. Robert D. Atkinson & Daniel D. Castro (2008)[21] reported ten key principles as outlined below:1. Look to digital progress as the key driver of improved quality of life.2. Invest in digital progress.3. Ensure affordable and widespread digital infrastructure. 4. Encourage widespread digital literacy and digital technology adoption.5. Do not let concerns about potential or hypothetical harms derail or slow digital progress.6. Do not just digitize existing problems; use IT to find new solutions to old problems.7. Create reusable digital content and applications.8. Collaborate and partner with the private and non-profit sectors.9. Lead by example.10. Nudge digital.Such questions as how can information technology contribute to solving problems that people encounter in improving their quality life through education and training, health care, and safety, may be raised. This paper, therefore, intends to study the relationship between the Quality of life parameters (education & training, health care, and people safety) and some of the indicators of information technology.
2. Review of Related Works
- The guiding theoretical framework for "quality of life” in the context of this research was defined as an overall general well-being comprised of both objective and subjective evaluations of physical, material, social, and emotional well-being, together with the degree to which individuals enjoy the important possibilities of their lives, or how good is their life for them? Significant to these evaluations is the relative importance an individual places on each area[7].Many seminal studies conducted during the 1970s until now, which are often quoted in QOL literature are[1-4,9-12,14,16,26,27]. Campbell, A., Converse, P., & Rogers, W. (1976)[4] have found that a sense of well-being is more dependent on an individual's satisfaction with resources than on the quality of these resources. Andrews, F., & Witiiey, S. (1976)[1] opined that QOL is determined by an individual's perceptions of well-being based on evaluation of life domains such as family, residence, job, friends, neighbors, and health, and evaluations of criteria such as standards, aspirations, values, and goals. Sheldon, E. and Land, K. C. (1972)[27] suggested that the following could constitute the content categories of social reports using indicators system: socioeconomic welfare including population (composition, growth, and distribution), labour force and employment, income, health, transportation, knowledge and technology, housing, physical environment, leisure, education public safety and legal system, social mobility, and stratification.Social participation and alienation could also be assessed, as could use of time, consumption, aspiration, satisfaction, moral, and other characteristics. Moore, K. A. & Theokas, C. (2008)[14] listed the key dimensions of a framework for healthy child development as: material well-being, safe and stable housing, caring relationships with family and peers, a healthy start, support for efficacy and mattering, and opportunities for engagement in effective education, positive social norms, and participation in community affairs. They also recommended that four key domains of individual functioning—physical, cognitive / educational, psychological and social—and four key proximal contexts—families, peers, schools, and communities—be included in a developmentally sensitive framework for monitoring middle childhood.Kabneman, D., Diener, E., & Schwarz, N. (1999)[10] stated that quality of life is embedded within a cultural and social context, and although many forces exert influences, including poverty and pollution, quality of life is fundamentally a subjective state. These authors advocated that research indicators of well-being should challenge economic indicators for the attention of policy makers. They stated that economic indicators are limited to commodities traded in the marketplace and ignore qualities such as love, intellectual challenge, or stress. Economic analysis assumes that people would choose the mostly the utility for themselves, but this assumption is contradicted by quality of life research. Finally, they indicated that economic variables are indirect measures of subjective well-being. On the other hand Lane, R. E. (1996)[12] argued that governmental policies led to improvements in the external characteristics of quality of life, such as housing for poor and expanded police forces and prisons, often failed to improve the quality of life for citizens in general because such policies failed to recognize the subjective well-being and personal development of people. Argyle, M. (1999)[2] recapped previous research that showed that demographic variables do affect quality of life but that such effects were generally small. Other variables, such as religion, leisure activities, life events, and personal skill sets, had more influence.Argyle, M. (1999)[2] prioritized a list of leading influences on quality of life: “The strongest effects are due to marriage, employment, occupational status, leisure and the ‘competencies’ of health and social skills (p. 370)”. Hanell, B.S. (2000)[9] provides an extensive review of the evolution of the Internet, e-mail programming, and dissemination of the technology involved. She includes a review of the development of the Uses and Gratification Theory that can be traced to Harold Laswell's Limited Effects Theory and his findings on why people choose specific media. Other sources of research on the subject include ([26], p. 146) and ([11], p. 164), who delved into the subject of computer mediated technologies as new types of media the masses use to meet their communications and information needs. Historically, research on media effects has focused solely on negative effects from the media, while intended and positive media effects were ignored ([3], p. 218).In 1973, researchers[11] were among the first researchers to compare gratifications among different types of mass media. They found that respondents used the media to gratify their needs for escaping reality, for entertainment, for killing time, and for social needs (topics of conversation) (p. 164).In 1974, uses and gratifications researchers began measuring audiences' uses and gratifications by constructing Likert scales. Scale questions were developed from focus groups, interviews, and researcher observations. Researchers[26] also found that the uses and gratifications approach included an audience's needs, which then generated expectations of mass media, which resulted in gratifications, (p. 147). In 1985 Pahngreen, P., Wenner, L., & Rosengren, K. (1985)[16] brought another important development in uses and gratifications studies. They created the following assumptions for the uses and gratifications model: (i) The audience is active, thus (ii) much media use can be conceived as goal directed, and (iii) competing with other sources of need gratifications so that when (iv) substantial audience initiative links needs to media choice, (v) media consumption can fulfill a wide range of gratifications accurately because (vi) media characteristics structure the degree to which needs may be gratified at different times, and further because (vii) gratifications obtained have their origins in media content, exposure in and of itself, and/or the social situation in which exposure takes place, (pp. 11-37). Katz's model along with Palmgreen, Wenner, and Rosegren’s assumptions has been the guidelines for researchers since their development.The interactive nature of computers and the Internet make Uses and Gratifications Theory useful in predicting users' behavior in relation to technology. Several studies have affirmed the active audience assumption. Uses and gratifications researcher[18] assumed that interactive media consumption is purposive and that the Internet, as an interactive medium, qualifies. He argues that, by definition, interactive media are intentionally consumed, as an audience member must make conscious choices within the medium. For instance, with the Internet, the audience member chooses his or her Internet avenue from among choices such as America On-Lnie, CompuServe or local Internet Service Providers ([26], p. 157).
3. Information Technology, Communities and QOL: A Model
- This model provides common denominators for community, information technology, and quality of life. As broadband becomes more accessible and the adoption of new technologies increases the boundaries, dividing traditional communities and on-line communities begin to disappear. Little theories would suggest that more individuals would use technology that is easy to use and meet their needs. This research predicts that as additional products and services that could enhance quality of life are delivered via broadband Internet to individual households, users will become more accepting of technologies. With three different sets of literature—community, quality of life, information technology—pointing to improvement of the individual's circumstance as a major focus, the landscape of sociology and community development is changing. The tools that communities have available remain limited because of limited resources; the possibilities that technology has to offer are expanding at an exponential rate. Consequently, we suggests the following model – which is similar to the Bullock-Smith Model for Technology, Community, and Quality of Life – is a means of defining visually the convergence of these three very powerful individual concepts into one dynamic approach that could revolutionize people. It reveals the interaction and the symbiotic nature of traditional communities, virtual communities, and information technology.
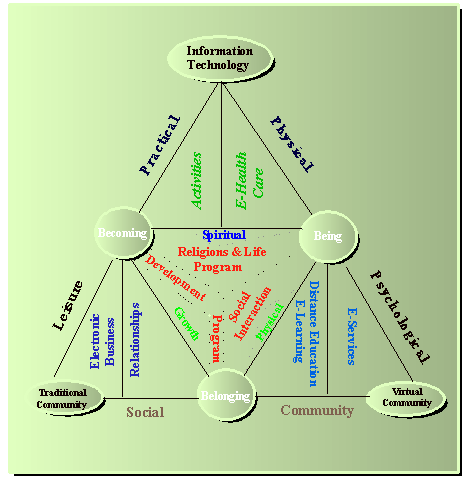 | Figure 1. Information Technology, Communities and Quality-of-Life |
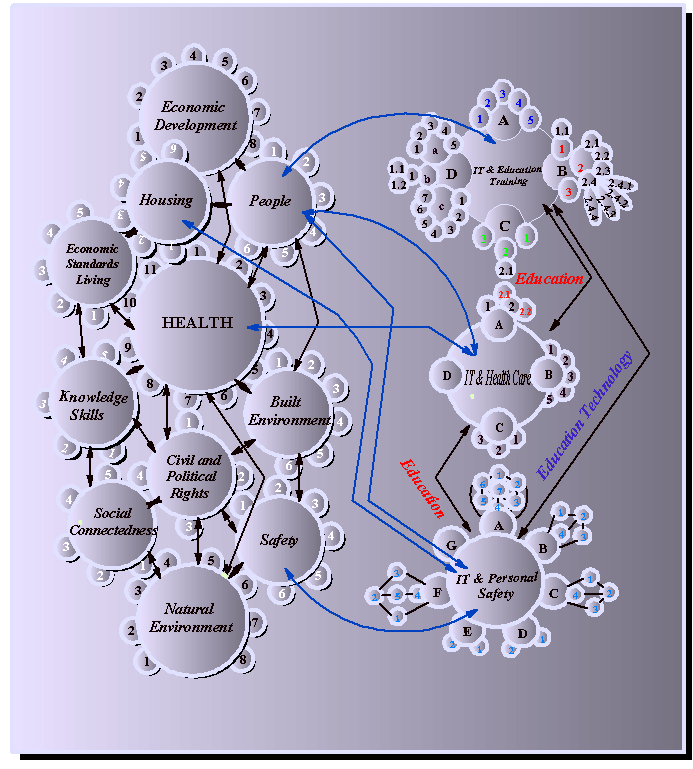 | Figure 2. Relationship between Quality of Life Indicators, Education & Information Technologies |
4. Objectives
- 1) To analyze the relationship between information technology and the students’ QOL2) To see the effect of information technology on education
5. Methodology
- The method adopted for the present study was descriptive and statistical in nature. It provides a flexible framework for selecting materials and participants, defining criteria and measures, and implementing evaluation techniques. By adopting these different techniques, the proposed structure model for quality of life aimed to assess the impact of information technology on Quality of Life (QOL) and Well-Being (WB). The model consisted of technologies in education, training in education, etc and the quality of life profiles (being, belonging, and becoming). There are eight observed (endogenous) variables, namely; IT & Education training (UITA), IT & Health care (UITB), IT & Personal safety (UITC), IT & Internet (UITD), IT & Education Online (UITE), IT & Technologies in Education (UITF), Friends-relationships-place of living (FRP), Work-play-development (WPD), and health-well-being (HWP). There were two unobserved (endogenous) variables, viz; Using information technology (UITh) and Well Being (WB) and one unobserved (exogenous) variable, i.e, QOL. Figure3 illustrates this model below.
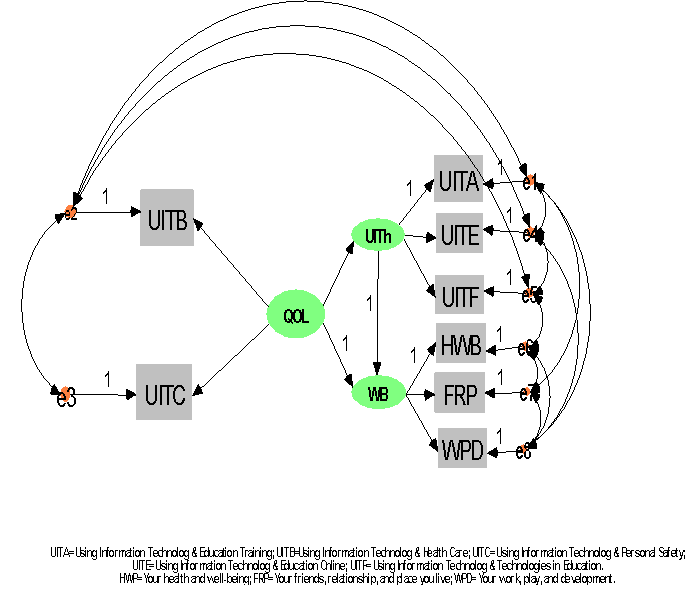 | Figure 3. Proposed structure model for Quality of Life, Well-Being, and Using Information Technology |
5.1. Population and Sample
- The sample of this study consisted of 200 students, (N=200) of secondary and senior secondary school level. Out of the total two hundred, hundred students, (n1=100) were of secondary level and 100 were of senior secondary level. All of them had enough knowledge of Internet, and had used and searched Internet before this study.
5.2. Locale of the Study
- The study was conducted in Senior Secondary School (+2) of Aligarh Muslim University (AMU) (including both boys and girls) and two schools of AMU, namely Abdullah Girls High School and S.T.S. High School.
5.3. Variables undertaken for the study
- The present problem manipulated the following variables:• Independent variable: Quality of Life (QOL) profiles• Dependent variable: Using information technology (UITH) and Well Being
5.4. Description of the tool used
- Two standardized questionnaires were used to conduct the study, and were filled by the respondents. The method of collecting data through questionnaires is quite popular, particularly in case of big enquiries. Each of them is been adopted by private individual research workers, private and public organizations and even by government organizations. In this method, the questionnaires were distributed amongst the sample under study by the researchers themselves.A Quality of Life Scale ([17]: The Quality of Life Profile: a generic measure of Health and Well Being. Toronto: University of Toronto Center for Health Promotion) was used by the researchers to collect the relevant information.
5.5. Data Collection
- Collection of data is an important phase in any research work. Various difficulties are generally felt by the investigators whole collecting data. In the present study, the data was to be collected from four AMU Schools. (Two at were Senior Secondary level and two were at Secondary level).Before approaching the subjects in various schools, the researchers first took permission from the principals of the respective schools for survey.In order to collect the systematic data, it was essential to approach subjects and the investigators did the same. After contacting students, the investigators explained the objectives of the study to them. The respondents were assured that the information provided by them would be kept strictly confidential.Two questionnaires were used for this study. The first questionnaire was used for quality of life (importance, satisfaction, control, and opportunities) tests, which consisted of one-hundred and twenty-seven questions. Second questionnaire concentrated on using information technology in health care, education training, personal safety, Internet, education online, and technologies, such as technology toys, games, age-appropriate instruction, activities, intelligent tutoring programs, etc. that consisted of six questions.Then the investigators distributed the two questionnaires among the students. They were asked to go through the general instructions given on the top of them before filling the given entries. Lastly, the students were asked to read the statements carefully and requested to give their responses to every statements. Doubts and confusions were clear by the investigators as per the requirements of the students.The investigators also gave full freedom to the students to ask the meaning of the words or sentences which were beyond their understanding. Moreover, there was not any kind of undue stress and control over the students at the time of completion of the QOL Profile.After completion, it was collected from the students and checked by the investigators whether the students filled all the entries.The investigators also collected the academic records of the students from the class teachers in case of class IX students and from the office of the institution for XI class students.
5.6. Statistical Techniques Used
- The analysis of data was done by using statistical techniques, which were chosen only after the investigators found them to be most appropriate and compatible for the collected data. The following statistical techniques were used:• Mean (M)• Standard Deviation (SD)• Reliability • Principal Component Factor• Structural Equation Modeling
5.7. Hypotheses
- H01: Using information technology (UITh) has a positive effect on education onlineH02: Using information technology (UITh) has a positive effect on technologies in educationH03: Quality of Life (QOL) has a positive effect on Using Information TechnologyH04: Quality of Life (QOL) has a positive effect on Using Information Technology & Health CareH05: Quality of Life (QOL) has a positive effect on Using Information Technology & Personal SafetyH06: Well-being (WB) has a positive effect on relationships and place for livingH07: Well-being (WB) has a positive effect on work, play, and development
6. Analysis of results
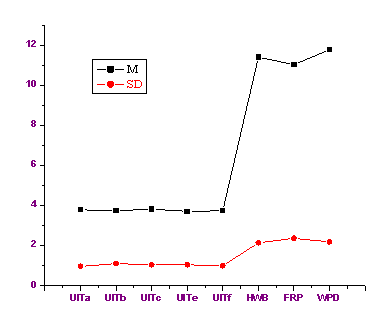 | Figure 4. Means and Standard Deviation of Quality of Life, Well-Being, and Using Information Technology |
| |||||||||||||||||||||||
| |||||||||||||||||||||||||||||||||||||||||||||||||||||||||||||||||||||||
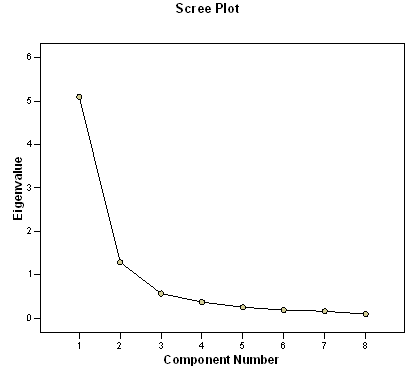 | Figure 5. Screen Plot |
7. Analysis of the Structural Model
- A structural equation modeling technique was used to test the quality of life, well-being, and information technology application model. The results are shown in figure6 below:
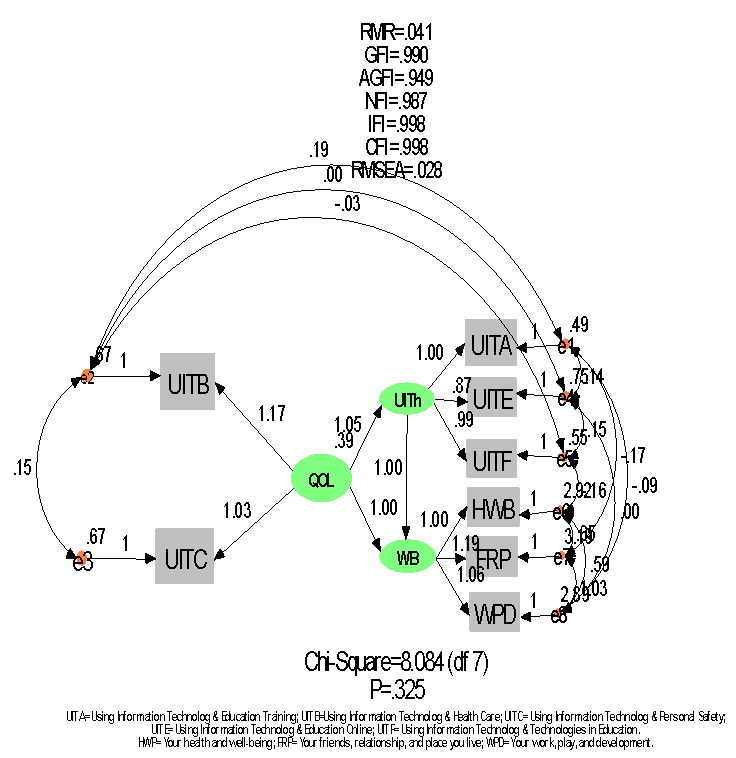 | Figure 6. Unstandardized Estimate of Quality of Life, Well-Being, and Using Information Technology Model |
8. Findings
- It was founds that:1. Using information technology (UITh) has a positive effect on education online (β=0.871, t=6.773, P=0.000).2. Using information technology (UITh) has a positive effect on technologies in education (β=0.992, t=6.931, P=0.000).3. Quality of Life (QOL) has a positive effect on Using Information Technology (β=1.052, t=2.833, P=0.005).4. Quality of Life (QOL) has a positive effect on Using Information Technology & Health Care (β=1.171, t=2.954, P=0.003).5. Quality of Life (QOL) has a positive effect on Using Information Technology & Personal Safety (β=1.031, t=3.220, P=0.001).6. Well-being (WB) has a positive effect on relationships and place for living (β=1.195, t=7.158, P=0.000).7. Well-being (WB) has a positive effect on work, play, and development (β=1.059, t=6.809, P=0.000).The impact of observed, unobserved, and latent variables in the model, upon each other and the relationships in between were analyzed with the help of relevant items, and to understand the impact of these variables on each other, the recursive model was applied which explained the purpose of this study.Eight fit indices, which are commonly used in the literature (X2, X2/df, GFI, AGFI, NFI, CFI, RMR, and RMSEA), were employed to test the model fit. The best fit was acquired. The commonly used measures of the model fit, based on the results from an analysis of the structural model, are summarized in the table 4 as shown below. All goodness-of-fit statistics are in the acceptable range.Graphical presentation of the results is shown in figure7 above, which is the standardized AMOS 5 path coefficient with their respective significance levels. This model explained 38%, 45%, 39%, 43%, 36%, 44%, 31%, and 47% of variance for UITC, UITB, WPD, FRP, HWB, UITF, UITE, and UITA respectively. Therefore, the hypotheses H01, H02, H06, and H07 are supported because these hypotheses are found significant at the level P=0.001, whereas, H05 is significant at the level P=0.01 and H03 and H04 are significant at the level P=0.05.
|
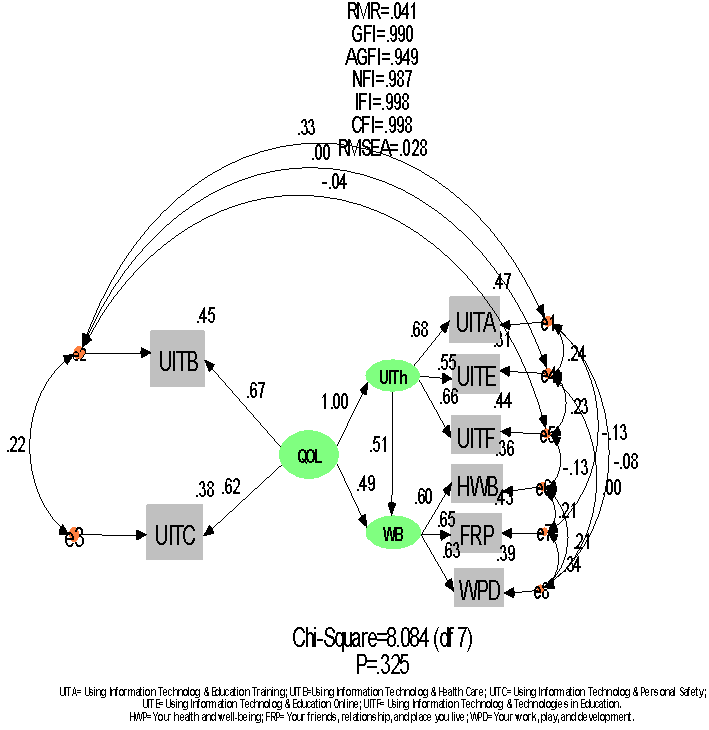 | Figure 7. Standardized Estimate of Quality of Life, Well-Being, and Using Information Technology Model |
|
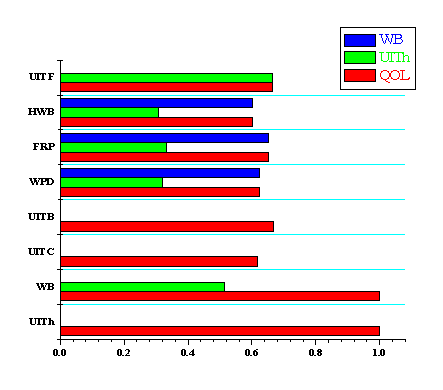 | Figure 8. Total Effects of Latent and Unobserved Variables on Observed variables |
9. Discussions and Conclusions
- This study tends to infer that information technology has been diffused in secondary schools of universities in general and The Aligarh Muslim University in particular. Quality of life profiles and well-being dimensions are taken into consideration to explain students’ levels and skills for gaining knowledge by using information technology applications in education. The findings of the study show that the uses of information technology applications are getting more widespread in secondary schools of Aligarh. It has helped children in improving their quality of life through satisfaction and happiness while learning and seeking information through the use of Internet and IT. The results suggest that within secondary schools, education online can be exploited as effective and motivational learning environment.All hypotheses postulated by the structural model are supported, and hence, it can be said that the information technology applications were found effective in enhancing the QOL of students and were found influential to gain knowledge. Having its stronger impacts on quality of life, it is emphasized that it is required to use information technology applications in classroom particularly for receiving knowledge through multimedia in classrooms and the campus. Therefore, it is significant that information technology applications as tools should be promoted on a large scale, and teachers in schools should be supported with technical and technological equipments and the process should be institutionalized via the policies and strategies of the Government in various countries.
References
| [1] | Andrews, F., & Witiiey, S. (1976). Social indicators of well-being. New York: Plenum Press. |
| [2] | Argyle, M. (1999). Causes and correlates of happiness. In D. Kahneman, E. Diener, & N. Schwarz (Eds.), Well-being: The foundations of hedonic psychology (pp. 353 - 373). New York: Russell Sage Foundation. |
| [3] | Baran, S., & Davis, D. (1995). Mass communication theory: Foundations, ferment and future. Stamford, CT: Wadsworth. |
| [4] | Campbell, A., Converse, P., & Rogers, W. (1976). The quality of American life. New York: Russell Sage Foundation. |
| [5] | Eveland, J. (1986), Diffusion, technology ttansfer and implications: Thinking and talking about change. Knowledge, 5(2), 303-322. |
| [6] | Faria, M., Jr., MD. (2002). Medical histoty—Hygiene and sanitation. Medical Sentinel 7(4), 122-23. |
| [7] | Felce, D., & Perry, J. (1996). Exploring current conceptions of quality of life: a model for people with or without disabilities. In R. Renwick, I. Brown, & M. Nagler (Eds.), Quality of life in health promotion and rehabilitation (pp. 51-62). Thousand Oaks, CA: Sage. |
| [8] | Gromov, G. (1998). Silicon Valley to Intemet Valley: A few points from recent IT histoty. Roads and crossroads of Intemet history. Silicon Valley, CA: Net stories. Available: http://www.netvalley.com/inttoduction.html. |
| [9] | Hanell, B.S. (2000). Uses and gratifications of the Intemet. Unpubhshed master's thesis, Texas Tech University. |
| [10] | Kabneman, D., Diener, E., & Schwarz, N. (Eds.). (1999). Well-being: The foundations of hedonic psychology. New York: Russell Sage Foundation. |
| [11] | Katz, E., Haas, H., & Gurevitch, M. (1973). On the use ofmass media for important things. In American Sociological Review, 1, 164-181. |
| [12] | Lane, R. E. (1996). Quality of life and quality of persons: A new role for government? In A. Offer (Ed.), In pursuit of the quality of life (pp. 256-293). Oxford, England: Oxford University Press. |
| [13] | Merriam-Webster's collegiate dictionaty (10th ed.) (2001). Springfield, MA: |
| [14] | Moore, K. A. & Theokas, C. (2008). Coneptualizign a monitoring system for Indicators in Middle Childhood. Child Indicators Research.1:109-128. |
| [15] | Nunnaly, J. C., & Bernstein, I. H. (1994). Psychometric theory (3rd ed.). New York: McGraw-Hill. |
| [16] | Pahngreen, P., Wenner, L., & Rosengren, K. (1985). Media gratifications research: Current perspectives. Beverly Hills, CA: Sage. |
| [17] | Raphael, D. (1998). The quality of life profile: A generic measure of health and wellbeing. Toronto: Quality of Life Research Unit, Centte for Health Promotion, University of Toronto. |
| [18] | Raybum, J. (1996). The uses and gratifications approach. In Michael Selwen and Donald Stacks (eds.). An integrative approach to communication theory and research. Hillsdale, NJ: Lawrence Erlbaum Associates. recipients. Doctoral dissertation: Texas A&M University. |
| [19] | Renwick, R. & Brown, I. (1996). Quality oflife in health promotion and rehabilitation:Conceptual approaches, issues, and applications. Thousand Oaks: Sage Publications.Campbell, A., Converse, P. E., & Rodgers, W. L. (1976). The quality ofAmerican life: Perceptions, evaluations, and satisfactions. New York:Russell Sage Foundation. |
| [20] | Renwick, R., Rudman, D., Brown, I., & Raphael, D. (1994). The quality of life profile: Version for persons with physical disabilities. Toronto: University of Toronto, Centte for Health Promotion.Reviving rural America. (Jan. 5, 2004). Trend Letter, 4-5. |
| [21] | Robert D. Atkinson & Daniel D. Castro (2008). Digital Quality of Life Understanding the Personal & Social Benefits of the Information Technology Revolution. |
| [22] | Rogers, E. (1995). Diffusion of innovations (4th ed.). New York: The Free Press. |
| [23] | Roottnan, I., & Raebum, J. (1994). The concept of health. In A. Pederson, M. O'Neill, & I. Rootman (Eds.) Health promotion in Canada: Provincial, national and international perspectives (pp. 56-71). Toronto: W. B. Saunders. |
| [24] | Roottnan, I., Raphael, D., Shewhcuk, D., Renwick, R., Friefeld, S., Garber, M., Talbot, Y., & Woodill, D. (1992a). Development of an approach and instrument package to measure quality oflife of persons with developmental disabilities. Toronto: University of Toronto, Centte for Health Promotion. |
| [25] | Rudman, D., Renwick, R., Raphael, D., & Brown, I. (1995). The quality oflife profile for adults with physical disabilities[Absttact]. Canadian Joumal of Occupational Therapy, 62, 25. |
| [26] | Salwen, M., & Stacks, D. (1996). An integrated approach to communication theory and research. Mahwah, NJ: Erlbaum. |
| [27] | Sheldon, E. and Land, K. C. (1972). Social reporting for the 1970s: a review and programmatic statement. Policy Sciences, 3, 137-151. |
| [28] | Smith, J. (1999). Quality oflife of Houston Livestock Show and Rodeo scholarship |
| [29] | Thompson, B. & Daniel, L. (1996). Factor analytic evidence for the construct validity of scores: A historical overview and some guidelines. Educational and Psychological Measurement, 56(2), 197-208. |
| [30] | Thompson, J. D. (1967). Organization in action. New York: McGraw-Hill. |
| [31] | Tabachnick, B. & Fidell, L. (1996). Using multivariate statistics. New York, NY: Harper Collins College Publishers. |