-
Paper Information
- Previous Paper
- Paper Submission
-
Journal Information
- About This Journal
- Editorial Board
- Current Issue
- Archive
- Author Guidelines
- Contact Us
International Journal of Psychology and Behavioral Sciences
p-ISSN: 2163-1948 e-ISSN: 2163-1956
2012; 2(1): 46-53
doi: 10.5923/j.ijpbs.20120201.07
Item Parcels in Structural Equation Modeling: an Applied Study in Sport Management
 Abstract
 Reference
 Full-Text PDF
 Full-Text HTML
Claudio M Rocha 1, Packianathan Chelladurai 2
1School of Physical Education and Sport of Ribeirao Preto, University of Sao Paulo, Ribeirao Preto-SP, 14025-058, Brazil
2Sport Management Program, The Ohio State University, Columbus-OH, 43210, USA
Correspondence to: Claudio M Rocha , School of Physical Education and Sport of Ribeirao Preto, University of Sao Paulo, Ribeirao Preto-SP, 14025-058, Brazil.
| Email: |  |
Copyright © 2012 Scientific & Academic Publishing. All Rights Reserved.
The purpose of this study is to describe the influences of different parceling strategies on goodness-of-fit measures and parameter estimates of a sport management structural model with latent variables. The use of small sample sizes to test models with a large number of parameters can produce poor fit indexes, mainly because many indicators tend to increase the chances of cross-loadings, which in turn reduce the common variance[1]. Considering that in social and behavioral sciences is not quite easy to have access to large-enough samples, item parceling has been proposed as a remedy for this kind of situation. Using a theoretically-supported sport management model and real data, we compared total disaggregation model (items as indicators) with partial disaggregation models (parcels as indicators) and total aggregation model (summated score as the indicator). Results showed that different strategies of parceling could lead to very distinct conclusions. Implications for future studies using parceling in the field of sport management are discussed.
Keywords: Parcels, Sport Management, Structural Equation Modeling
Cite this paper: Claudio M Rocha , Packianathan Chelladurai , "Item Parcels in Structural Equation Modeling: an Applied Study in Sport Management", International Journal of Psychology and Behavioral Sciences, Vol. 2 No. 1, 2012, pp. 46-53. doi: 10.5923/j.ijpbs.20120201.07.
Article Outline
1. Introduction
- Scholars in social and behavioral sciences have increasingly resorted to the employment of structural equation modeling (SEM) as the data analytic technique in their research involving complex models with interrelated theoretical constructs[2]. One attractive feature of SEM over traditional multivariate statistical methods is that the former can evaluate both the measurement model and the structural model[3]. While the structural model is critical to investigating structural relationships among latent variables, the construct validity of the variables can be verified by testing the measurement model through confirmatory factor analytic procedures available in SEM[4]. A measurement model with poor goodness-of-fit indexes, indicating lack of construct validity, does not permit any further analysis about structural relationships among constructs[4].Goodness-of-fit measures depend on the number of parameters to be estimated and the sample size. To obtain a good estimate of model fit, the number of subjects must be significantly larger than the number of parameters to be estimated[4,5]. The use of small sample sizes to test models with a large number of parameters can produce poor fit indexes, mainly because many indicators tend to increase the chances of cross-loadings, which in turn reduce the common variance[1]. Bentler and Chow (1987) proposed that the ratio of sample size to estimated parameters should be at least 5:1.That is, for each free parameter you have in your model, you must have at least five subjects in the sample used to test the model. In simple models, this criterion can be easily met with a small/moderate sample size. As the number of parameters to be estimated increases, making models more complex, this criterion requires larger sample sizes. Usually, social and organizational scholars are not willing to negotiate the complexity of their structural models, because social relationships are actually complex. However, they are less resistant to modifications in the measurement model. Based on that, Bagozzi and Edwards (1998[1]) proposed that, when dealing with complex models and not large sample sizes, a researcher could opt for reducing the number of path coefficients by collapsing items of a given scale into multi-item composites. That is, in order to reduce the number of parameters to be estimated, instead of using individual items as indicators, researchers could use composites of items as the indicators of the construct. Composite (aka, item parcel) is defined as “an aggregate level indicator comprised of the sum (or average) of two or more items, responses, or behaviors”[6,p.152]. Item parceling has been used not only when problems with sample size arise, but also in situations of non-normality of the data. The two most common techniques of model estimation in SEM – maximum likelihood and generalized least squares – assume a normal distribution of the data. When this assumption is violated, problems appear. In the presence of non-normal distributed data, parameter estimates are usually unbiased, but values of the chi-square test statistic and other fit indexes are affected[7,8]. Distributions of item parcels more closely approximate a normal distribution than the distribution of the individual items[1,9]. Item parceling has been effective in addressing both problems, a small ratio of sample size to parameters to be estimated, and non-normality of the data[7,10]. Therefore, it is not surprising that social and behavioral researchers have been opting for reducing the number of parameter estimates by using parcels of items as indicators of constructs in their models[9,11].Problems arise when researchers do not pay attention to procedures used to parcel items. As noted by Hall et al. (1999), different procedures used to aggregate items may yield very different estimates of the parameters which, in turn, can lead researchers to draw wrong conclusions about structural relationships among the investigated variables. In their view, “it is possible that most appropriate parceling strategy is dependent on the characteristic of the items and types of questions being addressed, and these vary across disciplines”[9,p. 239]. Taking this statement as motivation, we chose the field of sport management as an example to illustrate this problem. Researchers in sport management have been increasingly testing more complex models using SEM techniques[e.g., 12, 13]. However, survey investigations in sport management have reported samples that are, at most, of moderate size; mainly due to poor response rates[14]. Additionally, many investigations in sport management have reported problems with non-normal data[e.g., 15, 16]. As a result, the technique of item parceling has been used in sport management investigations with a clear view of improving the model fit indexes[e.g,17,18,19]. These studies have consistently failed in detailing the procedures used to form composites.In this sense, the purpose of the study is to describe the influences of different parceling strategies on goodness-of-fit measures and parameter estimates of a sport management model with latent variables. Using a theoretically-supported sport management model and real data, we compared total disaggregation model (items as indicators) with partial disaggregation models (parcels as indicators) and total aggregation model (summated score as the indicator). In the following sections, we discuss different strategies to parcel items described in the literature, and present the sport management model that is going to be tested.
1.1 Methods to form Item Parcels
- Three different levels of aggregation have been considered in forming item parcels[1,20,21]. In total disaggregated models, items are used as indicators for the constructs. In total aggregated models, all items of a certain scale are summed or averaged yielding one parcel score to represent the construct. In partial disaggregated models, the items in a scale are parceled into fewer parcels to indicate the construct in question. While there is only one way to employ total aggregation or disaggregation, partial disaggregation presents different methods of forming parcels[22-25]. Hall et al. (1999[26]) described random versus planned partial disaggregation strategies. In random disaggregation strategy, the researcher decides on the number of parcels to be created and, then, randomly assigns the items to the parcels. In planned disaggregation strategies, the assignment of items to parcels is based on either theoretical or empirical rationale. Landis et al. (2000) elaborated further on these planned methods. They proposed that in the content method, items are assigned to the composites based on a theoretical analysis of the content of these items; while in other planned methods, disaggregation rely on empirical properties of the data to create parcels. In the single-factor method, all items of a given scale are examined through a factor analysis where a single-factor solution is extracted. Then, the item with the highest loading is paired with the item with the lowest loading; the item with the second highest loading is paired with the item with the second lowest loading; and so on, until all items have been assigned to the parcels. In the correlational method, the correlations among items are examined. Then, the items with the highest correlation are paired and assigned to the first composite; items with the second highest correlation are assigned to the second composite, and so on, until all items have been assigned. In the exploratory factor analysis method, the number of parcels and the number of items per parcels are defined based on the results of an exploratory factor analysis on each scale. That is, each parcel corresponds to each factor that arises from the exploratory factor analysis. Finally, in the empirically equivalent method, items should be assigned to parcels in such a way that these parcel will have equal means, variances, and reliabilities[10]. This approach is also an empirically-driven technique to create parcels, but, instead of using factor-loading or correlation information, it uses means, standard deviations, and reliabilities to create parcels.
1.2. Sport Management Structural Model
- Based on the perceived organizational theory[27,28] and the norm of reciprocity[29], we proposed a latent variable model where perceived organizational support (POS) functions as a mediator between perceptions of justice (distributive justice – DJ, and procedural justice – PJ) and affective commitment (AC). Both distributive and procedural justice are largely accepted as important antecedents of POS[30-33]. Procedural justice is perceived when people notice fairness in the means by which decisions are made[34]. People consider procedures to be fair when there is a consistent distribution of time and information across individuals, and these procedures are conducted under moral and ethical standards[35]. On the other hand, distributive justice is perceived when the expectations are congruent with the outcomes received[34]. Wayne et al. (2002) found that both procedural and distributive justice were significantly related to POS. Fasolo (1995) found that both procedural and distributive justice explained unique variance in POS. In other terms, perceptions of justice are predictors of perceptions of support.Further, based on the norm of reciprocity[29], POS elicits employees’ willingness to care about the organization’s welfare[36]. POS is expected to trigger a sense of indebtedness in employees who receive support[27,36]. Existing literature reports that POS is positively related to affective commitment – AC[28,30,37-39]. Affective commitment reflects “the degree to which an individual is psychologically attached to an employing organization through feelings, such as loyalty, affection, warmth, belongingness, fondness, happiness, pleasure, and so on”[40,p.954]. Affective commitment has been shown to be the dominant form of expression of the feelings of indebtedness triggered by perceived support[36,39]. Rhoades et al. (2001) found that POS did predict AC, which in turn mediated the relationship between POS and effectiveness indicators. Additionally, Rhoades et al. (2001) supported the mediational role of POS between justice and AC. In summary, considering previous research, we tested a model where PJ and DJ are antecedents of POS, which in turn is the mediator between these antecedents and AC (see Figure 1).
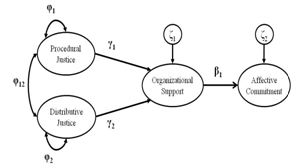 | Figure 1. Structural Model with Latent Variables |
2. Method
2.1. Participants
- We tested the proposed model in a sample of NCAA Division I coaches. As college coaches represent the operating core in athletic departments[41], their perceptions about organizational procedures are critical from a managerial perspective [42]. A simple random sample of 1,000 coaches received a web-based questionnaire. We received back 288 usable questionnaires (28.8% response rate) yielding a 95% confidence level with 5.7% of sampling error. Missing values were dealt using full information maximum likelihood approach, obtained by the expectation-maximization (EM) algorithm [43]. Most respondents were male (n = 215; 74.6%) and Caucasian (n = 250; 86.8%). The age and tenure of the respondents ranged from 23 to 76 years (M = 42.0, SD = 9.2), and from 0.5 to 45 years (M = 9.5, SD = 8.1), respectively.
2.2. Instrumentation
- For all four constructs, the response format was a 6-point scale ranging from 1 (strongly disagree) to 6 (strongly agree). Procedural justice (PJ) was measured by eight items selected from Rahim, Magner, and Shapiro’s (2000[44]) and Niehoff and Moorman’s (1993[45]) scales; distributive jus tice (DJ) was measured by eight items selected from Moorman’s (1991[46]) scale; perceived organizational sup- port was measured by six items from Eisenberger et al.’s (1986[27]) scale; and affective commitment (AC) was mea- sured by four items from Meyer, Allen, and Smith’s (1993 [47]) instrument.
2.3. Data Analysis
- Before parceling, we used the total disaggregated model to check the psychometric properties of the scales. We estimated the internal consistency of the scales using Cronbach’s alpha and the construct validity using the average variance extracted (AVE). We also conducted an exploratory factor analysis (EFA) for each scale to assess the unidimensionality of the scales. According to Hall et al. (1999[26]), in scales that are not unidimensional, the unmodeled factors might produce different fit indexes depending on the parceling strategy used.In the sequence, we used three strategies—an empirically-oriented (EFA), a theoretically-oriented (content analysis), and a random-oriented strategy[10]—to form item parcels. In the empirically-oriented approach, we carried out an EFA extracting two factors in each scale, as the number of items per construct was as low as four. In the content-based strategy, the authors discussed the substantive characteristics of the items and grouped the items into two parcels. Finally, in the random strategy, the items in a subscale were randomly assigned to two parcels. In all strategies, we summed the items in a parcel to represent the indicators in the partial disaggregation models. None of strategies produced similar parcels. That is, different groups of items were used to form the parcels in all three strategies. This situation was not forced, but it happened spontaneously. At last, we compared the goodness-of-fit indices of both the measurement and the structural models, employing the three partially disaggregated data sets, and the totally disaggregated data set. For the structural analysis, we also tested a total aggregated model (where the sum of all items was used as the only indicator of a given construct) which is equivalent to a path analysis model[20]. We used the comparative fit index[CFI – 48], the Tucker-Lewis index[TLI – 49], the root mean square error of approximation[RMSEA – 50], and the chi-square divided by degrees of freedom to compare models. Parameter estimates were also compared across models. We utilized the SEM technique available in Mplus 5.21 to test both the measurement and structural models.
3. Results
- In the total disaggregation model, the internal consistency of all items in each of the four scales were quite high (αPJ = .94; αDJ = .92; αPOS = .91; αAC = .91), and the AVE values for all scales were above .50 (AVEPJ = .65; AVEDJ = .61; AVEPOS = .65; AVEAC = .71) indicating sufficient convergent validity for all constructs[51]. Skewness values ranged from -.661 to .043. Kurtosis values ranged from -.774 to .830, indicating only a small departure from normality. Checking for unidimensionality, a single factor emerged in the EFA of each scale. In the PJ scale, factor loadings ranged from .704 to .865, the factor determinacy was .97, and the first two eigenvalues were 5.565 and 0.517. In the DJ scale, factor loadings ranged from .546 to .922, the factor determinacy was .97, and the first two eigenvalues were 5.235 and 0.981. In the POS scale, factor loadings ranged from .610 to .899, the factor determinacy was .96, and the first two eigenvalues were 4.220 and 0.604. Finally in the AC scale, factor loadings ranged from .803 to .888, the factor determinacy was .95, and the first two eigenvalues were 3.126 and 0.345. Overall, these results support the unidimensionality of each of the four scales. Although the scales were all unidimensional, reliable and valid, the goodness-of-fit indexes for the measurement model using the total disaggregation data (CFI = .907; TLI = .897; RMSEA = .086) were below the acceptable standards. Hu and Bentler (1999[52]) suggested that values of .95 for CFI and TLI, and .06 for RMSEA should be found before one concludes that there is a good fit between the model and the data. The value of .086 for RMSEA exceeded even the more liberal value of .08 or less for a model to be considered as having an acceptable fit (Browne and Cudeck, 1993[53]). In this sense, the goodness-of-fit indexes for the measurement model have room for improvement.All three partial disaggregation models fit the data better than the total disaggregation model (Table 1) and the fit indices were up to acceptable values. The values of CFI and TLI were all above .95, and the values of RMSEA were .08 or less. Although the confidence interval for RMSEA was very wide in all models (indicating large instability in this measure), test of close fit [54] was not significant in the partial disaggregation model using EFA (pclose = .232) and random parceling (pclose = .143). But, it was significant in the partial disaggregation model using content analysis (pclose = .02) and in the total disaggregation model (pclose < .001). The EFA strategy produced the best goodness-of-fit indexes for the current measurement model (CFI = .992; TLI = .984; RMSEA = .063).For the structural model using the total disaggregated data, the values of fit indexes (CFI = .907; TLI = .898; RMSEA = .085) were below of acceptable values (Table 2). For the total aggregation model (path analysis model), the values of CFI (.994) and TLI (.984) were good, however the value of chi-square divided by degrees of freedom (χ2/df = 2.96) and, specially, the value and the confidence interval for RMSEA (.086; 90% CI = .000; 169) indicated a poor fit between this model and the data. The partial disaggregation models showed better fit measures when compared to both the total disaggregation and the total aggregation models. As in the analysis of the measurement model, the test of close fit was not significant for partial disaggregation model based on EFA (pclose = .298) and random parceling (pclose = .185). But, it was significant in the partial disaggregation model using content analysis (pclose = .035) and in the total disaggregation model (pclose < .001). For the structural model, the EFA strategy produced the best goodness-of-fit indexes (CFI = .992; TLI = .987; RMSEA = .058).
|
|
4. Discussion
- This study tested different strategies for parceling items and checked the influences of these strategies in goodness-of-fit measures and parameters estimates of a structural model. A theoretically-supported sport management model with real data was used to accomplish this aim. Initial analyses showed that the subscales were all reliable, valid, and unidimensional. We did not find problems of normality in the data distribution. However, the goodness-of-fit indexes for the measurement and structural models using items as indicators of the constructs (total disaggregation model) presented values that would be enough to discard the model as a plausible representation of a real phenomenon. In similar studies, the small ratio between sample size and free parameters has been blamed for poor fit indexes in SEM models[18, 19]. As the ratio sample size (n = 288) to free parameters (q = 82) was quite low (n/q = 3.5), we followed a common practice in the literature and constructed parcels of items as indicators of latent variables, in order to reduce the number of parameters to be estimated.Results of partial disaggregated models showed that the reduction in the number of parameters to be estimated improved the goodness-of-fit indexes, in both the measurement and structural models. And most important, different conclusions could be drawn based on the strategy used to aggregate items in parcels. Not all partial disaggregated models were useful to improve fit indexes to the acceptable levels. Based on the RMSEA values, only the random method and the EFA method produced acceptable fit measures. Although the content method did reduce the RMSEA value, this was still below the cutoff point commonly suggested in the literature to not disconfirm a model[55]. Furthermore, the parameter estimates in the structural model also varied depending on the strategy used to aggregate items. These results bring the first contribution of the current study to future researches in social and behavioral field in general, and in sport management more specifically. Previous research in sport management using parcels as indicators [e.g., 17] has not described the strategies used to aggregate items. As shown in the current study, this step should be mandatory in any study using parcels, inasmuch as different strategies can produce very different fit indexes and parameter estimates. Certainly the magnitude of the structural relationships in previous studies using parceling might have been affected by the strategy the authors used to parcel items. Some studies in sport management have described the strategy used to aggregate the items in parcels [e.g., 56]. However, these studies have failed to show the unidimensionality of the item set. Bandalos (2002[57]) asserted that parceling can mitigate problems of large number of free parameters associated with a small sample size only if the subscale is unidimensional. In this sense, as a second contribution of this study, we urge authors in behavioral sciences to test the unidimensionality of their scales before parceling. In this study, we ran an a priori EFA for each subscale, in order to support the assumption of a single-factor structure. Studies in sport management have not reported any analysis about the unidimensionality of the items in their scales before parceling[17, 19, 56]. This lapse is common in other fields inside the behavioral sciences as well. Bandalos and Finney (2001[58, 59]) in their review of 317 articles in education and psychology found that 62 of them (19.6%) had employed some type of parceling (indicating that parceling is an important tool), but only 20 of them had tested the unidimensionality of the items in the subscales before parceling them. The importance of unidimensionality is highlighted by the fact that “when the items with a shared secondary influence are placed into two or more separate item parcels, the measurement model is misspecified, resulting in inaccurate parameters estimates” (Hall et al., 1999; p.239). In other words, when a model has multidimensional items, the way these items are aggregated affects the specification of the model. If two items with a shared secondary influence are placed into the same parcel, the model is still correctly specified, because it isolates the undesirable shared variance into the error variance term (as unique variance) of that parcel or indicator. On the other hand, if two items with a shared secondary influence are place into different parcels, the model is no longer correctly specified, because it does not count the effects of a secondary common construct. In this sense, unidimensionality of scales guarantees that different parceling strategies are not being affected by the existence of a secondary factor.Although all subscales in the current study are unidimensional, results of the three strategies for parceling were not all the same. Landis et al. (2000[10]) noted that different strategies of parceling would not result in equivalently fitting models. As in the current study, Landis et al. found little or no improvement in fit indexes when a theoretical strategy (the content method) was used to create the parcels. The random method was effective to improve the fit measures in the current study and in Landis’ study as well. However, the EFA method was the most effective strategy to parcel items in our investigation. Based on previous findings[7, 9, 20], this result is not surprising. The EFA strategy used in this study is similar to the isolated uniqueness strategy proposed and tested by Hall et al. (1999). In the isolated uniqueness strategy, items that might have shared a secondary influence are place in the same parcel. When we forced the results of an EFA with two factors (even knowing that a solution with a single factor fitted the data well) and used these results to parcel our items, we were isolating any possible additional influence of a secondary factor. Using this empirically- driven strategy, we produced the best fit indexes among all other partial disaggregated, total disaggregation, or total aggregation models. A drawback of the present study is the use of actual data set, for which the population parameters are unknown. In this sense, we cannot make any assertion about which model produced the closest estimates to the real parameters in the population. However, previous studies have done it[9, 10], using computer generated data, from which population parameter were known. More importantly, and similar to computer generated data, differences in the parameter estimates achieved by different strategies showed the importance of a more detailed description about which strategy has been used to parcel items in behavioral research. Additionally, in agreement with previous studies[7, 20], the use of a total aggregation model attenuated the estimates of covariance and regression coefficients, and increased residual variances, when compared to either total disaggregation or partial disaggregation models. Therefore, future research in behavioral sciences should consider the risk of using simple indicators and, if possible, prefer latent models with multiple indicators per construct, in order to get more accurate parameter estimates.In this article we investigated the controversial practice of using parcels as indicators of constructs in structural equation modeling. As noted by Baggozi and Edwards (1998[1]), parceling usually cancels out random and systematic error by aggregating these errors into the same parcels. A major argument in favor of parceling is that sources of error can be removed from the data by aggregating items in parcels[6]. A counter argument is that parceling (or removal of unwanted errors) changes the reality and obscures the actual understanding of the phenomenon under investigation. Little and colleagues have a very interesting position about this dispute. They proposed that “from an empiricist-conservative philosophy of science perspective, parceling is akin to cheating because modeled data should be as close to the response of the individual as possible in order to avoid the potential imposition[…] of a false structure” (Little et al., 2002; p.152, emphasis in the original). On the other hand, from a pragmatic-liberal point of view, Little et al. recognized that, since the measurement of a variable is strictly defined by the investigator, he or she should have the freedom to define the nature of the indicators in latent variable models. However, these authors argue that the definition of the indicators must be justified and supported theoretically or, at least, empirically. The simple fact that parceling improves the goodness-of-fit measures should not be considered sufficient to support its use. But with a compelling justification, parceling should not be considered a “transgression against the truth”, because the process of investigation is an open one[6].Previous investigations in sport management [e.g., 17, 18, 56] and other behavioral fields [e.g., 58] have used parceling with a clear and only intention of improving fit indexes. Very little discussion, if any, about the normality of the data, the dimensionality of the items, and even the strategies used to parcel was clearly articulated in those investigations. Based on the results of previous investigations[7, 9], a thorough description of the dimensionality of the items must be presented a priori any attempt of parceling. But, even if behavioral scholars improve this description before parceling, a question must be answered: Is parceling a good measurement strategy for the advancement of knowledge? To answer this question, Little et al. (2002) proposed that the substantive goals of a study should be take into account. If the goal of the research is mainly to understand relationships among latent variables, then items or parcels of items are simply tools that permit the investigator to build a measurement model. In these cases, parceling is more justifiable. On the other hand, if the goal of the research is to investigate the dimensionality and nature of the measurement model, then missing cross loadings or correlated residuals will impact the correct comprehension of the phenomenon. In these cases, parceling will hinder the achievement of the goals of the study, and should be avoided. Based on the results of this research, behavioral scholars should carefully consider the use of parceling in two steps. First, clear statements about research objectives could greatly help scholars to decide about what works better as indicators of latent variables in to-be-tested structural models. Second, if parceling is appropriate according to the type of research question to be answered, a description about the normality of the data, the dimensionality of the items, and the strategies used to parcel should be considered as mandatory, in order to use parcels as indicators of latent variables.
ACKNOWLEDGEMENTS
- The first author thanks CAPES-Brazil and the Fulbright Commission for the support during the period when this article was produced.
References
| [1] | Bagozzi RP, Edwards JR. A general approach for representing constructs in organizational research. Organizational Research Methods. 1998;1(1):45-87 |
| [2] | Mulaik SA. Linear causal modeling with structural equations. Boca Raton: CRC Press 2009 |
| [3] | Tabachnick BG, Fidell LS. Using multivariate statistics. 5th ,[Pearson international ] ed. Boston: Pearson/Allyn & Bacon 2007 |
| [4] | Anderson JC, Gerbing DW. Structural equation modeling in practice: A review and recommended two-step approach. Psychological Bulletin. 1988;103:411-23 |
| [5] | Bentler PM, Chou CP. Practical issues in structural equation modeling. Sociological Methods and Research. 1987;16(1): 78-117 |
| [6] | Little TD, Cunningham WA, Shahar G. To parcel or not to parcel: Exploring the question, weighing the merits. Structural Equation Modeling. 2002;9(2):151-73 |
| [7] | Bandalos DL. The effects of item parceling on goodnes-of-fit and parameter estimate bias in structural equation modeling. Structural Equation Modeling. 2002;9(1):78-102 |
| [8] | Finch JF, West SG, MacKinnon DP. Effects of sample size and nonnormality on the estimation of mediated effects in latent variables models. Structural Equation Modeling. 1997;4:87-107 |
| [9] | Hall RJ, Snell AF, Foust MS. Item parceling strategies in SEM: Investigating the subtle effects of unmodeled secondary constructs. Organizational Research Methods. 1999; 2(3):233-56 |
| [10] | Landis RS, Beal DJ, Tesluk PE. A comparison of approaches to forming composite measures in structural equation modeling. Organizational Research Methods. 2000;3(2):186-207 |
| [11] | Mathieu JE, Farr JL. Further evidences for the discriminant validity of measures of organizational commitment, job involvement, and job satisfaction. Journal of Applied Psychology. 1991;76(127-133) |
| [12] | Trail G, Fink JS, Anderson DF. Sport spectator consumption behavior. Sport Marketing Quarterly. 2003;12:8-17 |
| [13] | Chavanat N, Martinent G, Ferrand A. Sponsor and sponsees interactions: Effects on Consumers' perceptions of brand image, brand attachment, and purchasing intention. Journal of Sport Management. 2009;23(5):644-70 |
| [14] | Turner BA, Jordan JS, Sagas M. Factors affecting response rates in survey research: The case of intercollegiate coaches. Applied Research in Coaching and Athletics Annual. 2006;21:211-37 |
| [15] | Bauer HH, Sauer NE, Schmitt P. Customer-based brand equity in the team sport industry. European Journal of Marketing. 2005;39(5/6):496-513 |
| [16] | Kwon HH, Trail G, James JD. The mediating role of perceived value: Team identification and purchase intention of team-licensed apparel. Journal of Sport Management. 2007;21(4):540-54 |
| [17] | Cunningham GB, Mahoney K. Self-efficacy of part-time employees in university athletics: The influence of organizational commitment, valence of training, and training motivation. Journal of Sport Management. 2004;18:59-73 |
| [18] | Kaplanidou K, Vogt C. The interrelationship between sport event destination image and sport tourists' behaviours. Journal of Sport & Tourism. 2007;12(3-4):183-206 |
| [19] | Reinboth M, Duda JL, Ntoumanis N. Dimensions of coaching behavior, need satisfaction, and the psychological and physical welfare of young athletes. Motivation and Emotion. 2004;38(3):297-313 |
| [20] | Coffman DL, MacCallum RC. Using parcels to convert path analysis models into variable models. Multivariate Behavioral Research. 2005;40(2):235-59 |
| [21] | Gribbons BC, Hocevar D. Levels of aggregation in higher level confirmatory analysis: Application for academic self-concept. Structural Equation Modeling. 1998;5(4): 377-90 |
| [22] | Brooke PP, Russell DW, Price JL. Discriminant validation of measures of job satisfaction, job involvement, and organizational commitment. Journal of Applied Psychology. 1988;73: 139-45 |
| [23] | Cramer D. Job satisfaction and organizational continuance commitment: A two-wave panel study. Journal of Organizational Behavior. 1996;17:389-400 |
| [24] | Williams LJ, Anderson SE. An alternative approach to method effects by using latent-variable models: Applications in organizational behavior research. Journal of Applied Psychology. 1994;79:323-31 |
| [25] | Kishton JM, Widaman KF. Unidimensional versus domain representative parceling of questionnaire items: An empirical example. Educational and Psychological Measurement. 1994; 54(3):757-65 |
| [26] | Smith AD. Nations and nationalism. Oxford: Oxford University Press 1995 |
| [27] | Eisenberger S, Huntington R, Hutchison S, Sowa D. Perceived organizational support. Journal of Applied Psychology. 1986;71:500-7 |
| [28] | Eisenberger S, Fasolo P, Davis-LaMastro V. Perceived organizational support and employee diligence, commitment, and innovation. Journal of Applied Psychology. 1990;75:51-9 |
| [29] | Gouldner AW. The norm of reciprocity. American Sociological Review. 1960;25:165-7 |
| [30] | Wayne SJ, Shore LM, Boomer WH, Tetrick LE. The role of fair treatment and rewards in perceptions of organizational support and leader-member exchange. Journal of Applied Psychology. 2002;87:590-8 |
| [31] | Fasolo P. Procedural justice and perceived organizational support: Hypothesized effects on job performance. In: Cropanzano RS, Kacmar KM, eds. Organizational politics, justice, and support: Managing the social climate of the workplace. Westport, CT: Quorum 1995:185-95 |
| [32] | Moorman RH, Blakely GL, Niehoff BP. Does perceived organizational support mediate the relationship between procedural justice and organizational citizenship behavior? Academy of Management Journal. 1998;41:351-7 |
| [33] | Pack S. Antecedents and consequences of perceived organizational support for NCAA athletic administrators[doctoral dissertation]. Columbus, OH: The Ohio State University; 2005 |
| [34] | Greenberg J. Organizational justice: Yesterday, today, and tomorrow. Journal of Management. 1990;16(2):399-432. |
| [35] | Leventhal GS, Karuza JJ, Fry WR. Beyond fairness: A theory of allocation preferences. In: Mikkula G, ed. Justice and social interaction. New York: Spring-Verlag 1980:167-218 |
| [36] | Eisenberger S, Armeli S, Rexwinkel B, Lynch PD, Rhoades L. Reciprocicaton of perceived organizational support. Journal of Applied Psychology. 2001;86:42-51 |
| [37] | Settoon RP, Bennett N, Liden RC. Social exchange in organizations: Perceived organizational support, leader- member exchange, and employee reciprocity. Journal of Applied Psychology. 1996;81:219-27 |
| [38] | Wayne SJ, Shore LM, Liden RC. Perceived organizational support and leader-member exchange: A social exchange perspective. Academy of Management Journal. 1997;40(1): 82-111 |
| [39] | Rhoades L, Eisenberger S, Armeli S. Affective commitment to the organization: The contribution of perceived organizational support. Journal of Applied Psychology. 2001;86: 825-36 |
| [40] | Jaros SJ, Jermier JM, Koehler JW, Sincich T. Effects of continuance, affective, and mora commitment on the withdrawal process: An evaluation of eight structural equation models. Academy of Management Journal. 1993;36:951-95 |
| [41] | Chelladurai P. Managing organizations for sport and physical activity: A systems perspective. 2nd. ed. Scottsdale, AZ: Holcomb Hathaway 2005 |
| [42] | MacLean JC, Chelladurai P. Dimensions of coaching performance: Development of a scale. Journal of Sport Management. 1995;9:194-207 |
| [43] | Cai L, Lee T. Covariance structure model fit testing under missing data: An application of the supplemented EM algorithm. Multivariate Behavioral Research. 2009;44:281-304 |
| [44] | Rahim A, Magner Nr, Shapiro DL. Do justice perceptions influence styles of handling conflict with supervisors? What justice perceptions, precisely? The International Journal of Conflict Management. 2000;11(1):9-31 |
| [45] | Niehoff BP, Moorman RH. Justice as a mediator of the relationship between methods of monitoring and organizational citizenship behavior. Academy of Management Journal. 1993;36(3):527-56 |
| [46] | Moorman RH. Relationship between organizational justice and organizational citizenship behaviors: Do fairness perceptions influence employee citizenship? Journal of Applied Psychology. 1991;76(6):845-55 |
| [47] | Meyer JP, Allen NJ, Smith CA. Commitment to organizations and occupations: Extensions and test of a three-component conceptualization. Journal of Applied Psychology. 1993;78: 538-51 |
| [48] | Bentler PM. Comparative fit indices in structural models. Psychological Bulletin. 1990;107:238-46 |
| [49] | Tucker LR, Lewis C. A reliability coefficient for maximum likelihood factor analysis. Psychometrika. 1973;38:1-10 |
| [50] | Browne MW, Cudeck R. Alternative ways of assessing model fit. Sociological Methods and Research. 1992;21:230-58 |
| [51] | Fornell C, Larcker DF. Evaluating structural equation models with unobservable variables and measurement error. Journal of Marketing Research. 1981;18:39-50 |
| [52] | Hu L, Bentler PM. Cutoff criteria for fit indexes in covariance structure analysis: Conventional criteria versus new alternatives. Structural Equation Modeling. 1999;6:1-55 |
| [53] | Armeli S, Eisenberger S, Fasolo P, Lynch PD. Perceived organizational support and police performance: The moderating influence of socioemotional needs. Journal of Applied Psychology. 1998;83:288-97 |
| [54] | MacCallum RC, Browne MW, Sugawara HM. Power analysis and determination of sample size for covariance structure modeling. Psychological Methods. 1996;1(2):130-49 |
| [55] | Browne MW, Cudeck R. Alternative ways of assessing model fit. In: Bollen KA, Long J, eds. Testing Structural Equation Models. Newbury Park, CA: Sage 1993:136-62 |
| [56] | Amorose AJ, Anderson-Butcher D. Autonomy-supportive coaching and self-determined motivation in high school and college athletes: A test of self-determination theory. Psychology of Sport and Exercise. 2007;In press:1-34 |
| [57] | Balabanis G, Diamantopoulos A, Mueller RD, Melewar TC. The impact of nationalism, patriotismo, and internationalism on consumer ethnocentri tendencies. Journal of International Business Studies. 2001;32(1):157-75 |
| [58] | Bandalos DL, Finney SJ. Item parceling issues in structural equation modeling. In: Marcoulides GA, Schumacker RE, eds. New Developments and techniques in structural equation modeling. Mahwaw: Lawrence-Erlbaum 2001:269-96 |
| [59] | Meyer JP, Allen NJ. Commitment in the workplace: Theory, research, and application. Thousand Oaks, CA: Sage 1997 |