-
Paper Information
- Next Paper
- Previous Paper
- Paper Submission
-
Journal Information
- About This Journal
- Editorial Board
- Current Issue
- Archive
- Author Guidelines
- Contact Us
International Journal of Psychology and Behavioral Sciences
p-ISSN: 2163-1948 e-ISSN: 2163-1956
2012; 2(1): 22-33
doi: 10.5923/j.ijpbs.20120201.04
The Hidden Bullied
 Abstract
 Reference
 Full-Text PDF
 Full-Text HTML
Gavin Dick 1, Charlotte Rayner 2
1Kent Business School, University of Kent, Canterbury, UK
2Portsmouth University Business School, Portsmouth University, Portsmouth, UK
Correspondence to: Gavin Dick , Kent Business School, University of Kent, Canterbury, UK.
| Email: |  |
Copyright © 2012 Scientific & Academic Publishing. All Rights Reserved.
In this article the authors look at those who have been largely ignored in previous research, those who experience bullying negative behaviours but who do not label themselves as bullied. The research objective is to examine the reliability of asking people to self-labelling themselves as bullied as a measure of actual bullying and to see if there is a threshold in the bullying experienced that leads to the bullied being willing to self label themselves as bullied and to what extent labelling as a victim of bullying impacts on the degree of emotional reaction to the negative behaviour experienced. Quantitative methods are used to analysis two large data sets to highlight a sub-set of people who do not self-label and test differences between them and the self-labelled bullied. The findings indicate that using a dichotomous system of the bullied and the not-bullied is confounding. Even at very high levels of negative behaviour there persists a tendency for respondents to not self-label. Also found was that regardless of whether self-labelled as a victim of bullying or not those who experience negative behaviour have similar strong emotional reactions to bullying. The research finds that self-labelling is a valid but unreliable measure of workplace bullying and suggests that using a Negative Behaviour index of experiences that takes into account persistence and intensity is a much more reliable measure that captures the totality of bullying.
Keywords: Dignity at Work, Bullying, Negative Behaviour, Harassment, Self-labelling, Measurement
Cite this paper: Gavin Dick , Charlotte Rayner , "The Hidden Bullied", International Journal of Psychology and Behavioral Sciences, Vol. 2 No. 1, 2012, pp. 22-33. doi: 10.5923/j.ijpbs.20120201.04.
Article Outline
1 Introduction
- This article focuses on negative behaviour at work; what is known as workplace bullying in the or mobbing in . A growing body of literature has found facets of interpersonal humiliation, aggression and destructive psychological manipulation in the workplace (Rayner, Hoel & Cooper 2002; Duffy Ganster & Pagon, 2002; Fox and Stallworth, 2004, (Burnes & Pope, 2007)). Bullying is about negative interpersonal behavior in interpersonal work relationships. It is not about isolated incidents between strangers, but is placed in the context of a relationship where the players have a past and a future together in the workplace(Heames, Harvey, & Treadway, 2006). Although there has been a growing trend to recognise the damaging nature of workplace bullying in organisations' Dignity at Work policies (CIPD, 2004), how to measure it accurately is far from clear. Typically measurement consists of respondents reporting specific behaviours, and then separately being asked if they consider themselves bullied commonly posed as a yes/no dichotomous question. Analysis invariably reports on categories of behaviour (as percentages) within a population and incidence of labelling also as percentages reporting the numbers of people who both label and report. Somereporting conjoins the two methods in broad terms, for example by behaviours (see Rayner and Keashly, 2005). There is no doubt about the widespread occurrence of bullying behaviours and labelling (e.g. Rayner, 1997; Harlos and Pinder, 1999; Einarsen, 1999; Zapf & Gross, 2001; Keashly & Jagatic, 2003; (Hodson, Roscigno, & Lopez, 2006)), what is not known is the reality of the workplace experience across a continuum of negative behaviour from low levels through to and beyond what currently constitutes the dichotomous cut-off points that define being bullied in the extant literature. In this article we look at those who have been largely ignored in previous research; those who experience negative behaviour (bullying) but do not label themselves as bullied. Our objective is to see how reliable self-labelling is in measuring bullying and to what extent labelling as a victim of bullying impacts on the degree of emotional reaction to the negative behaviour experienced. So is negative behaviour a problem other than for those who label themselves as victims of bullying? What is clear from the literature is that when negative behaviour is experienced persistently, the victim has negative health outcomes whether they label themselves as bullying victim or not (Hoel, Faragher, & Cooper, 2004). This strongly indicates that workplace negative behaviour can have serious consequences for the individual’s well being, but also consequential organisational costs due to sickness, lower than average staff performance and eventually staff turnover as the ‘victim’ leaves the organisation to escape the negative behaviour (Rayner, 1998) or resists in other ways (Lutgen-Sandvik, 2006). Conceptualisations, measurements and definitions are inexorably linked, often through an iterative process as one informs the others. In this research we attempt to inform what an unacceptable level of negative behaviour is and thus conceptualise what can be considered as bullying outside of victim labels. To do this we use a negative behaviour measurement continuum rather than dichotomous catagories. An approach similar to that used by (Lutgen-Sandvik, Tracy, & Alberts, (2007) who use a continuum they describe as ‘degrees of bullying’. In this study we use quantitative methods of analysis on two large data sets in order to highlight this sub-set of people and the parameters associated with them. We will seek to hasten the process of investigation by bringing to bear knowledge and processes that have been used in the parallel area of sexual harassment; a considerably more conceptually developed research area than bullying.We start by examining the literature on bullying and negative behaviour and how it is measured before going on to explain our research approach and methods
2 Bullying at Work
- Early studies by pioneering researchers of bullying at work established two main approaches. The first, Heinz Leymann, identified a set of negative behaviours using critical incident technique with severely affected targets of bullying. He calculated incidence by asking respondents whether negative behaviours had been experienced weekly and also if they had occurred for at least six months. He did not ask people either to label themselves as bullied or not (e.g. Leymann, 1990).This approach was further developed by Einarsen et al (1994) who extended the frequency to include ‘now and then’ as well as the daily/weekly measures of Leymann. The key difference introduced by Einarsen was that of labelling, and he only counted those who experienced negative behaviours and who also labelled themselves. The research community has broadly adopted Einarsen’s introduction of labelling. Frequency centres on weekly behaviours, although the time period over which measurement is taken varies from six months to two years (see Hoel, Rayner & Cooper, 1999, for a review).Considerable debate has focused on how to ‘count’ those who are bullied (e.g. Einarsen et al, 2003; Rayner et al, 2002) and is summarised here. As bullying is thought to be about repeated actions, some persistency of experience of negative behaviour over the last six months (at least) has been used by researchers. However, there is an ongoing debate as to whether only those who label themselves as bullied should be counted, as only half those who have experience weekly negative behaviour during the last six months also label themselves as bullied (Rayner, 1999). Her comparison of the different bullying measures produced different levels of incidences; but more fundamentally it showed that different measures included quite different sets of people. Thus any subsequent analysis of ‘the bullied’ would draw on different sub-populations, depending on which measurement definition is used. A by-product of this methodological comparison was the discovery of a large number of people who reported experiencing negative behaviour at work on a frequent basis, but who did not label themselves as bullied. This finding is similar to other studies that use different lists of behaviours (e.g. Hoel & Cooper, 2000; Cowie & Jennifer, 2000). Thus we appear to have a fairly stable phenomenon in UK studies that shows that as many as half of those who experience weekly negative behaviours do not label themselves as ‘bullied’ yet most research has ignored them by focusing only on the self-labelled bullied. A recent US study has highlighted only one-third of US participants self-label(Lutgen-Sandvik et al., 2007)To date, studies into bullying at work have typically asked respondents whether they have been bullied at some point and then have only asked those who have labelled themselves as bullied to give further information about the incidents that they have experienced. Clearly this is an inappropriate methodology if we are to gather information about the experience of negative behaviour at work. A noteworthy exception to this that asked every respondent every question (Hoel & Cooper, 2000) identified that, regardless of whether or not someone labels himself or herself as bullied, the experience of negative behaviour at work has negative health outcomes.What, then, can we hope to learn from the group of non-labellers, and how should we take forward our understanding and definition of bullying at work? To inform us how to fast-track our research approaches we now examine the parallel field of sexual-harassment that has seen considerable methodological advances in the last few years. Early studies into sexual harassment also revealed that there was an issue of labelling that confounded the measurement of the phenomena (Fitzgerald, Gelfand and Drasgow [1995] provide a useful review). Repeatedly, studies found that negative outcomes were reported by those who experienced sexually harassing behaviours regardless of whether they label themselves as sexually harassed. The issue can be tracked over the years, and a very large study into the US military allowed several of the definitional arguments to be revisited. One paper from the military study stated ‘labelling incidents as sexual harassment is of marginal meaningfulness in terms of job outcomes and antecedents of harassment’ (Munson, Miner & Hulin, 2001:293). Indeed this view reflects the current practice of incidence measurement in sexual harassment where the focus is on reports of experience of behaviours. The Sexual Experiences Questionnaire (SEQ) has been developed over a period of ten years and currently has 26 items, only one of which relates to labelling their experience as sexual harassment (e.g. Hay & Elig, 1999). One of the most obvious routes of investigating why people do or do not label is to examine the experiences they report. This was a priority for the sexual harassment researchers who discovered that non-labelling respondents reported a shorter list of behaviours experienced than people who did label themselves as sexually harassed. This finding adds validity to the notion of a ‘threshold’ idea – that people need to have had had ‘sufficient’ exposure in order to label. This led us to our first proposition for this investigation that examines the propensity to self-label to the intensity/ frequency of behaviours reported. Sexual harassment researchers are very clear and highly consistent in minimising the importance of labelling. We can see a very solid case for also taking such a stance in bullying, since if an organisation wishes to assess the (potential) damage from negative behaviour, they must include all people who experience negative behaviour given that these people also experience negative outcomes (Hoel & Cooper, 2000; Hoel et al, 2004; Lutgen-Sandvik et al., 2007). However, we also make the case for the importance of understanding the labelling issue further in this research on two grounds. Firstly, it may expose different emotional reaction propensities to the experience of negative behaviours. Secondly it may be that the currently used research definition cut-off point of being bullied is lower than many respondents will accept constitutes bullying. If this were the case we would expect a sharp decline in refusal to self-label at some higher point in the intensity/frequency of negative behaviour. On the other hand if we view bullying as a process of escalating conflict (Einarsen, 1999) with progressive increases in the frequency/intensity of negative behaviours, we would postulate that intervention at an early stage would be more likely to succeed than intervention at a later point after the working relationship(s) has broken beyond repair (UNISON, 2000). Thus picking up signs of escalating levels of workplace negative behaviour that are still below those that are currently viewed as constituting bullying can be a signal to mobilise Personnel, HRM, Trade Union or other professionals to defuse the situation early and quickly (Rayner, Hoel & Cooper, 2002). A final point is one which cannot be answered here, but one which will be returned to in our discussion. The process of bullying is a complex one, and it would be helpful to understand exactly where labelling fits within it. What other variables are at play that differentiates non-labellers and labellers?Our literature search revealed agreement that as bullying progresses, the overall emotional reaction to it increases in intensity (e.g. Adams, 1992). This fits well with the notion of conflict escalation. The appropriateness of choosing emotional reaction as a measure of the effect of negative behaviour is shown from the research by Munson, Miner & Hulin (2001) into the effects of sexual harassment on 28,000 men and women in the military. Their research showed that emotional reaction had the strongest association with harassment compared to other outcomes such as psychological well-being, health, or organizational commitment.
3. Methodology
- The research questions derived from the literature and the propositions derived from them are:What is the influence of respondent demographics?P1 the respondents ’ age, gender, job tenure, job seniority or ethnic origins, will be predictor of Negative Behaviour experienced, propensity to self-label bullied and or their emotional reaction to negative behaviour.Does the self-label category count relate to the level of negative behaviour experienced and reflect its occurrences? If it does, we would expect the number of cases self-labelling bullied to increase rapidly as number of negative behaviours and their frequency increases. Conversely the number of cases at higher levels will decline rapidly because few will remain who have not self-labelled bullied if the labelling reliably reflects the number being subjected to bullying.P2 the propensity to self-label as bullied in the last six months will relate to the intensity/frequency of negative behaviour experienced and reflect the number of case occurrences. Is the bullying definition threshold too low, so it does not equate to the non-labellers understanding of what is bullying is, leading them to not self-label? In other word is there some higher negative behaviour threshold where the propensity to self-label increases.P3 the propensity to self-label bullied will increase substantially at some threshold level of intensity/frequency of negative behaviour.Do self-labellers have a stronger emotional reaction to negative behaviour? Could this variable explain their propensity to self-label bullied?P4 the emotional reaction to the intensity/frequency of negative behaviour will be greater in those self-labelled bullied than in those that do not self-label themselves bullied.To summarise our research design examines the relationships between the following variables: a Negative Behaviour measure, a dichotomous Bullied Not-Bullied self-label, an Emotional Reaction Construct and a range of individual and work related demographic variables.
3.1. The Surveys
- This research brings together the results of two major questionnaire surveys of members of the UK's largest trade union UNISON that has members who work mainly in the public sector. The initial survey was sent to a random sample of 5000 members with usable returns of 761 of which 56 per cent were civic workers, 26 per cent health workers, with most of the remainder being either education or utility company workers. UNISON confirmed that the returns profile reflected their membership in terms of sector. The second survey was sent to a random sample of 4000 members in the police section of UNISON (civilian police employees) and elicited 690 usable responses. In our analysis and findings, we use the title ‘General survey’ to describe the full membership survey and use the title ‘Police survey’ for the survey of police civilian workers. Analysing the two surveys allows us to compare and contrast the experience of workers in different occupational groups in order to see whether broad conclusions can be made about negative behaviour, the emotional reaction to it and the relationships to labelling as bullied. The respondent profile for the two surveys is shown in Table 1 where it can be seen that both survey respondents’ profiles are broadly comparable and show satisfactory representation across age ranges, gender and job levels.
3.2. Development of a Negative Behaviour Measurement
- The partner organisation rejected the two existing survey tools, the Negative Acts Questionnaire (NAQ),(Einarsen & Skogstad, 1996) and the Leymann Inventory of Personal Terrorization (Leymann, 1996) due to the number of items and scales used. There was no definitive list of bullying behaviours at the time (see Keashly and Jagatic 2003 for a review) although interpersonal bullying was thought to be distinct from organisational bullying (Harlos & Pinder, 1999; Liefooghe & MacKenzie Davey, 2001). This situation has not changed with qualitative studies continuing to demonstrate employees’ and academics’ lack of clarity for delineation between ‘negative behaviour’, ‘bullying’ and other constructs (Serantes & Suarez, 2006). In order to generate a smaller item list, a qualitative review was undertaken into reports of workplace bullying in Andrea Adams text (Adams, 1992) which resulted in 13 items being identified which covered the scope of behaviours reported in the text. These items were compared to the LIPT and the NAQ and range coverage was found to be adequate. In the questionnaire respondents were asked if they had experienced any of the thirteen behaviours listed in the last six months, following the style of Einarsen’s NAQ (ibid). They were given a frequency response choice for each of the negative behaviours of, every day, every week, every month, less than once a month and never. These frequencies are less ambiguous than those found in the NAQ which had been rejected by our partner organisation. Our index of negative behaviour is a computed composite of thirteen "bullying behaviour" questionnaire items from the surveys’ questionnaires. In the coding of the behaviours we depart from the common practice in behavioural research of treating these as an ordinal variable scale since our surveys have data that has ratio scale characteristics because the choices offered to respondents reflect frequency of occurrence of negative behaviour. Therefore, before any composite index is computed the individual negative behaviours need to be weighted by the frequency of occurrences to convert the scores into a standardised ratio scale. Thus, we take the view that bullying is most effectively conceptualised as a continuum that uses as it measure a composite index of the number of acts and their frequency of occurrence. Researchers in the USA also conceptualise bullying in a similar way and calculate a composite index called ‘degrees of bullying’ using similar logic (Lutgen-Sandvik, Tracy and Alberts, 2007). The ratio scale approach we advocate has the advantage of avoiding the ordinal scale’s built in tendency at a composite measurement level to exaggerate low frequencies of negative behaviour at the expense of high levels. For instance if we used a ordinal scoring system where every day is coded as 4 and less than once a month is coded as 1 then we are implying in a composite variable that four experiences at less than once per month (4) equate to one experience daily (4). This clearly exaggerates the importance of the frequency of low level negative behaviour and inflates the value of the composite variable. This low-end exaggeration of frequency is a great concern in a behavioural variable such as this one where low frequencies of negative behaviours (less than once a month) are likely to be experienced by many cases, while those who experience higher frequencies of negative behaviour (daily) are likely to a minority. Therefore, we choose to code our data as a ratio variable that reflects the ratio of occurrences of the behaviours experienced. To standardise the scale so it has linear characteristics we coded the responses to reflect the ratios so that every week equated to 1, and, assuming a five day working week and a twenty day working month the others were coded proportionally, so that daily occurrence equated to 5, weekly to 1, monthly to 0.25, and less than monthly to 0.12. The scores for each respondent on the thirteen behaviour items were then combined into an index to take into account the intensity of negative behaviours experienced (see appendix for an example of the method). Thus, it can be seen that the index is one that combines intensity (the number of negative behaviours experienced) with frequency (how often the negative behaviours are experienced). Clearly, a weakness in such a composite measure is the assumption that all negative behaviours are equal in impact. However, in the absence of a sound theoretical base to allow weighting of individual behaviours this problem is unavoidable. The advantage of such an index is that it allows comparisons to be made at a composite level of what is a multi-dimensional phenomenon. What of course is hidden by this approach is a full understanding of the underlying dimensions. However, we report on this in another paper (Rayner & Dick, 2004). The negative behaviour questionnaire items were factor analysed for both questionnaires using a principal component analysis with a Varimax rotation that produced a nearly identical four-factor model for the two surveys. Overall, sixty-six per cent of the variance can be explained by the four factors in both the surveys.
|
|
3.3. Bullying Self-Label Variable
- After answering questions on negative behaviour and emotional reactions, respondents were asked in the questionnaires ‘Have you been bullied in your job in the last six months’ Yes or No. In the covering letter, correspondents were given the following description of bullying. ‘Workplace bullying is when an employee is systematically mistreated and victimized by fellow workers, or supervisors through repeated negative acts like ridicule, offensive comments, verbal abuse, malicious rumours, social exclusion, or persistent unfair criticism.’.
|
3.4. Development and Testing of an Emotional Reaction Measure
- Our emotional reaction variable is based on a composite of eleven "emotional reaction" items in the questionnaire. These items were posed directly after the negative behaviour questions and they asked respondents what emotional reactions they had to their treatment. A five-point ordinal scale was given for each emotion ranging from "a great deal" to "not at all". Thus, the emotional reaction variable combines both the degree of emotional reaction and the range of emotional reactions experienced. The emotional reaction questionnaire items were factor analysed for both questionnaires using a principal component analysis with a Varimax rotation. This produced loading on all the items on just one factor for the two surveys. Confirmatory factor analysis of the emotional measurement model confirmed construct validity with all fit statistics converging on a good fit for a unidimensional model for both surveys (RMSEA: 0.087, 0.100. NFI: 0.954, 0.956. CFI: 0.960, 0.961). Measurement of the scale’s reliability was satisfactory with a Cronbach’s alpha of 0.95 for the Police survey and 0.92 for the General survey. We name this variable Emotional Reaction. The observed variables for this scale are detailed latter in Table 9.To test the combined measurement model’s stability across the samples we used AMOS’s capacity for multi-sample analysis. We found no significant differences (X2 difference of 1.47 for 3 DF, p >0.5) in the structural parameters obtained by freely estimating the model in both samples and those obtained by constraining the structural parameters in the second survey to those in the first survey. This result shows a strong cross-survey validation of the constructs we have used and the measurement model used in the surveys for bullying factors and the emotional reaction factor.
4. Research Results
4.1. Demographic Affects
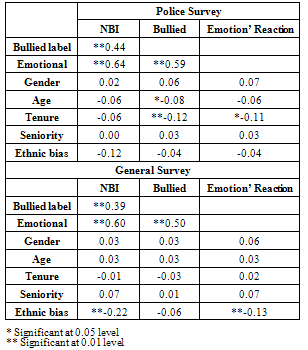
- To assess whether demographic variables are associated with the level of the Negative Behaviour Index (NBI), propensity to self-labelled bullied (Bullied) or Emotional Reaction, we calculated the correlation for respondents, gender, age, tenure and job seniority. In addition to see if ethnic origin was associated we created a dichotomous label that we describe as Ethnic Bias where those of Caucasian origin are contrasted with those from other ethnic origins. The correlations are shown in Table 5 for the Police survey and the General survey.
|
| ||||||||||||||||||||||||||||||||||||||
4.2. Negative Behaviour and Self-Labelling Bullied for the Four Populations
- The percentage of people who self-labelled ‘bullied’ in the last six months for the Unison members employed in the civic, health, miscellaneous and police sectors are presented in Table 7. Those shown as "bullied yes" have self-labelled themselves as bullied in the job in the last six months. The proportion that view themselves as bullied at work ranges from sixteen per cent in civic workers to twenty seven per cent in the miscellaneous category (covering workers in utility firms and education establishments for example.)
| ||||||||||||||||||||||||||||||||||||||||||||||||||
4.3. Levels of Negative Behaviour and the Propensity to Self-labelled Bullied
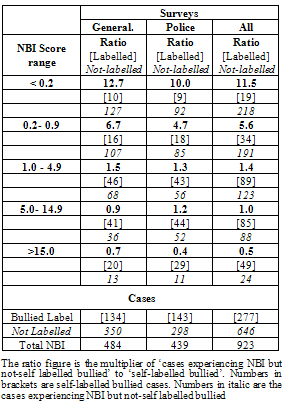
- In Table 8 we compare the ratio of those who do not label themselves as bullied to those who do for the two surveys, for different ‘zones’ of the Negative Behaviour Index.
|
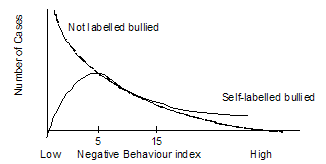 | Figure 1. The actual number of cases against the Negative Behaviour Index for self-labelled bullied and not |
4.4. Labelling and Emotional Reaction to Negative Behaviour
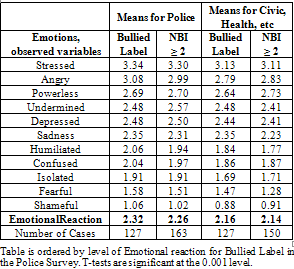
- We suggested earlier in our propositions that the emotional reaction to the negative behaviour could be greater in those that self-label bullied than in those that do not (Proposition 4). Implied is the suggestion that those who have less of an emotional reaction to negative behaviours will have a lower propensity to self-label themselves as bullied. If this is true then it may explain the large number of workers who refuse to self-label themselves bullied despite experiencing high levels of negative behaviour (Proposition 3). The correlations shown in Table 5 for the association of Emotional Reaction to self-labelled bullied is 0.59 in the Police survey and 0.50 in the General survey while the correlation to NBI is larger at 0.64 for the Police survey and 0.60 for the General survey (all are statistically significant at the 0.01 level). Therefore, it seems that Emotional reaction is not more strongly associated with self-labelling than the NBI index. However, an explanation may be due to differences in levels of emotional response to the individual observed emotion variables that make up the Emotional Reaction measure. To do this we look next at the means for these individual emotion variables for the self-labelled and the non-self-labelled. To achieve parity we calculated the means for the Emotional Reaction Variable for the self-labellers (2.32 Police, 2.16 General) and then computed the approximate NBI level that had an Emotional Reaction mean that equated to it for those who do not self-label ( ≥ 2 NBI). Thus by standardising on the overall Emotional Index for the labelled and non-labelled groups we can contrast their patterns of emotional experiences to see if the differences might help illuminate labelling behaviour.Table 9 shows for the two surveys the means for NBI against the emotion observed variables for those who labelled bullied compared to those who did not label who experienced a score on the NBI of 2 ors more. The rank order of the emotion observed variable means are ordered by those found in the Police survey. Comparison of the rankings between the Bullied labelled and the NBI ≥ 2 shows there are identical rankings in both the Police and the General survey. Differences exist in the means but these are modest and follow no particular pattern. Likewise, there are very few differences between the two surveys in terms of rankings or means. Overall, these remarkably similar results in emotional reaction patterns and the correlations for the composite variable Emotional Reaction for the two surveys indicate that there is no evidence to support our proposition. Therefore, we can eliminate the possibility that it is different levels or patterns of emotional reaction to negative behaviours that distinguish those who self-label from those who do not. Clearly, the propensity to self-label as bullied has little to do with having stronger or different reactions to negative behaviour than the non- labelled.
|
5. Discussion of Results
- We summarise the findings and relate this to other research by revisiting the four research propositions. What is the influence of respondent demographics?The respondents’ age, gender, job tenure, job seniority or ethnic origins, will be predictor of Negative Behaviour experienced, propensity to self-label bullied and or their emotional reaction to negative behaviour.Overall, our findings disconfirm the propositions since it was found that a respondent’s gender or seniority has little or no influence on whether they experience bullying behaviours at work. However, in one of the surveys older respondents and those with longer tenure were slightly less likely to experience bullying behaviour than younger respondents. This British finding contradicts the findings from Scandinavian data (Einarsen and Raknes, 1997) where older workers were more likely to experience bullying– clearly a potential for future cross-cultural exploration. Although we have found that non-Caucasian ethnic groups do have higher means for NBI, the low number of non-Caucasian participants indicates that generalised conclusions should not be drawn. The propensity to self-label as bullied in the last six months will relate to the intensity/frequency of negative behaviour experienced and reflect the number of case occurrences. The pattern of increasing numbers of self-labelled bullied as negative behaviours scores increase and the frequency graph shown earlier in Figure 1 both support the proposition in so much as they relate to the intensity/frequency of negative behaviour. We can safely say that those who self-label do for the most part experience a range of negative behaviours that are above the lower end of bullying frequency but there are a small numbers of self-labellers who do so on at very low levels (a negative behaviour experienced less than once per month). It is clear from our findings that self-labelling does not reflect accurately the number of cases experiencing high levels of negative behaviour since more than half remain, who will not self-label bullied. Therefore, we must conclude that self-labelling is a reasonably valid but unreliable measure of workplace bullying compared to the Negative Behaviour Index.The propensity to refuse to self-label bullied in those who have experienced negative behaviour, that meets the self-labelled bullied definition, will reduce substantially as the intensity/frequency of negative behaviour increases.Contrary to our expectations our findings show that the propensity to avoid self-labelling persists even at higher levels of negative behaviour and that there is no threshold level where a substantial number of non-labellers switch to self-labelled bullied. We speculated in our proposition’s underpinning theory that even though a definition was supplied within the study, that respondents may not hold the same definition and this could have produced non-labelling. Liefooghe (2001) has explored the issue of the social construction of bullying at work that has revealed many different ways of conceiving bullying. If respondents hold a certain definition in their minds, it is possible that they use this definition to label themselves rather than the definition supplied by the researchers. Indeed recent work in the UK has shown a lack of agreement amongst workers on what constitutes ‘bullying behaviour’ (Rayner and McIvor, 2006). However, we observed no threshold type reduction at a higher level of negative behaviours. This suggests that it is not a question of definition of which negative experience constitutes bullying or how frequently it occurs for these non-labellers. So it would appear that there are other mechanisms at work with the non-labellers, who, in this study, are also experiencing negative behaviour at work. Many possibilities exist such as shame, the playground stereotypes, or a lack of awareness (e.g. Lewis, 1999). For those undertaking surveys, the answer as to why there is a lack of labelling may take years to appear, but it is likely the lack of labelling will still be present regardless. Finally, we come to our fourth proposition which was The emotional reaction to the intensity/frequency of negative behaviour will be greater in those self-labelled bullied than in those that do not self-label themselves bullied.Our findings contradict this proposition. In both surveys we have found that there are similar correlations with emotional reaction for the workers who do not self-label bullied, and the self-labelled cases. This is confirmed by our findings that the profile of means and their rankings of individual emotional reactions were remarkably similar for both labelled and non-labelled bullied in both surveys. Overall, the findings indicate that differences in emotional reaction have no explanatory power in predicting a propensity to self-label bullied. Looking at it another way, the findings reinforce the ineffectiveness of self-labelling as a means of judging the scale of workplace negative behaviours, as it is clear that its emotional effects on those who chose not to self-label themselves is as severe as those who labelled bullied. This is also found in the sexual harassment surveys (e.g Munson et al, 2001) where there appears to be no difference in emotional reaction between labellers and non-labellers
6. Conclusions
- It is hoped that this study will contribute to the question about how academic fieldwork and employers should measure and ‘count’ those who are bullied at work. Our findings indicate that only using a dichotomous system of the bullied and the non-bullied is likely to confound research results. There persists a tendency for respondents who experience bullying not to self-label. This is true in a wide range of organisational settings from Health Care to Police forces. Our findings suggest strongly that the lead taken in the sexual harassment research field (Hay & Elig, 1999) should be followed in bullying measurement by concentrating reporting on the behaviours experienced rather than on dichotomous self reports, regardless of definitions used. For researchers it will also have the advantage of providing a richer picture of the phenomena that will help a deeper understanding of the nature of bullying escalation. For practitioners a measurement that is scaled, rather than the number self-labelling ‘bullied’ (or not), also has advantages. It allows the organisation to measure levels of negative behaviour in different areas of a business and identify those where intervention is required. Also the effect of Dignity at Work training can be monitored by such means. There is evidence (e.g. Hoel et al, 2004; Lutgen-Sandvik, 2006) that experience of bullying behaviour at work has negative health effects regardless of labelling. Our findings support this notion as we have found that the emotional reaction to negative behaviour has been proportional to it regardless of any labels of bullied or not. The strong association found between negative behaviour and the emotional reactions to it suggest that negative health and psychological effects can be expected in conjunction as has been found in the sexual harassment research (Munson, Miner & Hulin, 2001). These findings suggest surveys which ask yes or no style questions on whether someone feels bullied are unlikely to show the true level of negative behaviour experienced. Instead employee surveys need to ask about the frequency of a range of negative acts such as the ones used in this research. Our findings of the strong emotional reaction felt to bullying experiences suggest persistent workplace negative behaviour has consequences for employees’ well being, but also consequential organisational costs due to sickness, lower than average staff performance and eventually staff turnover as the ‘victims’ leave the organisation to escape the negative behaviour. It can be concluded that researchers and employers should be investigating the experience of negative behaviour at work, rather than investigating only those who label themselves as bullied. What can not be ignored by practitioners is that there are substantial groups of people who are not labelling themselves as bullied but who are experiencing bullying behaviours. Our data suggests that the employer must measure behavioural experience to be satisfied they are reliably tracking workplace bullying activity in their organization.
Notes
1Note: We call this intense since an NBI score of ≥ 15 cannot be achieved unless it includes daily frequency.
References
| [1] | Adams, A. (1992). Bullying at Work - How to Confront and Overcome It. London: Virago |
| [2] | Burnes, B., & Pope, R. (2007). Negative behaviours in the workplace: A study of two Primary Care Trusts in the NHS. International Journal of Public Sector Management, 20(4): 285-303 |
| [3] | (CIPD) CHARTERED INSTITUTE OF PERSONNEL AND DEVELOPMENT. (2004) Managing conflict at work: a survey of the UK and Ireland. London: CIPD |
| [4] | Cowie, H. and Jennifer, D., (2000). Comparing the nature of workplace bullying in two European countries: Portugal and UK. In M. Sheehan, S. Ramsey & J. Patrick (Eds) Transcending Boundaries: Integrating People, Processes and Systems. Proceedings of the 2000 Conference, Griffith University, Australia |
| [5] | Einarsen, S., & Skogstad, A. (1996). Bullying at Work: Epidemiological Findings in Public and Private Organizations. European Journal of Work & Organizational Psychology, 5(2): 185-197 |
| [6] | Einarsen, S., (1999). The nature and causes of bullying at work International Journal of Manpower, 20 (1/2): 16-27 |
| [7] | Einarsen, S., (2000). Harassment and Bullying at Work: A Review of the Scandinavian Approach Aggression and Violent Behavior, 5(4): 379-401 |
| [8] | Einarsen, S., Hoel, H., Zapf, D., & Cooper, C., (2003). The concept of bullying at work Chapter in S. Einarsen, H. Hoel, D. Zapf., & C. Cooper. Bullying and emotional abuse in the workplace: International research and practice perspectives London, UK: Taylor Francis pp. 3-30 |
| [9] | Einarsen, S., Raknes, B.I., Matthiesen, S.B. and Hellelsoy, O.H., (1994). Bullying and harassment work and their relationship to work environment quality - and exploratory study, European Work and Organizational Psychology, 4:381-401 |
| [10] | Einersen, S. & Raknes BI., (1997). Harassment in the workplace and the victimisation of men. Violence and Victims, 12(3):247-63. |
| [11] | Fitzgerald, L.F., Gelfand, M.J., Drasgow, F., (1995). Measuring sexual harassment: Theoretical and Psychometric Advances Basic and Applied Social Psychology, 17(4): 425-445 |
| [12] | Harlos, K.P. & Pinder, (1999). Patterns of Organizational Injustice: A Taxonomy of what employees regard as unjust. Advances in Qualitative Organizational Research, 2: 97-125 |
| [13] | Hay, M.S., & Elig, T.W., (1999). The 1995 Department of Defense Sexual Harassment Survey: Overview and Methodology Military Psychology, 11(3): 233-242 |
| [14] | Heames, J. T., Harvey, M. G., & Treadway, D. (2006). Status inconsistency: an antecedent to bullying behaviour in groups. International Journal of Human Resource Management, 17(2): 348-361 |
| [15] | Hodson, R., Roscigno, V. J., & Lopez, S. H. (2006). Chaos and the abuse of power - Workplace bullying in organizational and interactional context. Work and Occupations, 33(4): 382-416 |
| [16] | Hoel, H., & Cooper C.L., (2000). 'Destructive conflict and bullying at work' November 2000' Unpublished report, University of Manchester Institute of Science and Technology |
| [17] | Hoel, H., Faragher, B., & Cooper, C.L., (2004). Bullying is detrimental to health, but all bullying behaviours and non-necessarily equally damaging British Journal of Guidance and Counselling, 32(3): 367-387 |
| [18] | Hoel, H., Rayner, C., & Cooper, C.L., (1999). Workplace Bullying International Review of Industrial and Organizational Psychology, 14: 189-230 |
| [19] | Keashly, L. & Jagatic, K., (2003). By any other name: American perspectives on workplace bullying. Chapter in S. Einarsen, H. Hoel, D. Zapf., & C. Cooper. Bullying and emotional abuse in the workplace: International research and practice perspectives. London, UK: Taylor Francis |
| [20] | Lewis, D., (1999). Workplace Bullying - interim findings of a study in further and higher education in Wales, International Journal of Manpower, 20(1/2): 106-118 |
| [21] | Leymann, H. (1996). The content and development of mobbing at work. European Journal of Work & Organizational Psychology, 5(2): 165-184 |
| [22] | Leymann, H., (1990). Mobbing and Psychological Terror at Workplaces Violence and Victims, 5: 119-125 |
| [23] | Liefooghe, A. P. D., & MacKenzie Davey, K. (2001). Accounts of workplace bullying: The role of the organization. European Journal of Work and Organizational Psychology, 10(4): 375-392 |
| [24] | Liefooghe, A., (2001). PhD Thesis, Surrey University |
| [25] | Lutgen-Sandvik, P. (2006). Take this job and ... : Quitting and other forms of resistance to workplace bullying. Communication Monographs, 73(4): 406-433 |
| [26] | Lutgen-Sandvik, P., Tracy, S. J., & Alberts, J. K. (2007). Burned by bullying in the american workplace: Prevalence, perception, degree and impact. Journal of Management Studies, 44(6): 837-862 |
| [27] | Munson, L.J., Miner A.G., & Hulin, C., (2001). Labeling Sexual Harassment in the Military: An extension and replication Journal of Applied Psychology, 86(2): 293–303 |
| [28] | Nunnaly, J.C., (1978), Psychometric Theory, 2nd edition, McGraw-Hill, New York |
| [29] | Rayner, C. & Dick, G., (2004). Exploring the Workplace Bullying Construct: an Evidence-based Approach, American Academy of Management Annual Meeting, New Orleans |
| [30] | Rayner, C. & Hoel, H., (1997). A Summary Review of Literature Relating to Workplace Bullying. Journal of Community and Applied Social Psychology, 7 (3): 181-191 |
| [31] | Rayner, C. & Hoel, H., and Cooper, C.L. (2002). Bullying at work: what we know, who is to blame and what can we do? London, Taylor Francis |
| [32] | Rayner, C. (1998). Workplace bullying: do something! The Journal of Occupational Health and Safety - Australia and New Zealand 14(6): 581-585 |
| [33] | Rayner, C. and Keashly, l., (2005). Bullying at work: a perspective from Britain and North America in Fox , S. and Spector, P. (Eds), Counterproductive Work Behaviours. Washingto D.C.: American Psychological Association, 271-96 |
| [34] | Rayner C, McIvor K., (2006).Report to the dignity at work project steering committee, research findings. Portsmouth University Business School |
| [35] | Rayner, C., (1999). A comparison of two methods for identifying targets of workplace bullying. Abstracts for the Ninth European Congress on Work and Organizational Psychology, p88 Finnish Institute of Occupational Health, Helsinki |
| [36] | Serantes, N. P., & Suarez, M. A. (2006). Myths about workplace violence, harassment and bullying. International Journal of the Sociology of Law, 34(4): 229-238 |
| [37] | UNISON (1997). UNISON members’ experience of bullying at work London, UNISON |
| [38] | UNISON (2000) Police Section UNISON members experience of bullying at work London, UNISON |
| [39] | Woodman, P., & Cook, P. (2005). Bullying at Work: The experience of managers. London: Chartered Management Institute |
| [40] | Zapf, D., & Gross, C., (2001). Conflict escalation and coping with workplace bullying: A replication and extension, European Journal of Work and Organizational Psychology 10(4):497-522 |
| [41] | Zapf, D., Knorz, C. and Kulla, M., (1996). On the Relationship between Mobbing Factors, and Job Content, Social Work Environment, and Health Outcomes, European Journal of Work & Organizational Psychology, 5(2): 215-237 |