Alaa H. Ali, Radhi M. Chyad, Ahmed A. Hamed, Noon K. Chya
Ministry of Science and Technology, Materials Research Department, Laser and Opto-electronics Research Center, Baghdad, Iraq
Correspondence to: Alaa H. Ali, Ministry of Science and Technology, Materials Research Department, Laser and Opto-electronics Research Center, Baghdad, Iraq.
| Email: |  |
Copyright © 2019 The Author(s). Published by Scientific & Academic Publishing.
This work is licensed under the Creative Commons Attribution International License (CC BY).
http://creativecommons.org/licenses/by/4.0/

Abstract
The laser-induced breakdown spectroscopy system (LIBS) had been designed for analysis of two samples of Iraqi soil in Basra (Zubair and Faw) via analysis of induced plasma emissions that generated via high peak power laser pulse, the system that design consist of Nd:YAG laser passively Q-switched with output laser pulse energy (120mJ@1064nm) and (10ns) pulse duration, the laser beam was focused via converging lens with a focal length (100mm) that had generated (15.28*106W/mm2) power intensity, optical spectrum analyzer with spectrum range of (320-740 nm) and (0.2nm) optical resolution had been used to analysis of emitted plasma spectrum, three emission lines had been recorded (383.96, 393.40 and 394.44 nm) which are compared with NIST database, the research had focus on Uranium element in the soil, that is considered as the most dangerous pollutants on the environment and a major cause of cancer in Basra.
Keywords:
LIBS, Depleted uranium, Remains Uranium, Laser power density
Cite this paper: Alaa H. Ali, Radhi M. Chyad, Ahmed A. Hamed, Noon K. Chya, Laser-Induced Breakdown Spectroscopy (LIBS) to Detect of Remains Uranium Metals in the Basra Soil, International Journal of Optoelectronic Engineering, Vol. 9 No. 1, 2019, pp. 1-4. doi: 10.5923/j.ijoe.20190901.01.
1. Introduction
With the development of weapons of the war and the need for more kill and destruction the great nations was directed to the non-conventional weapon, The DU (depleted uranium) had been used in military weapons due to its ability to penetrate armored vehicles, tanks and bunkers [1], this weapons had been used in several places in the (Balkans) during 94-95, (Bosnia Herzegovina), during 99 (Kosovo, Serbia) and used in Iraq during (1991 and 2003) especially in the areas of southern Iraq, where there were major battles.The use of this weapon caused a large radiation contamination in the environment of the southern Iraqi regions, especially Basra, the Depleted Uranium led to radiation contamination of soil, water and air, that had led to huge injuries to cancer diseases in children and the destruction of the environment and civilian life [2], There have been many studies for conducting surveys to examine the soil and remnants of these weapons with several techniques as Nuclear radiation examination, in this work our team had develop a new technology for spectral analysis of plasma emission that induced from the soil after breakdown via high peak power laser pulse. The Laser-Induced Breakdown Spectroscopy (LIBS) technique is one of the potentially growing applied techniques used in the field of elemental analysis, because of its simplicity and non-contact nature [3], (LIBS) technology is an analytical promising detection technique for solid, liquid and gaseous samples [4], A low-energy pulsed laser (typically tens to hundreds of mJ per pulse) will be focus via lens in to sample surface to generate plasma that vaporizes a small amount of a sample, the plasma emissions will be collected and then directed to the spectrometer for analysis by optical fiber cable, a high resolution CCD spectrometer had operate to disperse the light that emitted by exciting atoms, ions, and molecules in the plasma [5], Figure (1) show the basic schematics of LIBS system.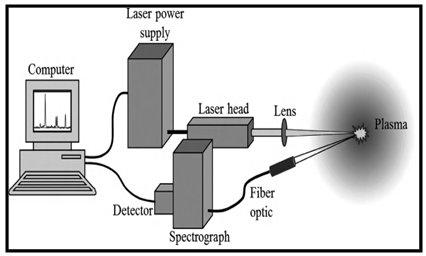 | Figure (1). A schematic of a general apparatus for LIBS illustrating the principal components [5] |
The LIBS is quantitative analysis methods that can be divided into two models the first one with calibration curves and the calibration-free LIBS (CF-LIBS) method [6], the fundamental theory of the classical CF-LIBS states that the quantitative accuracy is considerably related to the intensities of spectral lines and the plasma temperature [6,7].The classical CF-LIBS theory based on main condition that plasma is optically thin and in local thermodynamic equilibrium (LTE), the intensity of the measured emission line can be expressed as [6-9]: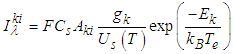 | (1) |
Where:k and i are the upper and lower level of the transition.λ is the emission wavelength of transition between the energy levels Ek and EiF is an experimental parameter that takes into account the optical efficiency of the collection system as well as the total plasma density and volumeCs is the concentration of the emitting species sAki is the transition probability for spontaneous emission from the state k to igk is the degeneracy of the k levelkB is the Boltzmann constant (1.38 × 10⁻²³ m2 kg s-2 K-1)Te is the plasma temperatureUs(T) is the partition function of the emitting species s at the plasma temperature T.The partition function can be calculated by: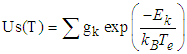 | (2) |
The spectral parameters of Aki, gk, and Ek can be obtained from the National Institute of Standards and Technology (NIST) and the values of F, Cs, and Te can be determined from the experimental data, by simplify Eq (1) we get: 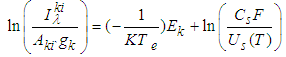 | (3) |
By compared the Eq (3) to simple liner equation: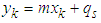 | (4) |
Then we can define: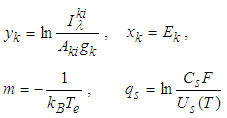 According to Eq (4) each spectral line can be draw the Boltzmann plot by xk and yk coordinates. The slope m is related to the plasma temperature and intercept qs is proportional to the logarithm of the species concentration.The electron density were calculated using Eq (5)
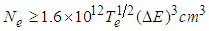 | (5) |
The F factor can be determined by Eq (6) | (6) |
Where L is the characteristic length of the plasma.Also the F factor can be determined by normalizing to unite the sum of the species concentration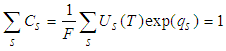 | (7) |
The concentration of the species s in the sample can be calculate by Eq (8) | (8) |
The concentration of element is given by the sum of the concentrations of neutral and ionized species, Saha equation relating in the two consecutive charge states I and II of a element, which can be written as [10,11]: | (9) |
Also we can be written Eq (9) as: | (10) |
The laser beam diameter was (5 mm) that focused using a (100 mm) focal length lens, the laser spot size at the target surface can be calculate used Eq (11) [12]. | (11) |
Where: f is the focal length of the focus lens. D is the diameter of the laser beam at the lens. M is the beam quality. A factor M2 is used to describe the deviation of a beam from a theoretical Gaussian.The laser power density can be described by Eq (12).  | (12) |
2. Equipment and Test Devices
The solid state laser passively Q-switched (Nd:YAG) operated at the fundamental wavelength of 1064 nm, 120mJ with a pulse duration of 10 ns was used for plasma excitation. The fundamental diameter of the laser beam was (5mm) that is focused onto the sample by a lens with a focal length of (100mm), the diameter of the focused on the sample was (0,3mm), the peak power of the laser pulse (12 MW) and power intensity (15.28*106W/mm2). The sample is placed in the sample holder in ambient atmosphere, the emission from plasma is then collected in front of the plasma with observance to the laser beam direction, plasma emission was collected by 15mm diameter imaging lens, and focused onto optical fiber type (SMA, 50um/0.22 NA), which deliver the plasma light to the entrance slit of spectrum analyzer model (CCS-100) with (1200 Line/mm) grating and 20-um slit dimension, Which serves to deflect light according to wavelength and then reversed by mirrors to detect and convert optical signals to digital, and then moves the digital signal to the application, which shows us the spectral lines for the sample and then analyzed. During LIBS analysis of lead samples, geometric position of the material surface with respect to laser beam incidence is one of the factors that affect the results. Two samples of Iraqi soil from Basra (Zubair and Faw) had been fetched for test, a pressed powder pellet is prepared from 3.0 gram of each soil. Hydraulic pressure machine model (Auto Series) is used to press powder without binder at (5.0 ton) to a disc of 1.0 cm diameter and 5.0 mm thickness.Also we had check the previous research to find a spectral analysis technique to detect the uranium residues in soil as X-Ray fluorescence (XRF) or Energy dispersive X-ray analysis (EDX), All references indicate that these techniques are unsuitable for screening the uranium element [13], Inspections of the radioactive uranium component should be careful to avoid exposure to radiation, so any close-up screening technique is dangerous.
3. Result and Discussion
Operate of the LIBS system with 400ms delay time for the first sample (Zubair soil) had shown the below result Figure (2). 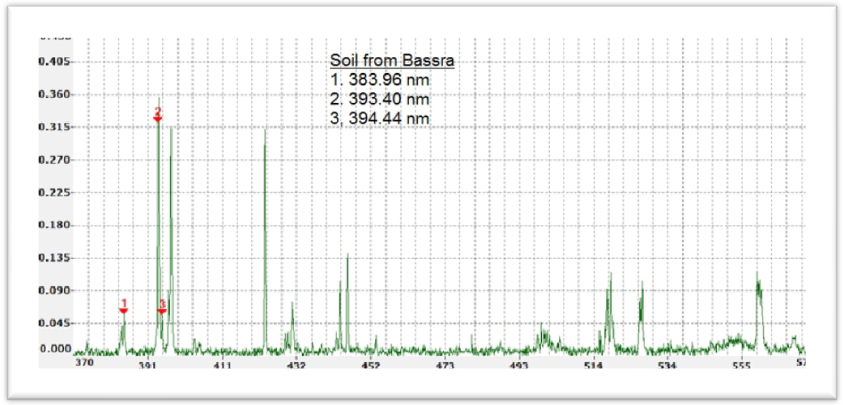 | Figure (2). Plasma emissions of Zubair soil |
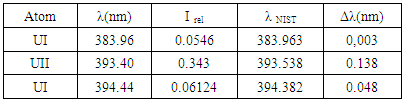
Table (1). The analytical lines of the (U) metal by LIBS technique of Zubair soil
 |
| |
|
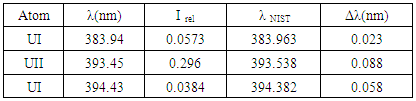
The database of NIST and ocean-optics Inc., had be used to analyze the two spectrums for detect the optical emissions spectrum lines of Uranium element.The second sample (Faw soil) also had been tested with the same condition and under atmospheric pressure that show below result Figure (3).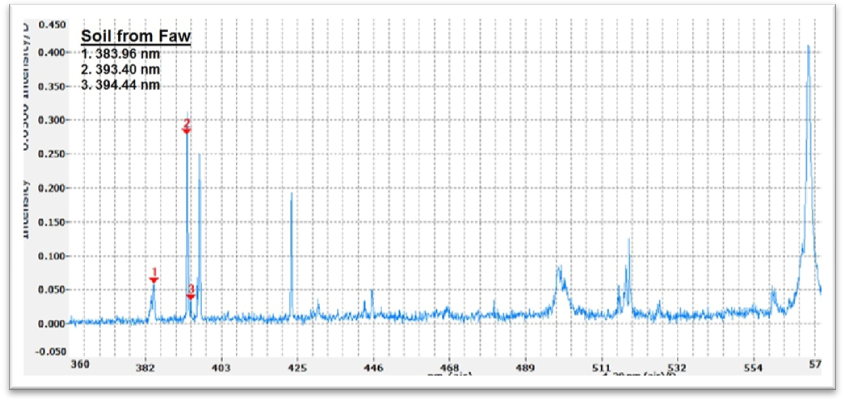 | Figure (3). Plasma emissions of Faw soil |
Table (2). The analytical lines of the (U) metal by LIBS technique of Faw soil
 |
| |
|
Three emission lines of Uranium had been detected at (383.96, 393.40 and 394.44 nm) in UV spectrum region of both samples.
4. Conclusions
In this work, we have constructed a LIBS system by using a portable commercial spectrometer from Thorlabs Inc. equipped with CCD detector to identify spectral lines emitted from the soil, the database from NIST and ocean-optics also used to select and detect the element according to emission lines, the sample Lab laser we also had use to completed the system that offer fast and low cost technology, for develop the system we will go to wide range and higher resolution spectrometer and faster CCD detector to get more spectrum and increase the limit of detection, for the developing of the system to calculate the concentration of uranium element in the soil we must get the emission parameters from references as (Aki, ∆E, gk and gi) that is main part to calculate the plasma parameters and concentration via (CF-LIBS) technology.
ACKNOWLEDGMENTS
During this research I would like to thank all the colleagues who helped the team in the collection and analysis of samples at the University of Baghdad / college of Science and the University of Nahrain / college of Science.
References
| [1] | Nadhir Al-Ansari, Sven Knutsson and Kadhim Almuqdadi, "Engineering solution for Radioactive Waste in IRAQ", Journal of Advanced Science and Engineering Research Vol 4, No 1 March (2014) 18-36. |
| [2] | Jawad Al-Ali, "EPIDEMIOLOGICAL STUDY AT THE SOUTH OF IRAQ (BASRAH CITY)", 12.9.2006, AUDITORIUM IN THE PARLIAMENT HOUSE. |
| [3] | Mohammed S. Mahde, Alaa H. Ali and Mohannad H. Hussein, "Diagnostic Study of Copper Plasma in Air by Laser Induced Breakdown Spectroscopy LIBS ", Eng. & Tech. Journal, Vol. 33, Part (A), No.5, 2015. |
| [4] | Nek M Shaikh, S Hafeez, B Rashid, S Mahmood and M A Baig, "Optical emission studies of the mercury plasma generated by the fundamental, second and third harmonics of a Nd : YAG laser", Journal of Physics D: Applied Physics, 39, 4377, 2006. |
| [5] | DAVID A. CREMERS and LEON J. RADZIEMSKI, "Handbook of Laser-Induced Breakdown Spectroscopy", 2ndedition, A John Wiley & Sons, Ltd, Publication, 2013. |
| [6] | V K UNNIKRISHNAN K MRIDUL, R NAYAK, K ALTI, V B KARTHA, C SANTHOSH, G P GUPTA and B M SURI, “Calibration-free laser-induced breakdown spectroscopy for quantitative elemental analysis of materials”, Vol. 79, No. 2 journal of physics pp. 299–310, 2012. |
| [7] | Jianhong Yang, Xiaomeng Li, Jinwu Xu, and Xianghong Ma, “A Calibration-Free Laser-Induced Breakdown Spectroscopy (CF-LIBS) Quantitative Analysis Method Based on the Auto-Selection of an Internal Reference Line and Optimized Estimation of Plasma Temperature”, Applied Spectroscopy, Vol. 72, P 129–140, 2018. |
| [8] | Rosalba Gaudiuso, Marcella Dell Aglio, Olga De Pascale, Giorgio S. Senesi and Alessandro De Giacomo, “Laser Induced Breakdown Spectroscopy for Elemental Analysis in Environmental, Cultural Heritage and Space Applications: A Review of Methods and Results”, 10, 7434-7468; doi:10.3390/s100807434 Sensors 2010. |
| [9] | Ashraf Mohmoud El Sherbini, Abdel Aziz Saad Al Aamer, “Measurement of Plasma Parameters in Laser-Induced Breakdown Spectroscopy Using Si-Lines” World Journal of Nano Science and Engineering, 2, 206-212, 2012. |
| [10] | Lanxiang Sun, Haibin Yu, “Correction of self-absorption effect in calibration-free laser-induced breakdown spectroscopy” by an internal reference method”, Talanta, Vol 79. P 388-395, 2009. |
| [11] | Tagreed K. Hamad, Alaa H. Ali, Hussein T. Salloom and Alaa J. Ghazai “Calibration Free Laser Induced Breakdown Spectroscopy (CF-LIBS) as a tool for Quantitative Elemental Analysis of Iraqi Cement”, 1st Scientific International Conference, College of Science, Al-Nahrain University, Part I, pp.60-68, 21-22/11/2017. |
| [12] | Bushra R. Mahdi, Ahmed Kh. Abbas, Alaa H. Ali and Ismael H. Jasim, “Laser-induced breakdown spectroscopy (LIBS) Technique in Bone Calcium determination” the third scientific conference of institute of laser for postgrads studies, 2015. |
| [13] | S. (Porikli) Durdagi et al., “Medical and Biological Applications of X-Ray Fluorescence Method for Elemental Analysis”, Journal of Physical Chemistry and Functional Materials, 1(2), 2018. |

 Abstract
 Reference
 Full-Text PDF
 Full-text HTML