Franklin Ajibodu , Zacchaeus Adetona , Babajide Ojo
Department Electrical Engineering, The Federal Polytechnic, Ilaro, Nigeria
Correspondence to: Zacchaeus Adetona , Department Electrical Engineering, The Federal Polytechnic, Ilaro, Nigeria.
| Email: |  |
Copyright © 2016 Scientific & Academic Publishing. All Rights Reserved.
This work is licensed under the Creative Commons Attribution International License (CC BY).
http://creativecommons.org/licenses/by/4.0/

Abstract
As optical network system become more complex and hence expensive, hands-on experiments based on optical network simulation have become very important for teaching in technical and technological institutes. This study investigates the performance of the optical network under different scenario with a minimum cost. An experimental study using OptiWave OptiSystem simulator to observe the performance of Erbium Doped Fiber Amplifier (EDFA) and determine its characteristic under varying input power at 1550nm range was carried out. It further demonstrated the performance of EDFA under dense wave division multiplexing (DWDM) by observing its characteristics when using four transmitter with wavelengths 1560nm, 1550nm, 1541nm, 1532nm multiplexed over a fiber link and amplified by an EDFA. In a further experiment in this study, the effect of Four Wave Mixing (FWM) amplified over a DWDM network was observed, and by extension the effect of reducing the Chromatic dispersion coefficient from 16.75ps/nm/km to 11.75ps/nm/km on the FWM formed was shown. The result obtained showed that for an EDFA to be used as an amplifier the amplified spontaneous emission (ASE) characteristic of the EDFA must be low in order to obtain a high Optical signal to noise ratio (OSNR). It was also observed from the eye diagram obtained that the inter symbol interference (ISI) was reduced at wavelength of 1541nm and 1532nm due to lower attenuation at this range. The result also showed that the effect of FWM increased with increase in input power at the transmitter and by increasing the chromatic dispersion coefficient, the effect of FWM on the output wave transmitted was reduced.
Keywords:
EDFA, DWDM, FWM, Optical network simulation, PMD, PON
Cite this paper: Franklin Ajibodu , Zacchaeus Adetona , Babajide Ojo , Performance Analysis of Erbium Doped Fiber Amplifier’s and FWM Characteristics in a Passive Optical Network, International Journal of Optoelectronic Engineering, Vol. 6 No. 1, 2016, pp. 1-7. doi: 10.5923/j.ijoe.20160601.01.
1. Introduction
The propagation of optical pulses over an optical network experiences losses due to dispersion and non-linearity effects and this leads to the need for amplification. The commonly used amplifier is the Erbium doped feedback amplifier (EDFA) [1]. EDFA is commonly used due to the fact that in the long-range optical communication, it efficiently amplifies light in the 1.5µm wavelength region (C-band) where telecommunication fibers have minimum loss [2]. It is a power booster that raises the input signal to a desired level in the fiber network. Ab-Rahman (2014) [3] maintains that EDFA has much improved noise characteristics and polarization insensitivity. The amplifier operates as a power amplifier that amplifies the optical signal to be transmitted to another segment of the network [3]. A major challenge after amplification is the presence of amplified spontaneous emission (ASE) which occurs concurrently with signal amplification and degrades the optical signal-to-noise ratio (OSNR). The optical network also experience degrading effect from various forms of dispersion such as Four Wave Mixing (FWM) which interferes and degrades the signal output of the transmitted signal [4] [5]. In this experimental study, the performance of the EDFA characteristics was investigated by observing the ASE under varying input power of -30dB to -20dB using the OptiSystem simulator [6]and consequently the Optical Signal to Noise Ratio (OSNR) was obtained. In the second experiment a DWDM optical network is setup to observe the characteristic of EDFA using four different wavelengths in the C-band [2]. The effect of each wavelength was observed by considering the changes in the equivalent eye diagram as was shown in section 3.0. An optical network was also setup consisting of four optical transmitters to be multiplexed and transmitted over a fiber link, then amplified by an EDFA to observe the effect of FWM on the transmitted signal when input power is increased.
1.1. Overview of DWDM Optical Network
A dense wave division multiplexing (DWDM) operates by assigning incoming signal to a particular wavelength and then multiplexing each wavelength over a single fiber link, this increases the carrying capacity of an optical network. That is, more than one wave is transmitted over a single channel [7]. A DWDM optical network commonly consist of transmitters, fiber link, Erbium doped fiber amplifier (EDFA), receivers, AWG multiplexer, and demultiplexer [8] [9]. The need “to mitigate complex and costly time-sharing of available bandwidth in TDM based passive optical networks (PONs) has led to the development of new type of access network that both simplify the network operation” and also cope with the required bandwidth [10] [11]. A PON is a system that brings fiber optic cabling and signals to all or most of the way to the end user [12]. Raj & Mascreen, (2015) revealed that PON technologies are available since the mid-90s, but in the last few years standards have matured and commercial standards are being implemented [13].
1.1.1. EDFA
The Erbium doped fiber amplifier provides a way of amplifying all wavelength simultaneously. It operates at the 1.5µm or 1550nm range (C-band) [2] and is designed to amplify light in this region. One demerit of EDFA is that it adds noise and some non-linearity to the amplified signal [14]. This amplified noise is referred to as ASE. In turn, ASE degrades the output signal [6] [7] by adding noise to it as described in Figure 1.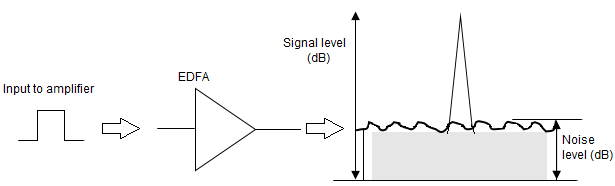 | Figure 1. Single stage amplifier and noise associated with the signal [7] |
1.1.2. FWM
Four wave mixing is a nonlinear effect that occurs when signals co-propagate together in a fiber and they mix together to form extra channels that can interfere and reduce the transmitted signal output power and increase noise in the system. The total number of additional wavelength that can be created is given by [6]: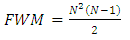 | (1) |
where N is the number of original wavelength
2. Materials and Methods
The two experiments were set up using OptiSystem software version 13 obtained from OptiWave Inc. Standard tools on the software package were employed and the simulations are described in the sections that follow. The OptiSystem package has been shown to be a very good alternative in optoelectronics and fiber optics teaching e-laboratory [15]. The experiments were set up using a PON known to be characterized power consumption, and it does not have any problem with heat and temperature, except lasers, amplifiers and photoreceivers [16].
2.1. Simulation of EDFA Characteristics
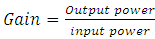
The simulation setup was connected as shown in Figure 2. The setup consisted of a continuous wave laser module, an EDFA module, and an Optical Spectrum analyzer. The transmitter was operated at 1550 nm and the power of the laser was set between -30dB and -20dB and the output was measured at the optical spectrum analyzer. The ASE, output power, and optical signal to noise ratio (OSNR) were measured from the output.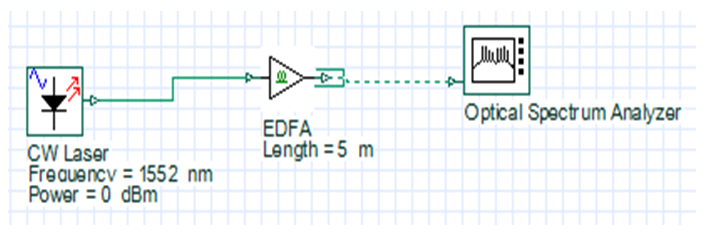 | Figure 2. EDFA simulation setup |
 | (2) |
 | (3) |
2.2. Setup and Simulation of WDM Network Characteristics
The simulation was carried out as a substitute for real experimental set-up. Given the high cost of optic fiber cables, it is not quite easy to carry out a real experimental set-up. Also, given the complexity of the structure and high cost of the system, it is unpractical to optimize the performance for these two amplifiers by experiment [17]. However, the results obtained in the research were consistent with results from other research works.The simulator was configured to carry out test on the FWM based on familiar theoretical background in optic fiber systems. The simulator uses the effects of link attenuator, represented as a variable (VOA) inserted before the amplifier. For this purpose, optical signal attenuation can be obtained as [18]: | (4) |
where  is the electric field vector (polarization in x and y) and
  is the attenuation (dB). The optic fiber model used simulates the propagation of the electric field in single-mode fiber with dispersion and nonlinear effects considered from the numerical integration of the nonlinear Schrӧdinger equation (NLS) [19].The WDM network was setup as shown in Figure 3. The four transmitters represent four wavelengths λ =1560 nm, λ1 = 1550 nm, λ2 = 1541 nm, λ3 = 1532 nm across the C-band. The setup consisted of a multiplexer, an EDFA, two fiber links of length 50 km each, a demultiplexer, four optical receivers each for each wavelength, BER analyzers to view the corresponding eye diagram, two optical spectrum analyzer (OSA) to observe the OSNR. The results are as presented in Section 3.0.
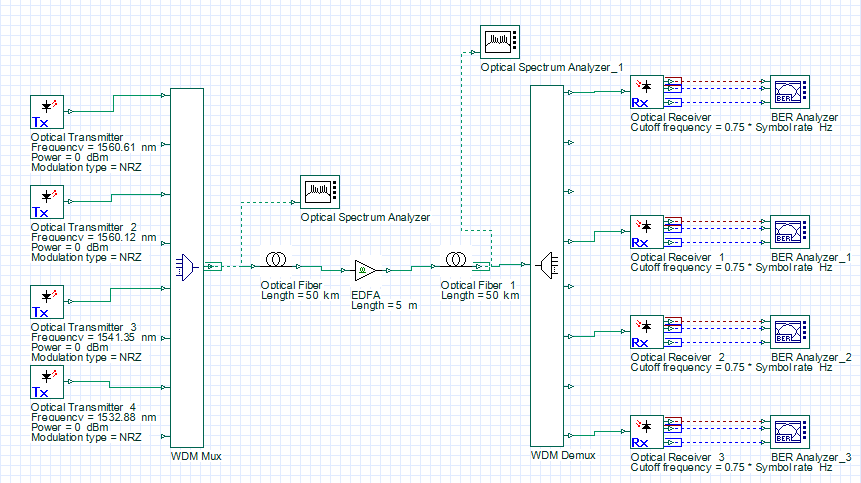 | Figure 3. Amplified WDM simulation setup |
2.3. Setup and Simulation of FWM Characteristics
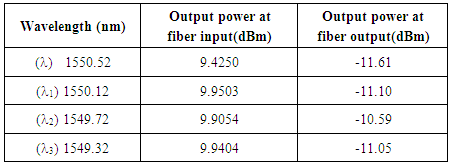
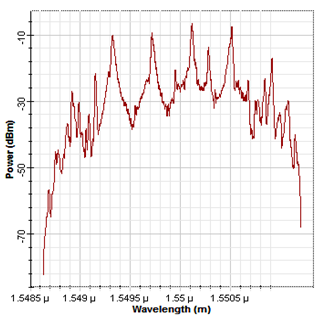
The experiment was setup as shown in Figure 4 where the optical network consisted of four optical transmitter with wavelength situated in the C-band with an interspace of 50GHz, a multiplexer, a 100km fiber length cable link and an EDFA amplifier. The transmitter wavelength were λ=1550.52nm, λ1=1550.12nm, λ2=1549.72nm and λ3=1549.42nm respectively. The power measured at the fiber input and output are presented in Table 3.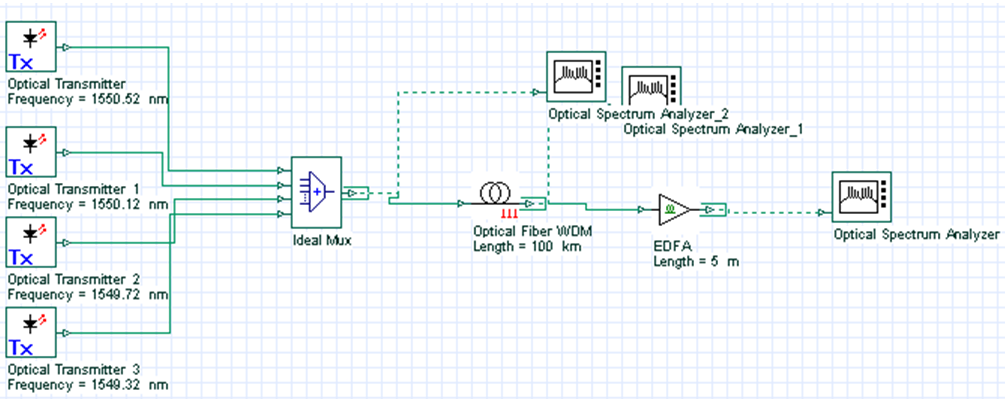 | Figure 4. FWM simulation Setup |
3. Results and Discussion
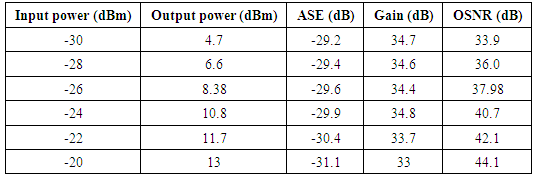
The EDFA characteristics are presented in Table 1. From the table it can be deduced that as the ASE increased relative to the output power, the OSNR reduced accordingly. That is, the higher the ASE, the lower the OSNR. This in turn will limit by extension the number of amplifiers that can be used in practical application. Figure 3 shows the plot of the OSNR against the output power at the EDFA It can be observed from the graph that the EDFA has a better performance at higher output power than at the lower region, that is, at lower output power the ASE is higher and this affects the resulting OSNR.Table 1. EDFA characteristics
 |
| |
|
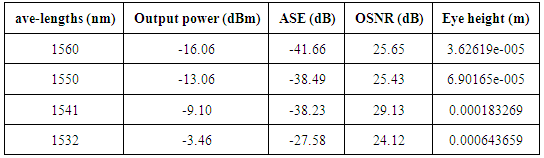
From Table 2 it can be deduced that at wavelength λ=1541 and λ=1532, the height of the eye is having the highest range of value due to low inter symbol interference (ISI) at those regions, and hence those regions can be considered when choosing a bandwidth for amplification. Figure 5 shows the plot of the height of the eye against the wavelength. It can be observed that the height of the eye is having a higher value at the range of λ=1541nm and λ =1532nm.Table 2. Amplified WDM network output
 |
| |
|
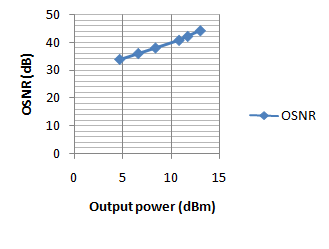 | Figure 5. Plot of OSNR against Output Power |
From Figure 6 it can be observed that at the 1541nm range the height of the eye increases up to 1532 nm. That is, the level of inter symbol interference (ISI) was lower at this range of wavelength as shown in the equivalent eye diagram for each wavelength in Figure 7.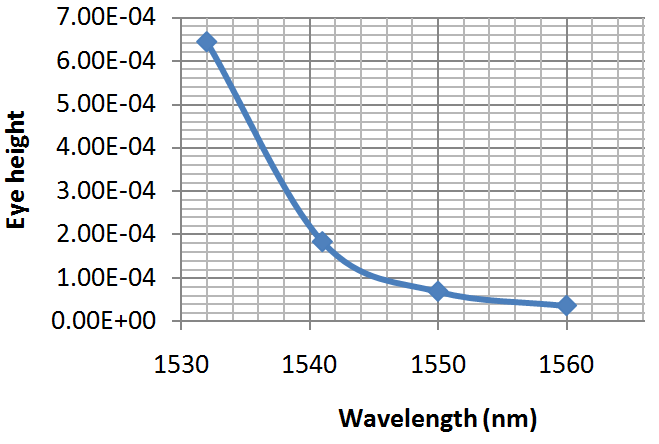 | Figure 6. Eye Height against Wavelength |
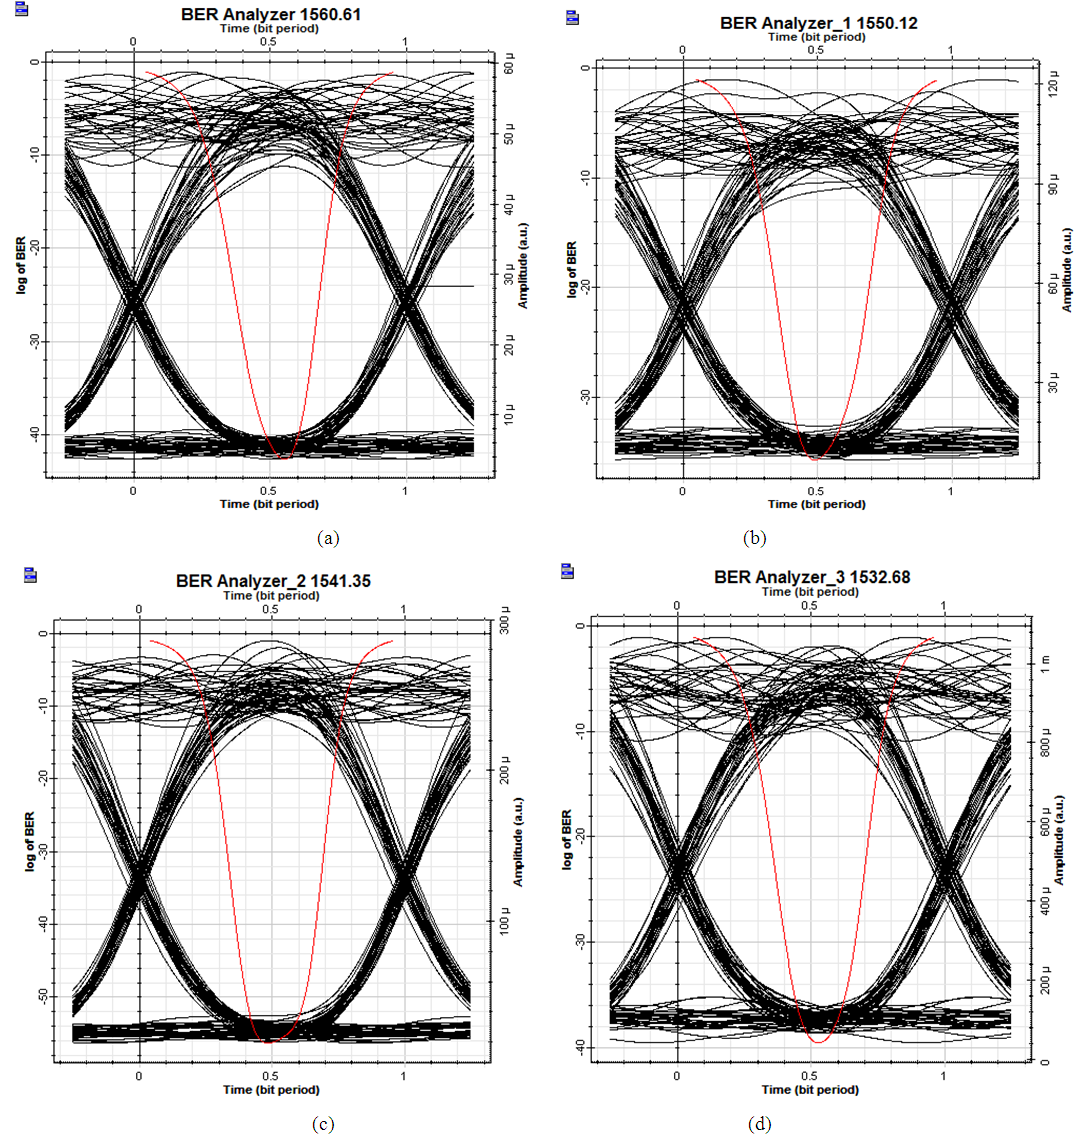 | Figure 7. Eye diagrams of the WDM network |
Table 3 shows the input power at the fiber link and power at the output of the fiber. It can be deduced that the input power experienced losses after being transmitted over the fiber.Table 3. Power at the input and output of the fiber
 |
| |
|
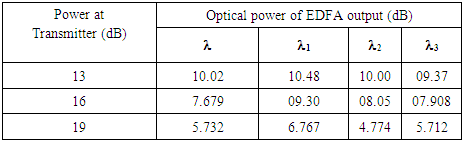
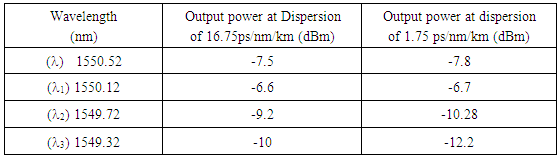
As depicted in Table 4, as the power at the transmitter increased, the output at the EDFA for λ to λ3, reduced due to the effect of four wave mixing. That is, the newly formed wave degraded the output of the transmitted signal as the transmitter power increased form (13dB - 19dB). When the Chromatic dispersion parameter was changed from 16.75ps/nm/km to 11.75ps/nm/km the value of the output decreased showing that dispersion can be used to reduces the effect of FWM, as shown in Figure 8 and 9.Table 4. Optical power at EDFA output
 |
| |
|
 | Figure 8. Output after fiber link at dispersion=16.75ps/nm/km |
 | Figure 9. Output of fiber at dispersion=11.75ps/nm/km |
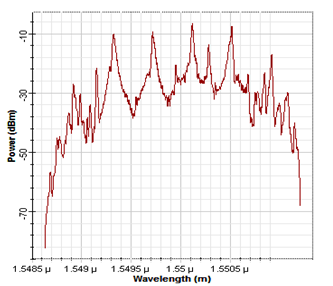
Figure 8 shows the output at the fiber at a chromatic dispersion of 16.75ps/nm/km and Figure 8 shows the output at 11.75ps/nm/km. The chromatic dispersion was reduced from 16.75 to 11.75 ps/nm/km indicating that the signal was degraded as shown. Due to interference from the FWM, more side wavelength were formed at 11.75ps/nm/km which degraded the transmitted signal, as observed in Figure 9. Table 5 gives the measured power output for chromatic dispersion of 16.75ps/nm/km and 11.75ps/nm/km respectively.Table 5. Fiber optical output power with the rate of chromatic dispersion decreased
 |
| |
|
Considering the data in Table 5, it is seen that due to the chromatic coefficient being higher than 16.75ps/nm/km, the effect of FWM on the output at the EDFA was reduced while in 11.75ps/nm/km the effect of FWM was more pronounced. That is, the number of sideband was reduced.
4. Discussion
In this study, three characteristics have been discussed with respect to optical network, as seen from the above analysis. There are three conclusions that can be made based on the analysis and statistic mentioned above. First, result obtained from the EDFA experiment showed that for an EDFA to be used as an amplifier the amplified spontaneous emission (ASE) characteristic of the EDFA must be considered, for it was observed that as the ASE increased, the gain of the amplifier reduced and hence by extension the signal to noise ratio (OSNR) reduced. Secondly, it was also observed that from the eye diagram obtained that the inter symbol interference (ISI) was reduced at wavelength of 1541nm and 1532nm and this range will be suitable for amplification for practical application because of its low level of interference as indicated by the result obtained in the experiment. The result obtained also showed that the effect of FWM increased with an increase in input power. That is, more side band were formed and the new sideband degraded the signal by interfering in such a manner that caused an overlap on the transmitted signal and hence degraded it. When the transmitter input power was at 19dB the effect of the FWM was more pronounced. When the chromatic dispersion coefficient was reduced the effect and number of sideband formed also increased, showing that the effect of FWM on the output wave transmitted can be reduced by increasing the chromatic dispersion of the fiber link.
5. Conclusions
The OptiSystem simulator is a versatile tool in designing fiber network as it can stand in place of very expensive equipment for training. Thus we recommend that all department of electrical engineering in Nigerian higher institutions adopt the use of the software for training of students on fibre network. Before this can be achieved though, member of staff have to undergo necessary hands-on training on the use of the software.
ACKNOWLEDGMENTS
We will like to acknowledge OptiWave Inc. developer of OptiSystem 13 simulator used in this simulation.
References
| [1] | M. Cvjetic, Optical amplifiers, optical transmission systems engineering, Artech house, Norwood 2004. |
| [2] | M.N.O. Sadiku, Optical multiplexer and amplifier, optical and wireless communications: next generation networks, CRC Press, Florida, 2002. |
| [3] | M. S. Ab-Rahman, A review of the configuration and performance limitation parameters in optical amplifiers. Opt. Appl. 44(1), (2014) 251-266. DOI: 10.5277/oa140207. |
| [4] | L. Chen, P. Meyrueix, W. Huang, Four wave mixing suppression, (2009). US Pat. 20090208223 A1. |
| [5] | M. A. A. Elmaleeh, F. G. S. Gamar, A. B. A., Mustafa, Minimization of signal degradation in single mode fibre optic link. Int. J. Latest Res. Sci. Technol. 3(5), (2014) 95-102. |
| [6] | W. Xiang, S. Wang, Reinforce Networking, Theory with Opnet simulation, J. Inf. Technol. Edu. Res., 6(1), (2007) 215-226. |
| [7] | D. Goff, Fiber limit, Fiber optic video transmission: The complete guide, CRC Press, Burlington, 2013. |
| [8] | A. Gumaste, T. Anthony, DWDM network design-1, DWDM network designs and engineering solutions. Cisco press, Indianpolis, 2003. |
| [9] | OptiWave Inc., Opti System Software, 2015. http://OptiWave.com/members/pragmatist/evaluation-license-downloads/#user-evaluation-tab/ Retrieved April 25, 2015. |
| [10] | U. Ibrahim, H. Abbas, R. Faizan, & S. F. Shaukat, Performance evaluation of photoreceivers in WDM passive optical networks, 6th International conference on emerging technologies (ICET), 2010, pp. 65 - 69. |
| [11] | J. Zhang, N. Ansari, On analyzing the capacity of WDM PONs. Proc IEEE GLOBECOM, 2009. |
| [12] | N. Nowshin, A K M, Arifuzzman, M. Tarique, Demonstration and performance analysis of ROF based OFDM-PON system for next generation fiber optic communication, Int. J. Comput. Net. Commun. 4(1), (2012) 193-209. DOI: 10.5121/ijcnc.2012.4114. |
| [13] | A. Raj, H. Mascreen, Analysis of OFDM Scheme for RoF System and Characterization with GPON Architecture. Int. J. Eng. Res. Technol. 4(01), (2015) 441-444. |
| [14] | P. Sharma, R. K. Arora, S. Pardeshi, M. Singh, Fibreoptic communications: an overview, Int. J. Emerg. Technol. Adv. Eng., 3(5) (2013) 474-479. |
| [15] | N. Z. M. Rawi, M. Z. Jamaludin, F. Abdullah, OptiSystem: an alternative to optoelectronics and fiber optics teaching e-laboratory. Int. J. Asian Soc. Sci. 4(2) (2014) 307-313. |
| [16] | S. Rajalakshmi, A. Srivastava, A. Pandey, Performance analysis of receivers in WDM for extended reach passive optical networks, Int. J. Comput. Sci. Iss. 9(2), (2012) 217-222. |
| [17] | L. Liu, Y. Ma & J. Yang, Performance simulation and optimization of Er3+/Pr3+ doped fiber amplifier by Optisystem, Inform. Technol. J. 12 (13), (2013) 2561-2567. |
| [18] | G. P. Agrawal, Fiber-Optic Communication Systems, 4th Ed. John Wiley, 2010. DOI: 10.1002/9780470918524.ch1. |
| [19] | Opti System, Optical system overview, Optical Communication System Design [Online] Retrieved 15 December 2015, available:http://optiwave.com/products/system_overview.html. |

 Abstract
 Reference
 Full-Text PDF
 Full-text HTML