Ogaro Elijah Nyakang’o1, Geoffrey Kihara Rurimo2, Patrick M. Karimi1
1Department of Physics Kenyatta University, Nairobi, Kenya
2Department of Physics Jomo Kenyatta University of Agriculture and Technology, Nairobi, Kenya
Correspondence to: Geoffrey Kihara Rurimo, Department of Physics Jomo Kenyatta University of Agriculture and Technology, Nairobi, Kenya.
| Email: |  |
Copyright © 2012 Scientific & Academic Publishing. All Rights Reserved.
Abstract
The precision and accuracy of optical phase-shifting technique is critical and affects the accuracy of optical measurements undertaken using phase-shifting interferometers. The accuracy of optical phase shifters is limited by the inherent characteristics of the piezo-actuators (or PZT) such as nonlinearities, hysteresis, creep and thermal drift. This paper explores a new phase-shifting technique based on two acousto-optic modulators (AOMs) where the inherent characteristics of the PZT do not affect the required phase-shifts. The acousto-optic phase-shifting technique was successfully applied to control and measure the required optical phase shifts directly in the Mach-Zehnder interferometer. This was accomplished by varying the phase delays between the two AOMs driving signals. In the experiment both Dual Trace and Lissajous Figures techniques were used to determine the behavior of the optical phase shifting system in terms of accuracy and repeatability.
Keywords:
Optical Phase-Shift Measurements, Phase Delay, Interferometers
Cite this paper: Ogaro Elijah Nyakang’o, Geoffrey Kihara Rurimo, Patrick M. Karimi, Optical Phase Shift Measurements in Interferometry, International Journal of Optoelectronic Engineering, Vol. 3 No. 2, 2013, pp. 13-18. doi: 10.5923/j.ijoe.20130302.01.
1. Intoduction
Phase-shifting interferometry (PSI) method has drawn much attention in many areas of applications because of its high precision in optical measurements[1, 2]. This method utilizes the temporal domain to collect a series of interferograms by adjusting the phase of the reference beam. For a finite number of recorded interferograms, the individual interferograms can be expressed as: | (1) |
where, the subscript n is the number of interferograms,  is the phase at each pixel in the image and
  is the phase-shift between images. The analytical solution to Eq. (1) with its three unknowns {
 and
and  }, requires that three or more interferograms be included in the analysis to determine the wavefront phase at each pixel independently. To create multiple interferograms in Eq. (1), a method is needed to introduce the required phase shift in the reference beam. The most commonly used method is a movable mirror driven by a piezoelectric transducer (or PZT) to induce a path-length change in the reference beam[3, 4]. A similar effect is achieved by translating a prism orthogonal to the beam[5, 6]. Other methods which have also been used to introducea phase shift include translating diffraction grating perpendicularly to the light beam[7] and rotating polarization phase retarders[8]. In all these phase-shifting methods, the accuracy and stability of the motion of the phase-shifter (i.e., PZT) is critical to the accuracy of optical measurements which is achievable byPSI systems.However, the motion of a PZT has some nonlinearity which may lead the mirror or the prism in the reference beam not to move to the right position to introduce the expected amount of phase-shift[9]. This means if the phase shift is not exactly 900 between the interferograms, errors show up in the phase
  extracted froma set of recorded interferograms represented in Eq. 1[10]. The phase-step errors between data interferograms induced by the non-linearity of the PZT can be calibrated if good phase measurement results are to be obtained using PSI. However, these PZTs have some inherent hysteresis, creep and thermal drift that make the small amount of nonlinearity to become non-repeatable and therefore difficult to calibrate before use[11]. Thus the accuracy and stability of the reference phase-shifter poses one of the most serious limitations for precision phase measurement in PSI systems.In view of the problems facing the PSI optical phase-shifters, there is need to explore new phase-shifting methods where the inherent characteristics of the PZT do not affect the required phase-shifts. More importantly the phase-shifts should be directly measured as it is varied rather than tightly controlled. In this paper we demonstrate an optical phase-shifting schemebased on two acousto-optic modulators. This technique is suitable in amplitude division interferometers such as the Mach-Zehnder interferometer which use two beam splitters.
2. The Optical Phase Shifter System
The optical phase-shift in the reference beam is determined by the phase delay between the two Radio Frequency (RF) driving signals applied to the acousto-optic modulators once properly aligned. To precisely measure the phase delay between the two RF driving signals, an electronic phase delay system that can precisely vary and measure the phase-shifts is necessary.
2.1. Electronic Phase Delay System
The electronic phase delay system shown figure 1 is based on digitally programmable delay elements which provide better noise immunity and are not susceptible to offsets and drift phenomena[12]. The phase delay system is composed of two 8-bit programmable delay lines (PDLs), an analog to digital converter(ADC), two RF power amplifiers and a potentiometer. In the design of the phase delay system, the two PDLs are cascaded in order to obtain the inherent (step zero) phase shift of zero degrees. The frequency of the RF driving signals used in these experiments was 57.256 MHz, giving a period of 17.465 ns; and the increment of the programmable digital delay line was 0.25 ns. This means that a phase resolution of approximately 5 degrees could be achieved.After a complete design of the phase delay system as shown in figure 1, RF signals of 57.256 MHz are then fed simultaneously to a power amplifier for driving AOM1 and the PDLs. The phase-shifted RF signal is also amplified before being fed to AOM2. The phase delays between the two AOMs driving signals are then monitored and measured with a digital oscilloscope as the delay values changed.
2.2. Acousto-Optic Phase-Shifting System
The interaction of light and sound in an optical isotropic medium can be described in terms of wave interactions or particle collisions[13]. In the particle model, a light wave consists of photons of energy  where,
  is the angular frequency and
  is Planck’s constant. Similarly, the sound wave consists of phonons of energy
  where,
  is the angular frequency. In the particle collisions model, a photon is annihilated and a new photon is created while a phonon is either annihilated or created[14, 15]. If the conservation of energy is valid for a photon-phonon collision, then the frequency,
  , of a Bragg-reflected photonis:
 | (2) |
where the + or – sign applies for phonon annihilation and phonon creation respectively. From Eq. (2) once Bragg condition is satisfied, the frequency of the diffracted optical beam will be Doppler-shifted up or down, depending on the relative direction of the optical and acoustic beam.Besides the frequency shift in Eq. (2), the phase of the diffracted beam is also shifted by the phase of the sound wave. In order to measure and vary the optical phase-shift, let us consider the electric field,  , of the incident light beam on AOM1 to be:
 | (3) |
where,  is the amplitude of the wave,
  is the wave number, defined by
 , and
, and  is the angular frequency of light. At the exit of AOM1 in figure 2, the first-order diffracted beam gains a positive frequency (Eq. 2), a phase shift due to the optical-path of the Bragg cell material (AOM1) and the phase of the sound wave. Thus the electricfield,
  , of the first-order diffracted beam exiting AOM1 can be expressed as,
 | (4) |
 | Figure 1. Schematic diagram of the digitally programmable phase shift and measuring system |
where,  is the phase delay due to the optical-path of the Bragg cell material (AOM1),
  is the phase delay of the sound wave in AOM1.The first-order diffracted beam from AOM1 is now incident on AOM2 (figure 2) satisfying Bragg condition. The first-order diffracted beam exiting AOM2 as shown in figure 2, gains a negative frequency (Eq. 2), a phase shift due to the optical-path of the Bragg cell material (AOM2) and the phase of the sound wave. Since the two AOMsare driven by the signals with the same frequency, a positive frequency shift generated to the first-order diffracted beam by AOM1 is removed by a negative frequency shift added to the first-order diffracted beam by AOM2. Thus the electric field,
  , of the first-order diffracted beam exiting AOM2 can be expressed as,
 | (5) |
where,  is the frequency of the beam,
  is a phase delay due to optical-path of AOM1,
  is a phase delay due to optical-path of AOM2,
  is the phase delay of the sound wave in AOM1 and
  is the phase delay of the sound wave in AOM2.The laser beam after passing through the two AOMs only picks up an extra phase delay due to the optical-path of the two Bragg cells materials (AOM1 and AOM2) and the phase delay between the two RF driving signals applied to the AOMs. Since the phase delay
  is constant once the AOMs are aligned, the phase of the output beam is completely determined by the phase delay between the two RF driving signals applied to the AOMs, that is
 | (6) |
Thus the optical phase-shift of a reference beam in an interferometer, can be directly measured on a digital oscilloscope by controlling the phase delays between the two RF driving signals applied to the AOMs. 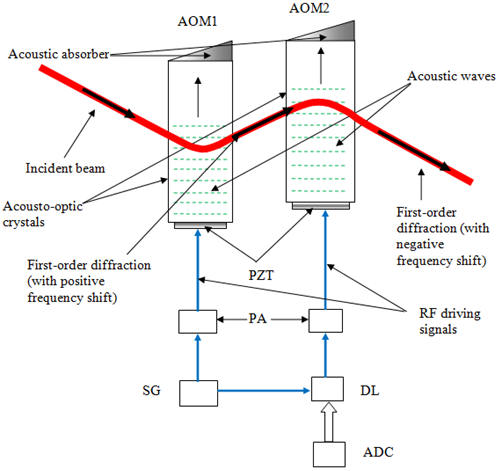 | Figure 2. Optical Phase-shifter based on two acousto-optic modulators combined in series: PA –power amplifier; SG –signal generator; DL –delay line; ADC - analog to digital converter |
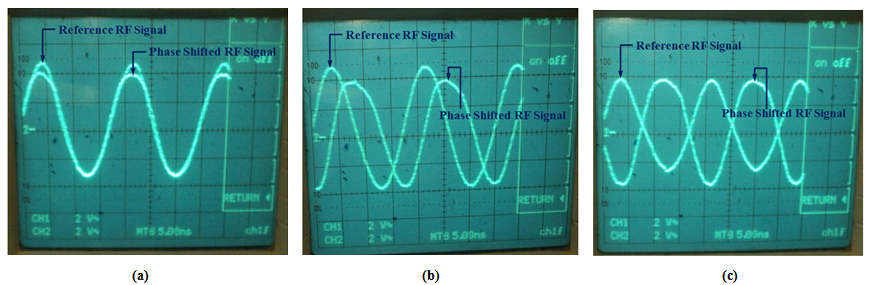 | Figure 3. Dual Trace of two sine waves of equal frequency:- (a) phase shift of zero degrees, (b) phase shift of 90 degrees, and (c) phase shift of 180 degrees |
3. Experimental Results
The accuracy and resolution of the phase delay system has been measured using 100 MHzdigital oscilloscope. This high speed scope allowed measurements on the sub-nanosecond range such as the increment of the programmable digital delay line of 0.25 ns. The results for both Dual Trace and Lissajous figures techniques have shown a perfect behavior of the phase delay system in terms of accuracy and repeatability.
3.1. Dual Trace Method
The Dual Trace method was used to determine the phase shift between the reference and delayed RF signals by displaying both traces on the oscilloscope screen simultaneously and measuring the distance (in scale divisions) between two identical points on the two traces. The images in figure 3 shows the results of the Dual Trace method, in which case both signals (reference and delayed) are displayed on the oscilloscope and their phase difference determined.
3.2. Lissajous Figure Method
The Lissajous figures method was alsoused to determine the phase shiftand the results of this measurement showed a strong agreement with that of the Dual Trace method. In this method, the reference and the delayed RF signals are applied simultaneously to the horizontal and vertical deflection plates of the oscilloscope. The resulting waveform called a Lissajous figure is represented by, | (7) |
where,  are the values of the deflection voltages, A is the amplitude and
  is the phase angle by which
  leads
leads . The phase-shift,
  , between two sinusoidal signals of the same frequency is determined from the various shapes of the Lissajous figures.Case 1: When
  then Eq. 7 reduces to:
 | (8) |
Equation 8 represents a straight line with slope,  as shown in figure 4(i).Case II: When
  then Eq. 7 reduces to:
 | (9) |
Equation 9 represents a circle as shown in figure 4 (ii).Case III: When  then Eq. 7 reduces to:
 | (10) |
Equation 10 thus represents a straight line with slope,  as shown in figure 4(iii).
3.3. Phase-Shifting in Mach-Zehnder Interferometer
The optical phase-shifter based on two acousto-optic modulators crystals combined in series, was applied in Mach-Zehnder interferometer to demonstrate the phase-shifting technique as shown in figure 5. Once the pair of AOMs are properly aligned as shown in figure 2, the phase shifts between the driving RF signals are varied and measured with adigital oscilloscope and the corresponding fringe patterns recorded by the CCD camera. In this research, a number of fringe patterns were recorded in both the forward and reverse phase shifts (i.e., 00,900, 1800 and 1800, 900, 00 respectively) to test for stability, repeatability and accuracy of the phase shifter. Figure 6 depicts three typical fringe images that correspond to a phase shift of 00, 900 and 1800 respectively. (Note that the quality of the fringes in figure 6 can be enhanced if spatial filters are used in the experiment). As depicted in Eq. 5, the total phase shift of the beam exiting the AOMs is also related to the optical-path length of the two AOMs. This means that variations in optical-path length caused by the environmental perturbations in the research room, will introduce errors and instability in phase shift measurement.Since the AOMs are made of transparent crystals material(PbMoO4), a change in temperature will definitely affect the refractive indices of AOMs materials. Similarly the refractive index of the free space (air) in both arms of the interferometer is easily affected by air currents, changes in humidity and variations in temperatures. This means a change in refractive indices naturally introduce variations in optical-path length of the beams in the interferometer. In order to maintain fringe stability, it is therefore absolutely necessary to maintain a relatively constant temperature inside the research roomwith no air turbulence. In other words the use of a properly designed environmental isolation enclosure is extremely important in the experiment.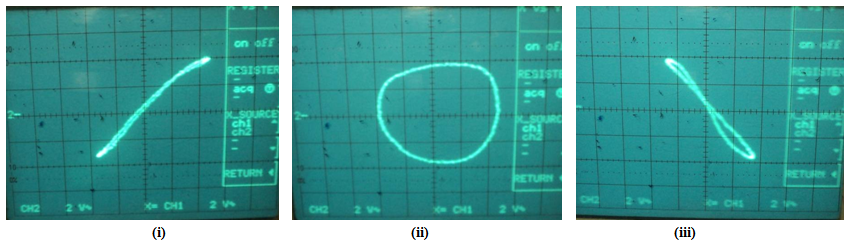 | Figure 4. Lissajous figure of two sine waves of equal frequency: - (i)phase shift of zero degrees,(ii) phase shift of 90 degrees, and(iii) phase shift of 180 degrees |
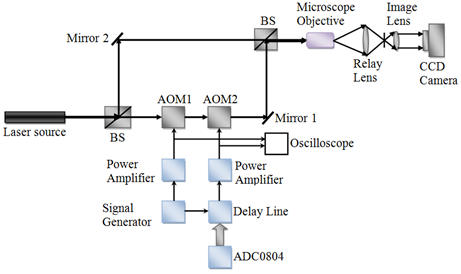 | Figure 5. Experimental setup to demonstrate the phase-shifting method with acousto-optic devices |
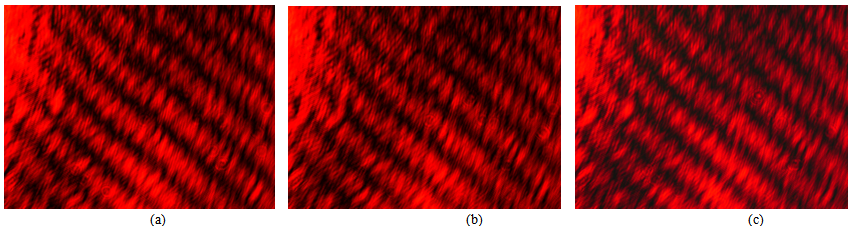 | Figure 6. Typical phase shifted fringe patterns recorded with a CCD camera:- (a) phase shift of zero degrees, (b) phase shift of 90 degrees, and (c) phase shift of 180 degrees |
4. Conclusions
In this study, the acousto-optic optical phase-shifting method was successfully applied to control and measure the required optical phase shifts directly in the Mach-Zehnder interferometer by varying the phase delays between the two driving RF signals. At the same time, a digitally programmable phase shift and measuring system was designed to provide for the precise phase shifts measurement in the experiment. By monitoring and measuring the phase-shift of the two RF signals with a 100 MHz digital oscilloscope, phase-shifts of zero degrees, 90 degrees and 180 degrees were achieved using both the Dual-Trace and the Lissajous Figure methods. In particular, both Dual Trace and Lissajous Figures techniques were used to determine the behavior of the optical phase shifting system in terms of accuracy and repeatability. Since the input signal frequency used in these experiments was 57.256 MHz with the incremental delays of 0.25 ns, an approximate phase resolution of 5 degrees was achieved. The research further extends the field of AOMs applications, and provides a new route for precision optical phase-shift measurementsin interferometry.
ACKNOWLEDGEMENTS
This research work was conducted at Jomo Kenyatta University of Agriculture and Technology Optics and Lasers Research Laboratory and supported by Kenyatta University.
References
| [1] | Hariharan, P., Areb, B. F., and Eyui, T., “Digital phase-shifting interferometry: a simple error-compensating phase calculation algorithm,” Appl. Opt., 26, 2504–2505 (1987). |
| [2] | Bruning, J. H., Herriott, D. R., Gallagher, J. E., Rosenfeld, D. P., White, A. D., and Brangaccio, D. J., “Digital WavefrontMeasuring Interferometer for Testing Optical Surfaces and Lenses,” Appl. Opt., 13, 2693-2703 (1974). |
| [3] | Soobitsky, J. A., “Piezoelectric micromotionactuator,” US Patent 4577131, (1986). |
| [4] | Hayes, J. B., “Compact micromotion translator,” US Patent 4884003, (1989). |
| [5] | Kihm H., and Kim S.-W., “Fiber optic diffraction interferometer for testing spherical mirrors”, Proceedings of SPIE, 4777, 394-400, (2002). |
| [6] | Kihm H., and Kim S.-W., “Oblique fiber optic diffraction interferometer for testing spherical mirrors”, Optical Engineering, 44, 125601-1-4 (2005). |
| [7] | Stevenson, W. H., “Optical frequency shifting by means of a rotating diffraction grating,” Appl. Opt., 9, 649–652 (1970). |
| [8] | Bryngdahl, O., “Polarization type interference fringe shifter,” J. Opt. Soc. Am., 62, 462–464 (1972). |
| [9] | Cheng, Y.-Y., and Wyant, J., “Phase shifter calibration in phase-shifting interferometry,” Applied Optics, 24, 3049-3052 (1985). |
| [10] | Goodwin, E.P., and Wyant, J.C., “Field guide to interferometric optical testing,” SPIE- the International Society for Optical Engineering, Bellingham, Washington, (2006). |
| [11] | PhysikInstrumente GmbH & Co. KG., “Piezoelectrics in Positioning: Tutorial on Piezotechnology in Nano-positioning Applications,” 2-172-2-217 (2008).http://www.physikinstrumente.com/tutorial/4_21.html |
| [12] | Sekedi, B. K., and Huazhong, Y., “Digitally controllable delay element using switched-current mirror,” WSEAS Transactions on Circuits and Systems, 8, 599-608 (2009). |
| [13] | Chieu, D.T., “Acousto-optic devices: Optical elements for spectroscopy,” Analytical Chemistry, Marquette University, 64, 971A-981A (1992). |
| [14] | Chang, I.C., “Acousto-optic devices and applications,” IEEE Trans. Sonics Ultrasonics, SU-23, 2-22 (1976). |
| [15] | Berg, N. J., and Pallegrimo, J. M., “Acousto-optic signal processing: Theory and implementation,” Marcel Dekker, Inc., New York, (1996). |
 Abstract
 Reference
 Full-Text PDF
 Full-text HTML