R. K. Mishra1, S. P. Pandey2, Jitendra Gaur3
1Krishna Institute of Engineering and Technology, Ghaziabad, U.P., 201206, India
2IIMT College of Engineering, Greater Noida, G.B. Nagar, U.P., 201306, India
3BRCM, College of Engineering and Technology, Bahal Bhivani, Haryana, 127028, India
Correspondence to: R. K. Mishra, Krishna Institute of Engineering and Technology, Ghaziabad, U.P., 201206, India.
| Email: |  |
Copyright © 2012 Scientific & Academic Publishing. All Rights Reserved.
Abstract
The thermodynamic behaviour of glass forming undercooled melt have been studied by analysing the temperature dependence of the Gibbs free energy difference (ΔG) for six polymeric glass forming materials[O-terphenyl, Tri-α-naphthyl benzene, Glycerol, Ethanol, 2-methylpentane and Phenyl salicylate (salol)] between the undercooled melt and the corresponding equilibrium solid phases. The expression obtained by expanding free energies of the undercooled liquid and solid phases of the materials in the form of Taylor’s series expansion. The procedure for the estimation of the ideal glass transition temperature has been reviewed together its importance in the glass forming ability of materials. The glass forming ability of undercooled materials is also explained in terms of ratio of reduced glass transition temperature and ideal glass transition temperature. It has also reported that Glycerol has the largest melting interval with the poorest glass forming ability among these six polymers. It has also been found that the best polymeric glass forming materials are at near eutectic composition. There is a strong correlation between glass forming ability of these polymeric materials.
Keywords:
Glass Transition Temperature, Undercooled, Taylor’s Series Expansion, Ideal Glass Transition Temperature
Cite this paper:
R. K. Mishra, S. P. Pandey, Jitendra Gaur, "The Correlation between Reduced Glass Transition Temperature and Glass Forming Ability of Undercooled Polymeric Glasses", International Journal of Optoelectronic Engineering, Vol. 2 No. 5, 2012, pp. 26-29. doi: 10.5923/j.ijoe.20120205.01.
1. Introduction
The thermodynamic behaviour of glass forming polymeric melts has been studied employing the expressions based on Taylor’s series expansion and it is found that the expression for ΔG, obtained are capable to explain temperature dependence of the thermodynamic quantities (ΔG, ΔH and ΔS ) of glass forming polymeric melts quite satisfactorily. It is quite interesting to see the response of expression obtained on the basis of Taylor’s series expansion in explaining the temperature dependence of the thermodynamic quantity ΔG for glass forming organic liquids. The present study is for the Gibbs free energy difference (ΔG) between liquid and solid phases for glass forming organic melts by calculating ΔG for six different samples of organic glasses; o-terphenyl (o-ter), tri-α-napthyle benzene (tri-α-NB), phenyl salicylate (salol), glycerol, ethanol and 2-methylpentane (2-mp) in the temperature range Tm to Tg in the frame of expression based on Taylor’s series expansion.The expression for the entropy difference ΔS based on Taylor’s series expansion has been further employed to find the Kauzmann temperature (TK ) and the residual entropy (ΔSR ) for all six samples of glass forming organic liquids as stated above. Attempt has been made to correlate TK and Tg on the basis of results obtained and a linear relation is obtained between (Tg/Tm ) and (TK/Tm). The variation of TK with ΔCpm /ΔSm has also been studied by expressing TK/Tm (= δ) in the term of ΔCpm/ΔSm .
2. Results and Discussion
2.1. Temparature Variation of ΔG
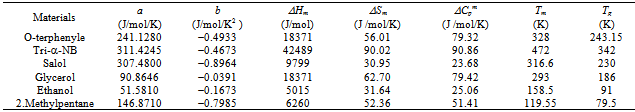
The material constants used in the present analysis are taken from the reports of earlier authors[6-12] and are listed in Table 1. The temperature dependence of the thermodynamic parameter ΔG for glass forming organic liquids are studied by estimating ΔG, ΔH and ΔS of six different samples o-ter, tri-α-NB, salol, glycerol, ethanol and 2-mp in the temperature range Tm to Tg with the help of expressions for the respective parameters based on the Taylor’s series expansion 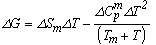 | (1) |
 | (2) |
and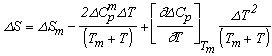 | (3) |
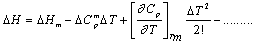
and the results obtained are illustrated in Fig. 1 for ΔG along with experimental values. The experimental values of the various thermodynamic quantities ΔG, ΔH and ΔS are calculated with the aid of the basic thermodynamic relations as given  | (4) |
 | (5) |
 | (6) |
 | (7) |
which is found to be correct for the most of organic simple liquids. Where a and b are constants.The variation of ΔG for the glass forming organic liquids can be studied with the help of Fig. 1 which shows a very good agreement between calculated and experimental values of ΔG in the entire temperature range Tm to Tg for all samples. It is interesting to note that nature of variation of the thermodynamic quantity ΔG with temperature is almost similar for all samples. In view of results illustrated in Fig. 1, it can be said that the response of the expression for ΔG obtained in the frame of Taylor’s series expansion is very good for explaining the temperature dependence of thermodynamic quantity ΔG of glass forming organic liquids also. At the same time, these expressions are quite simple and require the knowledge of ΔCpm, ΔSm and Tm which can be measured experimentally without having much complications.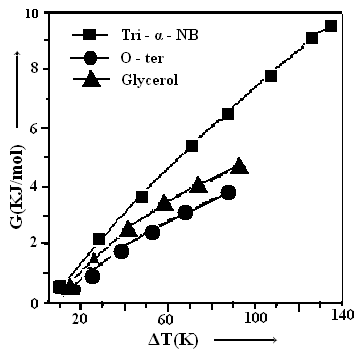 | Figure 1. Gibbs free energy (ΔG) and Temperature difference (ΔT) for the three organic compounds have been shown. The symbols explain the experimental and Line denoted the calculated values respectively |
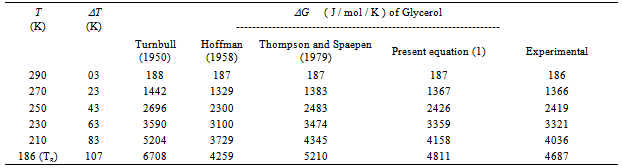
An attempt is made in Table 2 to compare the values of ΔG estimated on the basis of earlier expressions reported by Turnbull, Hoffman and Thompson and Spaepen [1-3] and expression used in the present work based on Taylor’s series expansion. Glycerol is taken as an example and analysis is made in the temperature range Tm to Tg . Table 2 shows that the agreement between the calculated and the experimental values of ΔG for glycerol is best at all temperatures with a discrepancy of about 3.3 at T= Tg for the maximum undercooling of 107 K which can be compared with the discrepancies of about 43.1 , 9.1 and 11.2 at T = Tg obtained in the frame of expressions proposed by Turnbull, Hoffman and Thompson and Spaepen respectively.Table 1. The material parameters used in the study of the various thermodynamic parameters ΔG, ΔH and ΔS of glass forming organic melts
 |
| |
|
Table 2. Free energy difference ΔG between undercooled liquid and corresponding equilibrium solid phases of glycerol calculated using various expressions of ΔG proposed by earlier investigators. Experimental values of ΔG is evaluated using experimental data of ΔCp
 |
| |
|
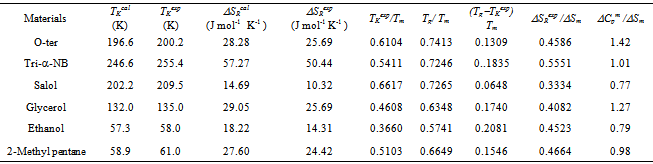
Table 3. The value TK and ΔSR for glass forming organic materialsobtained in the present study. TKexp and ΔSRexp are based on the experimental data of ΔCp
 |
| |
|
2.2. Ideal Glass Transition Temperature (TK)
According to Kauzmann[4], a liquid losses its entropy at a faster rate than the equilibrium solid resulting in the two phases having the same entropy at some temperature TK which is known as iso-entropic temperature and TK is below Tg and much above the absolute zero. The ideal glass transition temperature or iso-entropic temperature plays an important role in the study of viscosity as well as glass formation ability of materials. Thus, it is quite desirable to study TK . The ideal glass transition temperature TK can be caculated as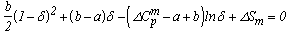 | (8) |
where b =  and a = Tm
  The equation stated above is transcendental in nature and can be solved for δ using iterative procedures.The ideal glass transition temperature TK has been estimated for six sample of organic material by solving equation (8) using iterative procedure and the values obtained are listed in Table 3. The experimental values of TK has also been extrapolated using experimental values of ΔCp and basic thermodynamic relation stated in equation (6) and results obtained are also reported in Table 3 which shows a very good agreement between calculated and extrapolated values of TK for all samples.
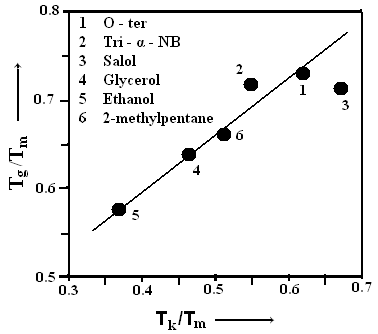 | Figure 2. The calculated and experimental values (TK/Tm) and (Tg/Tm) of all the six samples have been shown |
It is interesting to study the variation of the glass transition temperature Tg with the ideal glass transition temperature TK . The variation of Tg/Tm with TK/Tm is demonstrated in Fig. 2 for organic materials on the basis of results obtained in the present analysis which shows a linear relation | (9) |
with correlation coefficient r = 0.9755. A similar relation has also been reported by Mishra and Dubey[ 16] for the metallic glasses. The average value of Tg /TK is found to be 1.32 ± 10 %which can be compared with the values 1.30 ± 8.4 % and 1.29 ± 10 % reported by Adam and Gibbs and Bestul and Chang[17-18] respectively. It can also be compared with the value 1.31 ± 14 % and 1.36 ± 21 % reported by Dubey and his co-workers (Dubey et al., Mishra and Dubey[6-7 and 14] based on the relaxation phenomenon. 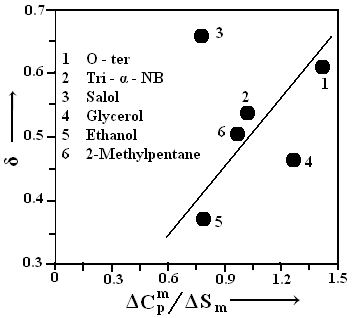 | Figure 3. The calculated and experimental values (ΔCpm /ΔSm) and (δ) of all the six samples have been shown |
The ideal glass transition temperature TK is mainly controlled by the ratio ΔCpm /ΔSm and it is interesting to study the variation of TK with ΔCpm /ΔSm which has been illustrated in Fig. 3. An attempt is made to express δ in terms of ΔCpm /ΔSm and one can have an empirical relation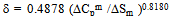 | (10) |
with correlation coefficient r = 0.9059. With the help of Fig. 3, it can be seen that the reduced ideal glass transition temperature (TK/Tm) increases with increasing ΔCpm/ΔSm which is similar to the earlier findings of Dubey and Ramachandrarao[6] based on the analysis of different kinds of glasses using the hole theory of liquid.
3. Conclusions
The temperature dependence of the thermodynamic quantities, the Gibbs free energy difference (ΔG), enthalpy difference (ΔH) and entropy difference (ΔS) between the undercooled melt and the equilibrium solid phases has been studied in the framework of Taylor’s series expansion for six different samples of glass forming organic liquids in the temperature range Tm to Tg and it is found that the expression stated in equation (1) for ΔG based on Taylor’s series expansion is capable of explaining the temperature dependence of respective parameters quite satisfactorily. The value of ΔG obtained in the present work is better than ΔG obtained in the frame of expression reported by earliar worker. At the same time, these expressions require the knowledge of ΔCpm, ΔSm and Tm which can be measured experimentally without much complications.The ideal glass transition temperature TK has also evaluated for organic samples on the basis of ΔCpm /ΔSm and and (Tg –TK)/Tm. It is found that the ideal glass transition temperature (TK) is mainly controlled by the ratio ΔCpm /ΔSm and there exists a linear relation between TK/Tm and Tg/Tm . The material having a large ΔCpm /ΔSm and large TK/Tm and such material can be a better glass former as compared to those having a low value of ΔCpm /ΔSm and low TK/Tm.
References
| [1] | D.Turnbull, J.Appl.Phys, 21 (1022) 1950. |
| [2] | J.D.Hoffman.J.Chem.Phys. 29 (1192) 1958. |
| [3] | C.V.Thompson and Spaepen , Act Metall. 27(1855) 1979. |
| [4] | W.Kauzmann, Chem. Rev. 42 (219) 1948. |
| [5] | D.R.H. Jones and G.A.Chadwick, Phil, mag. 24 (995) 1971. |
| [6] | K.S.Dubey and P.Ramachandrarao, Acta Metall, 32 (91) 1984. |
| [7] | K.S.Dubey and P.Ramachandrarao, Int. J. Rapid Solidification 1 (1) 1984-85. |
| [8] | R.K.Mishra and K.S.Dubey , J. Thermal Anal and Calo, 621 (687-702) 2000. |
| [9] | G.P. Johari, J. Chem Phys. 112 (7518) 2000. |
| [10] | N Wang and B. Bei, Appl. Phys. Lett. 80 (3515) 2002. |
| [11] | N.Wang, J.Han and B.Wei, Appl.Phys. Letts. 80 (28) 2002. |
| [12] | O.Li, Y.Y.Rb Lui. Appl. Phys Letts. 85 (558) 2004. |
| [13] | J.G. Kaun, J. Metastable and Nanocryst Material Vol. 24-25 (475-478) 2005. |
| [14] | R.K.Mishra and K.S.Dubey , J Non-Cryst Solids Vol. 355 , (2199-2204) 2009. |
| [15] | K.N.Lad J.of Aloys And Compounds, Vol 483, Part 1-2 (54-56) 2009. |
| [16] | R.K.Mishra and K.S.Dubey , J. Thermal Anal., 50 (843-856) 1997. |
| [17] | G. Adam and J.H. Gibbs, J. Chem. Phys., 43 (139)1965. |
| [18] | A.B. Bestul and S.S. Chang, J. Chem. Phys., 40 (3731)1964. |
 Abstract
 Reference
 Full-Text PDF
 Full-Text HTML