P. Kishore , D. Dinakar , M. Sai Shankar , K. Srimannarayana , P. Vengal Rao , D. Sengupta
Department of Physics, National Institute of Technology, Warangal, A.P.-506 004, India
Correspondence to: P. Kishore , Department of Physics, National Institute of Technology, Warangal, A.P.-506 004, India.
| Email: |  |
Copyright © 2012 Scientific & Academic Publishing. All Rights Reserved.
Abstract
A non-contact vibration sensor is demonstrated using bifurcated bundle fiber based on the principle of extrinsic reflective intensity modulation for monitoring the health condition of the diesel engine. An IR-source is used along with glass fibers to avoid the effect of stray light in sensing. The encapsulation of the sensor enables easy alignment, flexible handling and usage in harsh environments. The sensor is capable of measuring the frequencies up to 650Hz with vibration amplitude resolution of 10µm, enough to monitor the vibrations generated in heavy machines like diesel engine.
Keywords:
Bifurcated Bundle Fiber, Transmitting Fibers, Receiving Fibers, IR-LED, Photo Diode, Vibration Sensor, Encapsulation, Diesel Engine, Real Time Monitoring
Cite this paper:
P. Kishore , D. Dinakar , M. Sai Shankar , K. Srimannarayana , P. Vengal Rao , D. Sengupta , "Non-Contact Vibration Sensor Using Bifurcated Bundle Fiber for Real Time Monitoring of Diesel Engine", International Journal of Optoelectronic Engineering, Vol. 2 No. 1, 2012, pp. 4-9. doi: 10.5923/j.ijoe.20120201.02.
1. Introduction
The periodic and non periodic change in displacement of mechanical and structural system about an equilibrium position is called vibration. Vibration measurement plays a major role in studying the dynamic behavior and failure of components in machines[1-2]. Rotating machinery such as diesel engines, pumps and compressors are of the most critical classes of equipment in industry today. Unpredicted failures in this category of machines often result in dire consequences. The sudden failure of machinery causes financial lose and harm to the personnel manning the machine. To avoid and minimize these effects, it is important to develop a comprehensive sensor to monitor the health condition of the machine and improve the reliability of the machine. Continuous monitoring reduces maintenance, operating cost and also avoiding undesirable engine working and frequent interruptions. The monitoring process consists of periodic or continuous data collection, analysis, interpretation and diagnosis[3-7].In general vibration is measured by electromechanical devices, such as piezoelectric, piezoresistive, or capacitive accelerometers. They require physical contact with the vibrating object which introduces the perturbation. In the present study, a non-contact fiber optic vibration sensor is developed to overcome this difficulty. Fiber optic sensors play a major role in sensing vibration apart from displacement and pressure and the advantage being high sensitivity, immune to EMI and low cost of maintenance[8-10]. Worksbased on the reflective intensity modulation technique using bifurcated bundle fiber for monitoring the health condition of machines due to vibrations. It consists of a light source, a photo detector and hemicircular bifurcated bundle fiber consisting transmitting fibers (TFs) and receiving fibers (RFs). The light is transmitted through TFs onto the target surface and the reflected light is received by the RFs. The reflected light intensity is finally measured by a photo detector. The frequency and amplitude of vibration of the target is measured using digital storage oscilloscope.
2. Sensor Configuration and Principle
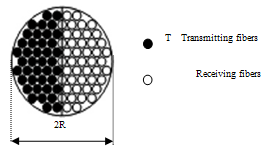 | Figure 1. Schematic front end of the Bifurcated bundle fiber |
A Bifurcated bundle fiber with diameter '2R' having hemicircular configuration is used for vibration sensing. It consists of a bundle of transmitting fibers 'Nt', for directing the light to the target, and a bundle of receiving fibers 'Nr', to collect the light reflected by the target. All the fibers have the same numerical aperture (NA), core radius 'r' and cladding thickness ’t’. The cross sectional front end view of the sensor is shown in Fig. 1. In comparison with all reflective-type fiber optic sensors it has good characteristics such as transfer ratio, range of displacement and resolution[11]. This configuration has the advantage of longer front slope linear region and peak width than the Random and concentric configurations[12-13]. The sensing window of the conventional plastic fiber is in the visible region, and is effected by the environmental stray light. But the glass fiber has the sensing window in the IR region and the effect of stray light in sensing is negligible.In order to calculate power received by the receiving fibers with respect to the axial displacement ‘z’, the arrangement of fibers in bundle is represented by a closely packed hexagonal lattice. The center to center distance between any two arbitrary adjacent fibers is given by l =2r+2t, where r and t are the radius and thickness of the core and clad respectively. The position of the TFs and RFs using hexagonal coordinates is given by [13] | (1) |
 | (2) |
Where  is the distance from a fiber S(x, y) to the origin and
  The distance between the fibers with positions T(xi, yi) and R(xj, yj) is given byWhere i=1….Nt and j=1 …Nr.The light intensity response, which is characteristic of the fiber bundle, is the summation over that of NtNr interactive fiber pairs. The power received by the jth RF from the ith TF is given by
 | (3) |
Where γ is the reflectivity of the target surface and  the effective radius of the output optical field and is defined by
  | (4) |
in which α, ε and n are the three regulating parameters of light intensity distribution relative to the characteristics of the light source and TF. Under assumption that the light power emitted from the end of each TF has the same value, P0, the total power received by the bundle RFs is given by the summation model | (5) |
An optical fiber bundle of R=2mm front end radius consisting of 301 glass fibers with identical parameters of r=100µm, t=10µm, and NA=0.22 are used to carry out the theoretical analysis for the proposed sensor. Fig. 2 shows the theoretical and experimental displacement response of the sensor. Comparably, the experimental results are in good agreement with the theoretical results.
3. Encapsulation of the Sensor
The sensor is encapsulated to avoid the effect of temperature and chemical fumes and to facilitate easy mounting of the sensor for micro adjustment. In contrast to the conventional sensors affected by surrounding electric field environments, the optical fiber sensors are immune to the same. Optical fibers are flexible and fragile in nature and the encapsulation prevents bending and breakage.Teflon being a material having excellent thermal and electrical insulation, resistive to UV light and weather, has been chosen for the encapsulation of the sensor. The Teflon bar of 320mm length and 22mm square is taken and cut into two equal halves along its length. ‘Y’ type grooves are made to place the bifurcated bundle fiber conveniently. An IR-LED and photodiode are placed at the TFs end and RFs end respectively and sealed in respective grooves. This setup is covered with other similar half of the Teflon bar and tightened with the help of screws Fig.3. The sensor is the front end (4mm diameter) of a bifurcated bundle fiber of 320mm length having hemispherical configuration from Oriel instruments (Model no 77533). The Bifurcated bundle consists half portion of TFs and the other of RFs. IR-LED (IR333/H0/L10) of peak wavelength 940nm is used as source and the Photodiode (PD333-3B/H0/L2) is used to detect the reflected light from the vibrating target.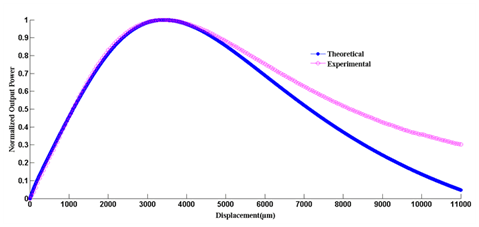 | Figure 2. Theoretical and experimental response of the sensor |
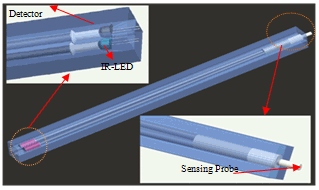 | Figure 3. Schematic diagram of the sensor head |
4. Experimental Setup
The experimental setup of the vibration sensor is as shown in fig. 4. It consists of a sensor head, micrometer, function generator, speaker, Regulated Power supply, Transimpedance amplifier and digital storage oscilloscope. A Commercial speaker with a reflector attached at the center of it and a synthesized function generator (HM8130) are used to test the sensor. The position of the sensing probe from the reflector is adjusted by a micrometer. A regulated power supply is used to drive constant power to the IR LED. Transimpedance amplifier is used to convert the received light intensity into its equivalent voltage signal. To record and monitor the vibration of the speaker at different frequencies and amplitudes a Digital storage oscilloscope (SM1060) is used.The light from the LED is coupled into the TFs and it is incident on the vibrating object. The modulated reflected light is intercepted by RFs and is detected by the photo detector. The Transimpedance amplifier converts the detected light intensity into its equivalent voltage signal and monitored by the storage oscilloscope. The FFT technique is used to analyze the vibration in terms of frequency of the object.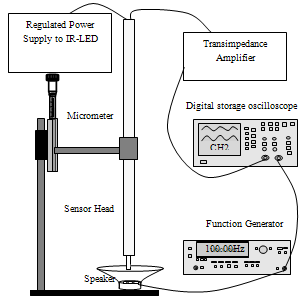 | Figure 4. Schematic experimental setup of the vibration sensor |
5. Calibration of the Sensor
The sensor is calibrated to measure the amplitude of vibration. The sensor head is fixed to the micrometer translational stage and is positioned perpendicular to the reflecting surface of the vibrating object. The probe is moved from the reflecting surface in steps of 10µm over a span of 15mm using the micrometer and the corresponding output power recorded by the digital multimeter is plotted in fig. 5. Two sensitivity slopes are found, one on either side of the peak output (9720mV) at a displacement of 3370 µm from the reflecting surface. The sensitivity of the front slope and back slopes are 4.4mV/µm and 1.2mV/µm for the linear displacement region of 0-1500µm and 4200-8200µm respectively. For vibration measurements, both front and back slopes can be used. The High sensitivity front slope is considered for the vibration measurement.
6. Results and Discussion
Fig. 6 (a)-(d) show the input signal (sine wave) applied to the speaker and the response of the sensor. The FFT of the applied signal and sensor output signal shows the perfect matching in the frequencies.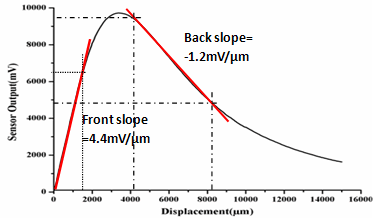 | Figure 5. Displacement characteristic curve of the sensor |
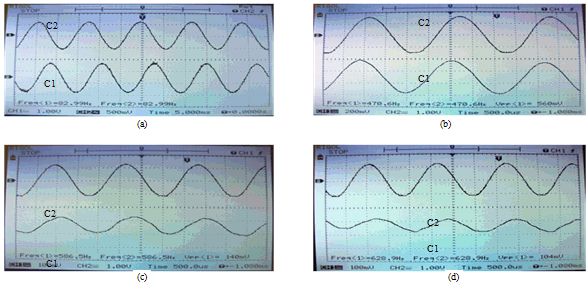 | Figure 6. The Output signal (C1) of the sensor and input signal (C2) to the speaker at different frequencies a) 82.99Hz, b) 470.6Hz, c) 586.5Hz and d) 628.9Hz |
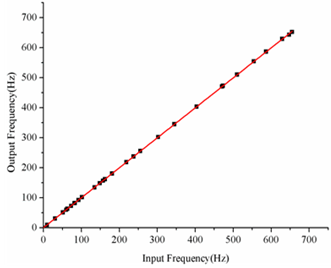
The peak to peak of the output signal gives the amplitude of vibration and from the calibration it corresponds to the displacement amplitude ( ). The sensor is periodically checked to assure its correct operation and some minor malfunctions are amended. The frequency response of the sensor in the range of 0-650Hz, plotted in figure 7, indicates excellent performance of the vibration sensor. The obtained results show an excellent matching between the frequencies applied to the speaker and the one measured by the sensor. The peak velocity
  and peak acceleration
 for a given frequency
  can be computed by
 | Figure 7. Frequency response of the vibration sensor |
 | (2) |
 | (3) |
The amplitude response of the sensor between the driving voltage to the speaker and output signal FFT peak voltage at different frequencies are plotted in figure 8. It indicates that the amplitude of vibration is linear with respect to the driving voltage to the speaker. The resolution of the sensor is calculated from the minimum amplitude of vibration detected by the sensor at maximum frequency. The sensitivity of the vibration sensor is found to be 4.4mV/µm from the displacement characteristic curve (figure 5). Experimentally the minimum amplitude resolvable by the sensor is 44mV, which in turn gives a resolution of 10µm.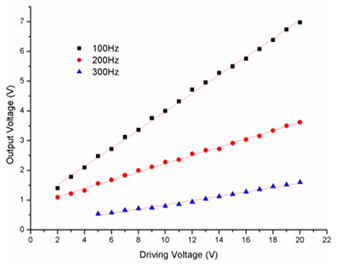 | Figure 8. Amplitude response of the sensor with respect to driving voltage to the speaker |
 | Figure 9. Sensor fixed at operating points for diesel engine monitoring |
7. Insitu Engine Monitoring
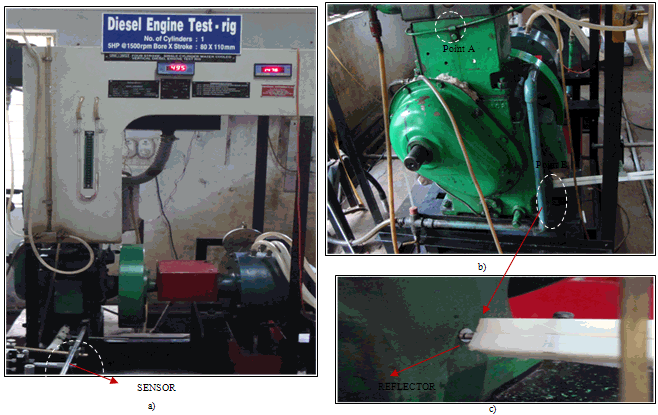
The sensor is fixed to a diesel engine to monitor the health condition (see figure 9). The encapsulation facilitates easy fixation of the sensor at any point of the engine. The sensor is tested at two different points. Point ‘A’ is close to the combustion chamber on the cylinder head and point ‘B’ is at the bottom part of the engine (crank base). The calibrated reflector (used while calibration) is glued at these two points and the sensor is operated within the linear region. Figure 9 (a) shows the arrangement of the senor to the diesel engine, figure 9 (b) shows the points at which the sensor is tested and figure 9 (c) shows the non-contact alignment of the sensor at the testing point.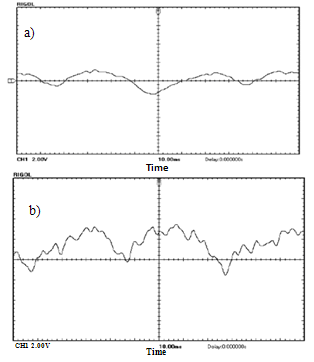 | Figure 10. Output signal of the sensor a) without any pressure leakage 24.91Hz and b) with leakage of pressure 32.5Hz, at the combustion chamber due to gasket damage |
Performance of the diesel engine is monitored due to failure at different vibration conditions. The results, shown in figure 10, refer to the signal and noise levels, and the evolution of the vibration with respect to time. As regards to the noise amplitudes, at different points the vibration signals encountered different amplitudes. The voltage signal of the sensor with respect to time is shown in figure 10 at the point ‘A’ recorded by storage oscilloscope and stored using the software (Scope Kit for DS5000). The gasket is replaced with damaged gasket to test the detection of failure of the engine. The gasket head leakage location has been selected randomly. At this point the vibration of the engine depends on the leakage of the pressure due to the damage of gasket. In general the vibration of the engine is periodic and it corresponds to the shaft rotation. In this case, the vibration of the engine is 24.91Hz without any pressure leakage. Due to the leakage the engine vibration changes and frequency increases to 32.2Hz. At the point ‘B’ the vibration of the engine is studied for load effect. The output signals indicate, as load increases irregularity in amplitude of vibration is observed (figure 11). This may be due to decrease in ignition delay, variation of local or in cylinder air fuel ratios at higher loads.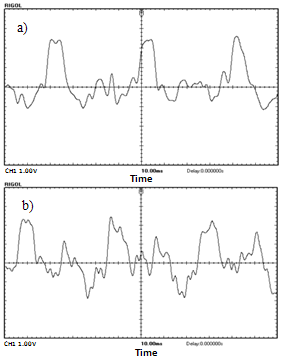 | Figure 11. Output signal of the sensor for a) no load 24.63Hz and b) 60% load 25.55Hz |
8. Conclusions
In this paper, a noncontact vibration sensor has been presented using hemicircular bifurcated bundle fiber for real time monitoring of health condition of the heavy engines like diesel engine and compressor. The sensor can sense vibrations of frequencies 0-650Hz with 10µm resolution. The encapsulation of the sensor enables easy alignment, flexible handling and usage in harsh environments. The sensor has very simple geometry and is of low cost. The noncontact measurement of the vibrations is useful in industries where conventional sensors fail. The sensor is positioned very close to the vibrating target and not requires special optics and especially useful for sensing applications in embedded situations. The sensor is capable of monitoring the heavy engines to detect their malfunctions.
References
| [1] | J. David Zook, William R. Herb, C.J. Bassett, Terry Stark, Jeff N. Schoess and Mark L. Wilson, " Fiber Optic Vibration sensor based on frequency modulation of light –excited oscillators", Sensors and Actuators 83, 270-27, 2000 |
| [2] | J Slavic, P Cermelj, A Babnik, J Rejec, J Mozina and M Boltezar, "Measurement of the bending vibration frequencies of a rotating turbo wheel using an optical fiber reflective sensor" Meas. Sci. Technol. 13, 477-482 , 2002 |
| [3] | J. Antoni, J. Daniere and F. Guillet “Effective Vibration Analysis of IC Engines Using Cyclostationarity. Part I-A Methodology for Condition Monitoring”, Journal of Sound and Vibration 257(5), 815–837, 2002 |
| [4] | J. Antoni ,J.Daniere and F. Guillet “Effective Vibration Analysis of IC Engines Using Cyclostationarity. Part I I-New Results on The Reconstruction of The Cylinder Pressures”, Journal of Sound and Vibration 257(5), 839–856, 2002 |
| [5] | M.F. Harrison and P.T. Stanev, “A linear acoustic model for intake wave dynamics in IC engines”, Journal of Sound and Vibration 269, 361–387, 2004 |
| [6] | A.P. Carlucci, F.F. Chiara and D. Laforgia, “Analysis of the relation between injection parameter variation and block vibration of an internal combustion diesel engine”, Journal of Sound and Vibration 295, 141 – 164, 2006 |
| [7] | S. Vulli , J.F. Dunne , R. Potenza, D. Richardson and P. King “Time-frequency analysis of single-point engine-block vibration measurements for multiple excitation-event identification”, Journal of Sound and Vibration 321, 1129 – 1143, 2009 |
| [8] | Y. Alayli, S. Topcu, D. Wang, R. Dib and L. Chassagne," Applications of a high accuracy optical fiber displacement sensor to vibrometry and profilometry", Sensors and Actuators A 116, 85-90, 2004 |
| [9] | Maria Luisa Casalicchio, Guido Perrone and Alberto Vallan, "A Fiber Optic Sensor for Displacement and Acceleration Measurements in Vibration Tests", I2MTC2009, Singapore, 5-7, May 2009 |
| [10] | M.R. Saad, Dr. M. Rehman and Dr. Othman Siddiqui, "Development of Linear Fiber Optic Pressure sensor", IEEE LTIMC2004, Palisades, New York, USA, 2004 |
| [11] | E. A. Zak and A. L. Tub, "Designing Reflectometeric Fiber-Optic Displacement Sensors", Measurement Techniques, Vol. 40, NO. 1, 42-45, 1997 |
| [12] | Atsushi Shimamoto and Kohichi Tanaka, "Geometrical analysis of an optical fiber bundle displacement sensor", Applied Optics, Vol. 35, No. 34, 6767-6774, 1996 |
| [13] | Huimin Cao, Youping Chen, Zude Zhou and Gang Zhang, "Theoretical and experimental study on the optical fiber bundle displacement sensors", Sensors and Actuators A 136, 580-587, 2007 |


 is the distance from a fiber S(x, y) to the origin and
  The distance between the fibers with positions T(xi, yi) and R(xj, yj) is given byWhere i=1….Nt and j=1 …Nr.The light intensity response, which is characteristic of the fiber bundle, is the summation over that of NtNr interactive fiber pairs. The power received by the jth RF from the ith TF is given by
 the effective radius of the output optical field and is defined by


 ). The sensor is periodically checked to assure its correct operation and some minor malfunctions are amended. The frequency response of the sensor in the range of 0-650Hz, plotted in figure 7, indicates excellent performance of the vibration sensor. The obtained results show an excellent matching between the frequencies applied to the speaker and the one measured by the sensor. The peak velocity
  and peak acceleration
 for a given frequency
  can be computed by


 Abstract
 Reference
 Full-Text PDF
 Full-Text HTML