Kulonga Nzobokela, Simon Tembo, Brilliant Habeenzu
Department of Electrical Engineering, University of Zambia, School of Engineering, Zambia
Correspondence to: Kulonga Nzobokela, Department of Electrical Engineering, University of Zambia, School of Engineering, Zambia.
| Email: |  |
Copyright © 2024 The Author(s). Published by Scientific & Academic Publishing.
This work is licensed under the Creative Commons Attribution International License (CC BY).
http://creativecommons.org/licenses/by/4.0/

Abstract
The study focuses on Enhancing Network Performance and Quality of Service (QoS) in a Wired Local Area Network (LAN). In today's interconnected landscape, the optimization of Local Area Networks (LANs) stands as a pivotal pursuit. The study aims to evaluate and discern the factors that significantly influence network performance and QoS utilizing the Optimized Network Engineering Tool (OPNET) Modeler. The key objectives are to design a network design that gives the best network performance and QoS; to evaluate link connections, connectivity, and effect on network performance, and to recommend and implement the best network designs, link connections, and connectivity that yield the best network performance and QoS. OPNET simulation software tool has been used to simulate the network design scenarios. The results highlighted the impact of link capacity on network performance, revealing that higher capacities led to lower HTTP response times. Conversely, lower capacity links struggled with simultaneous traffic, resulting in delayed responses. In terms of QoS, FIFO exhibited the highest data traffic drop, followed by Priority Queuing (PQ), while Weighted Fair Queuing (WFQ) boasted the lowest drop rate. Additionally, LAN delay increased as user volume accessing the network within the LAN segment grew. WFQ proved most effective in receiving video traffic, followed by First in First Out (FIFO) and PQ. Finally, PQ demonstrated superior handling of Voice Traffic. This analysis provides a holistic understanding of network dynamics, offering guidance to administrators for QoS enhancement, congestion mitigation, and fortification of network infrastructure against future challenges.
Keywords:
Computer Network, OPNET, QoS, LAN, Queuing Algorithms, and Performance
Cite this paper: Kulonga Nzobokela, Simon Tembo, Brilliant Habeenzu, Enhancing Network Performance and Quality of Service (QoS) in a Wired Local Area Network (LAN), International Journal of Networks and Communications, Vol. 13 No. 1, 2024, pp. 1-14. doi: 10.5923/j.ijnc.20241301.01.
1. Introduction
In today's interconnected world, where seamless connectivity is paramount, the efficiency and reliability of Local Area Networks (LANs) play a pivotal role. As businesses and individuals rely increasingly on networked systems, the demand for enhanced performance and superior Quality of Service (QoS) within wired LAN environments has never been more critical. This article delves into the strategies, technologies, and methodologies pivotal to bolstering network performance and elevating QoS within a wired LAN infrastructure. Whether optimizing for speed, minimizing latency, or prioritizing data traffic, understanding these mechanisms is central to fostering robust and high-performing LAN ecosystems. In general, Network performance is the measure of the service quality of a network as experienced by the user. It depends upon the nature and design of the network, and there are several methods for measuring network performance [1] [2] [3] [5]. In this case in a Wired Local Area Network (LAN). Quality of service (QoS) refers to any technology that manages data traffic to reduce packet loss, latency, and jitter on a network. QoS is typically applied to networks that carry traffic for resource-intensive systems for instance, videoconferencing, video on demand (VOD), and Voice over IP (VoIP) [4].To come up with a better solution to enhance Network Performance and Quality of Service (QoS) in a Wired Local Area Network (LAN), the study employed Optimized Network Engineering Tool (OPNET) software for computer network design simulations, modeling, and analysis [7] [8] [1]. Furthermore, it helped to Understand how different components within a wired LAN interact and can impact performance by identifying potential bottlenecks, inefficiencies, or areas for improvement by testing different configurations to optimize performance and QoS. The study aimed to design and develop a model that would help in testing the Network Performance and Quality of Service (QoS) in a Wired Local Area Network (LAN) using some network performance metrics and some QoS queuing algorithms. The key specific objectives were to come up with a network design that gives the best network performance and QoS; to evaluate link connections and their effect on network performance to recommend and implement the best network designs, link connections, and connectivity that enhances Network Performance and Quality of Service (QoS) in a LAN.When the available resources are used as effectively and efficiently as feasible, the network issues, such as queuing, transmission, propagation, and processing delays, including buffering requirements and network congestion of IP packets can be minimized or reduced [17].The study is dedicated to Enhancing Network Performance and QoS in a LAN with the strategic aim of not just optimizing but significantly mitigating all network bottlenecks. By doing so, the objective was to ensure that users experience nothing short of the best network performance they rightfully deserve. This research delved deeply into enhancing the LAN's capabilities, aiming to streamline operations, minimize disruptions, and ultimately provide users with an unparalleled and seamless network experience [3] [6] [7]. One of the first steps in measuring network performance is identifying the indicators that are important for your network's requirements and goals. Adding more bandwidth is not always the option to solve network bottlenecks [1]. Network performance metrics like throughput, packet loss, jitter, delay, and bandwidth are frequently utilized. These metrics provide valuable insights into various aspects of network behaviour. QoS helps to mitigate issues such as latency, packet loss, and jitter, which can negatively impact the user experience [4].The study highlighted the impact of link capacity on network performance, revealing that higher capacities led to lower HTTP response times. Conversely, lower capacity links struggled with simultaneous traffic, resulting in delayed responses. In terms of QoS, FIFO exhibited the highest data traffic drop, followed by PQ, while WFQ boasted the lowest drop rate. Additionally, LAN delay increased as user volume accessing the network within the LAN segment grew. Finally, WFQ proved most effective in receiving video traffic, followed by FIFO and PQ.Consequently, the paper is divided into sections with the following headings: Abstract: This section serves as a snapshot of the article, Introduction: It provides readers with insight by establishing the context and purpose of the article, Related Work: Examining other relevant works in the market, LAN: Discussing Network Life Cycle Models, LAN Network Designs, and Network design techniques, Research Methodology: Exploring the research methodology process and Network system design, Simulation Tool: Discussing the use of OPNET, Results and Discussion: Analysing and discussing the simulation results and Conclusion: Summarizing the entire article.
2. Related Work
Given its significance, several studies and research endeavors have explored facets related to the current subject matter. Among these investigations, Ufuoma Kazeem Okpeki, J.O Egwaile, and F Edeko undertook a study aimed at conducting a comparative analysis of wired and wireless communication systems within LAN, adhering to IEEE 802.3 and IEEE 802.11 standards. Their objective was to assess and compare the performance of these systems, evaluating factors such as throughput, delay, bit error, and Signal-to-Noise Ratio (SNR). The study utilized the e-library network at Delta State University as its experimental framework. [10] [11]. Atayero A, Alatishe A, and Iruemi J explored Covenant University's LAN through simulation in the OPNET Modeler Environment. Their goal was to enhance network efficiency for resource sharing and user information access. They investigated LAN design for performance amidst increasing traffic, focusing on metrics like latency. The study found that using only switches reduced Ethernet delay compared to configurations involving hubs or a mix of both. Initially, Ethernet delay increased as newly connected nodes raised network load but adding or removing a few nodes didn't significantly impact metrics. Switching from a switch to a hub halved the Ethernet delay due to the hub's faster packet forwarding, lacking the processing capabilities of a switch [12]. The University of Mines and Technology in Ghana employed OPNET simulation in their study titled 'Improving Network Performance with squidGuard.' They aimed to analyze user behavior and bandwidth utilization using Squid analysis. Despite a 60MB bandwidth capacity, the LAN, serving 3000 users, suffered from slowness and security vulnerabilities. The study found these issues stemmed from bandwidth misuse by certain users accessing low-priority, bandwidth- intensive sites, and applications. Additionally, ineffective bandwidth management policies contributed. Implementing squidGuard on the firewall server and defining access protocols significantly boosted LAN speed and security by prioritizing legitimate users and restricting access to high-demand, low-priority sites, and applications [13].Another study of 'Network Model Analysis in OPNET Simulation' focused on modeling and comparing LAN and WLAN using parameters like Ethernet delay, traffic sent, and received. Using FTP as a traffic application in OPNET, the study found that LAN outperformed WLAN in terms of speed, showing no delay compared to seconds of delay in WLAN. Additionally, LAN received considerably more traffic over time. The findings suggest that for non-mobile setups, LAN is superior. However, the study acknowledges that these results are specific to OPNET and might differ from other network simulators [14].Furthermore, another study using OPNET™ It Guru Academic Edition Software aimed to optimize network performance by designing configurations and selecting equipment to meet diverse user requirements. The simulation revealed that faster Ethernet cabling enhances performance. Distributing services among multiple servers affects CPU utilization based on service types. It was concluded that deploying multiple servers for different services is unnecessary if a balance exists between frequently and less frequently used services [15].In another development, the N.C Campus network at Bahria University conducted a study focusing on modeling, simulating, and optimizing their network infrastructure. They utilized OPNET to assess delay, load, and throughput under various network conditions. Analysing the results graphically helped identify the most optimal network configuration. The study encompassed WLAN and LAN as two primary network types [16]. A study examined three network topologies; star, ring, and bus to determine the most suitable physical layout for a LAN using the OPNET simulator. It evaluated these topologies with varying numbers of connected nodes (5, 10, 15, and 20). Four scenarios were configured for each topology. The analysis focused on Delay (Sec.), Load (Bits/Sec.), Traffic Received (Bits/Sec.), and collisions for single nodes (servers). Findings revealed performance degradation as network size increased and indicated the bus topology was more affected compared to the other topologies [17].Last, but not least, CIT College conducted a study to enhance their network's efficiency, focusing on criteria like performance, throughput, delay, and security. Despite a well-designed network, they faced issues including hardware failures, bandwidth congestion, and server processing delays. Emphasizing the need for daily network diagnostics, the paper aimed to simulate and analyze the LAN network's performance using NETSIM. The study identified areas for improvement, achieving increased throughput and reduced delay by adjusting parameters in application types, switching modes, and transport layers for wired and wireless nodes within their well-designed yet problematic network.
3. Local Area Network (LAN)
A LAN is a group of computers or network devices interconnected within a single, limited area through Ethernet or Wi-Fi [1]. In another study from CISCO, LAN was defined as a collection of devices connected in one physical location, such as a building, office, or home. A LAN can be small or large, ranging from a home network with one user to an enterprise network with thousands of users and devices in an office or school [2]. Below is a sample LAN diagram.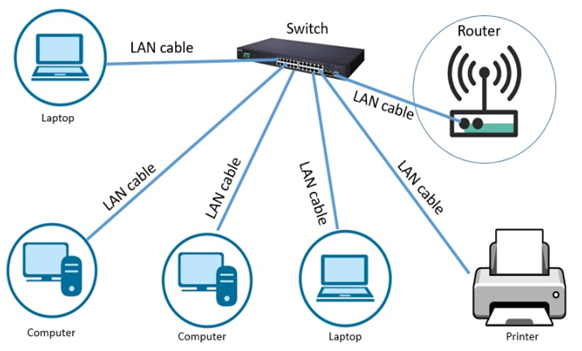 | Figure 1. Local Area Network diagram [1] |
3.1. Network Life Cycle Models
Before looking at network design, it’s imperative to have an evaluation of network life cycle models. In the context of network design, a network lifecycle model helps explain where and how network design fits into the broader lifespan of your network’s components and overall structure [1]. There are several Network Life Cycle Models namely Cisco’s PPDIOO (Prepare, Plan, Design, Implement, Operate, and Optimize) model [2] [1], Cisco‘s PBM (Plan, Build, Manage) [3], and Network Development Life Cycle-NDLC [4]. Irrespective of which model you select, the overall stages of information gathering, design, implementation, and improvement — and cyclical nature are the same. The important takeaway is understanding any network lifecycle and where network design fits in. The most popular model is the Cisco’s PPDIOO model [5].
3.2. LAN Network Designs
Network design, according to Petryschuk, involves planning and structuring a communication network within an organization. It begins by identifying business and technical needs and spans until just before network implementation. This process encompasses network analysis, IP addressing, hardware selection, and implementation planning. Smaller networks, such as small offices or domestic setups, can have straightforward design processes. However, in large enterprise networks, the design phase tends to be intricate, involving multiple stakeholders [5]. He furthermore defines network design as the planning and structuring of a communication network within an organization which encompasses identifying business and technical needs, network analysis, IP addressing, hardware selection, and implementation planning. Smaller networks, like small offices or domestic setups, often have simpler design processes. Conversely, large enterprise networks involve complex design phases with multiple stakeholders [6]. In network infrastructure design involving Ethernet, understanding Ethernet topology is crucial. Ethernet networks commonly use physical bus or star topologies. While the logical topology functions as a bus, broadcasting messages to all network devices through cabling. Knowledge of LAN cable selection as Ethernet transmission media is essential in this context [6].Dividing a network into smaller segments is typically achieved by adding switches and cables strategically to alleviate congestion. In a study by N able Solutions ULC and N able Technologies Ltd, they emphasized key aspects of network infrastructure design: a clear network map, cabling structure, device quantity/type/location, IP addressing, and network security details. Network design is the essential planning phase for a company's IT infrastructure before implementation. It involves comprehensively connecting network devices such as routers, switches, servers, and other devices to optimize network performance. A well-designed network, executed by network designers, IT managers, or administrators, enhances operational efficiency Top of Form [7]. Another network solutions company called “Lazapoint” echoed that for employees to work productively, one needs to have a high-performing core network infrastructure [8]. Figure 2,3,4 below shows some sample LAN network designs from some sampled organizations’ networks from the Internet.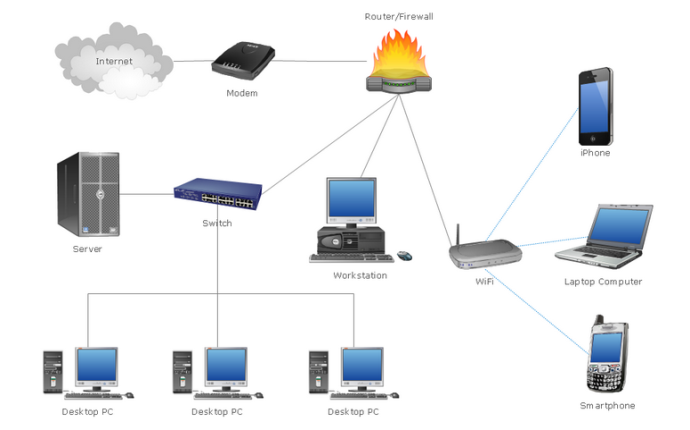 | Figure 2. Sample network diagram design from internet [9] |
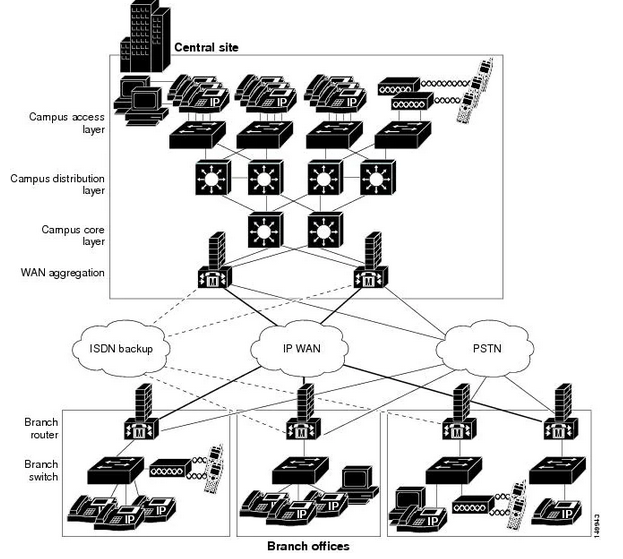 | Figure 3. Sample Network diagram design from internet. [10] |
 | Figure 4. Sample Network diagram design. [11] |
3.3. Network Design Techniques
Some literatures have been written on the basics of a network lifecycle model in designing an effective network infrastructure. It’s imperative to note that the complexity of networks differ but still with a general framework in place helps to make correct choices [3] [4].The following steps are to be followed when designing a network as
3.3.1. Identify the Requirements
Before any network design, gathering network requirements is an important exercise. Without clearly defining requirements, it leads to the design falling apart which would lead to having an inefficient performing network. Requirements assist with what needs to be done [12].
3.3.2. Assess the Current State of the Network
This will call for minor adjustments but if the cabling for instance is Cat5 cable and you need Cat6A to support 10GBaseT, the existing cabling now becomes an issue to deal with. Whatsoever the state of the network is, it’s important to find out early the current network state before coming up with any specific recommendation in terms of network design [12].
3.3.3. Design Your Network Topology
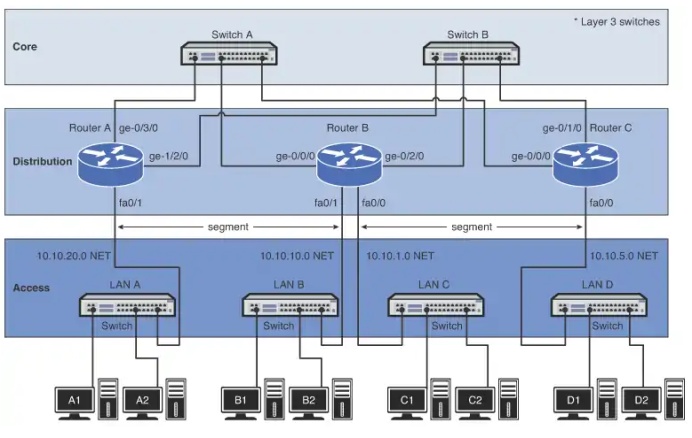
Once the requirements are established and you understand the current state of your network, you can start blocking out the functional components of the network. This is where the physical and logical network design is considered. For physical network design, one should consider things like running fiber and copper cabling, type of switches and ports required, positioning of Wi-Fi access point, and cabling type between network racks just to mention but a few. Logical network design should consider IP addressing/subnetting, VLANs, Data flows, and topology of the network [12]. The two main network design concepts are hierarchical network layers and top-down vs bottom-up design. A traditional hierarchical network design is based on the idea of three basic network layers. This is the most common [13]. Each layer handles a separate portion of the dataflows on a network. The layers are Core (The core layer is the backbone of the hierarchy network. The primary transmission and routing of data signals take place at the core layer only) [14], Distribution (The main responsibility of these switches is to ensure the routing of data to correct devices in the access layer. However, the distribution layer handles maximum data traffic as the data packets are pushed through the core layer to the distribution layer) [14] and the Access layer (The access layer is the layer for endpoint devices like user PCs, printers, and VoIP phones) [12] as shown in the diagram below.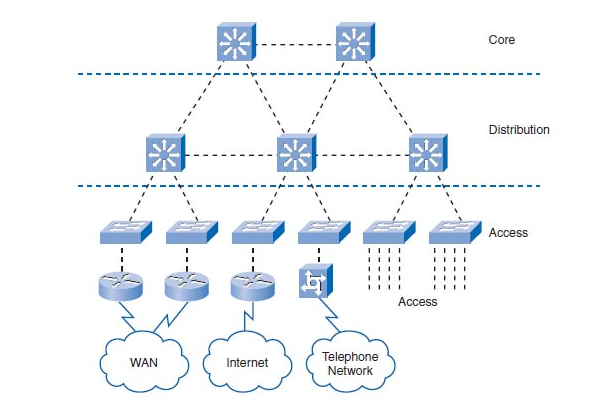 | Figure 5. A traditional hierarchical network design [15] |
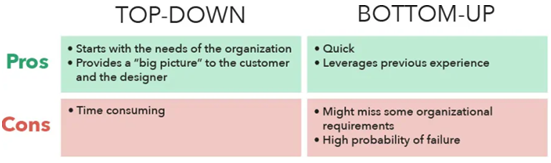
However, in some cases, you may not need all three layers because some networks bypass the distribution layer altogether [12]. The other approaches to network designs are top-down and bottom-up designs which are based on the OSI model. Below is a table displaying a summary of the two approaches.Table 1. Top – Down Vs Bottom – Up Network Design Approach [16]
 |
| |
|
3.3.4. Choose the Hardware and Software
This involves finding out the hardware and software to be used for the network. This can also be done in parallel with the design of the network topology. At this stage, one selects specific cables, switches, applications, servers, etc. to make the design a reality [5].
3.3.5. Plan for Implementation and Beyond
With your network design and hardware/software selections ready, you can now plan for the implementation and beyond. This involves coming up with a way of deploying, configuring, and testing the network [11].With your network design and hardware/software selections ready, you can now plan for the implementation and beyond. This involves coming up with a way of deploying, configuring, and testing the network [5].
4. Research Methodology
For data collection, the study harnessed the power of the OPNET Tool Modeler 14.5 Release. This robust tool was meticulously employed to address the primary research inquiries, leveraging its capabilities to simulate and gather pertinent information integral to the study.Following data collection, the acquired datasets underwent meticulous analysis. These datasets were meticulously processed and evaluated using Microsoft Excel, facilitating a structured examination of the results obtained from the simulations. This analysis was crucial in extracting meaningful insights and comprehensively presenting the study's findings. During the simulation, the metrics measured were HTTP response time, IP Traffic Dropped, Packet End-To-End Delivery, LAN Delay/Latency, Video Conferencing: Traffic Received, and Voice Traffic Received. OPNET tool was used for the simulations. To comprehensively assess performance metrics, a series of distinct network design scenarios were meticulously crafted. Within these scenarios, specific metrics were precisely selected, each undergoing thorough evaluation. This deliberate approach ensured a focused analysis, allowing for a nuanced understanding of how varying network configurations impacted individual metrics. By systematically examining diverse scenarios, the study aimed to capture a comprehensive spectrum of network performance behaviours, facilitating a robust and insightful assessment of the selected metrics.
4.1. Research Methodology Process
In this sub-section, the strategy was to describe a general plan about how the researcher intended to answer the key questions relating to the study. The study undertook five (5) scenarios as indicated below in Figure 3. The results of the research were then analysed, validated, and documented. The model was developed using the following process shown in Figure 3. Research Methodology Process.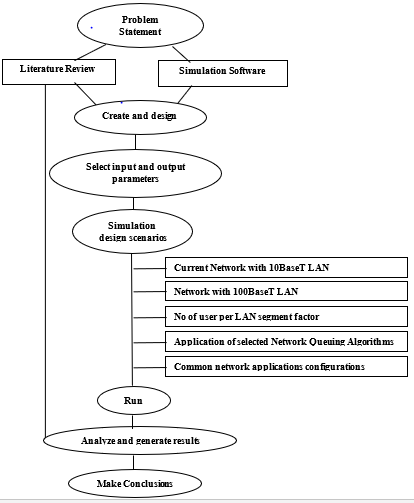 | Figure 6. Research Methodology Process |
4.2. Network System Design
The network topology was established by structuring the LAN into distinct subnets, specifically Servers, Administration, Computer Labs, Workrooms, and Accounts. These subnets were interconnected to a central hub subnet, housing a server linked via either a 100baseT or 10Gbps connection, facilitating comparison across different scenarios. Within the server subnet switch, an array of five server types; Video, Voice, File, Database, FTP, Email, and HTTP were connected to support various functionalities.Each subnet accommodated a varying number of users or clients. The configuration of network clients involved meticulous setup encompassing application configs, profile configs, and IP QoS configuration objects. Across the subnets, applications like HTTP and Email were configured to handle low loads specifically for the computer lab, while the other subnets were optimized for heavy loads across all running applications.Ethernet workstations within the Base10T and Base100T LANs were configured to direct HTTP, video, email, and voice traffic towards designated servers. Potential bottleneck links between switches were managed using IP QoS configuration objects to ensure optimal routing of network traffic toward their respective destinations. Critical bottleneck network switch links were implemented with FIFO, WFQ, and PQ queuing algorithms for efficient traffic management.The number of users for each subnet varied: Administration had 10 users, Computer Labs had 30, Workrooms had 50, and Accounts had 100 users. The comprehensive topology included servers, an IP cloud, Gateway Router (Ethernet4_slip8_gtwy), 100BaseT LAN, 10BaseT LAN, Applications configs, Profiles configs, QoS Attribute configuration, 10BaseT Link, 100BaseT Link, 10Gbps Link, and PPP_DS3 link. Below is an OPNET Parent Design Model Setup for the network.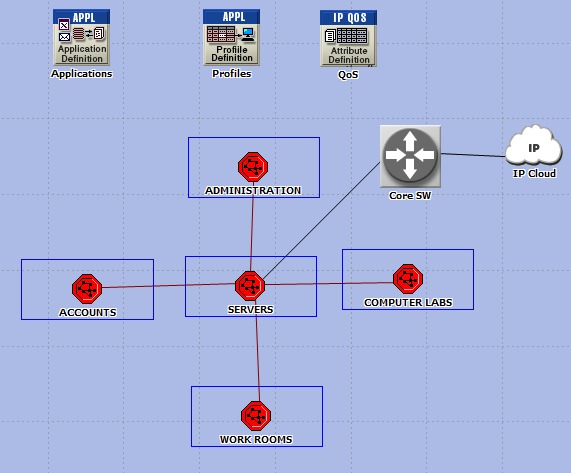 | Figure 7. Parent Design Model Setup |
4.3. OPNET
OPNET is preferred for LAN designs to enhance network quality and performance through its capabilities in realistic simulation, detailed performance analysis, evaluation of Quality-of-Service mechanisms, scenario testing, and effective visualization of results. Its comprehensive features empower engineers and researchers to optimize LAN configurations, identify bottlenecks, and make informed decisions for superior network functionality.
4.3.1. Simulation Setup
In this study, the server switch below is connected to the parent Server subnet in Figure 7 above. The server switch has various types of servers connected to it which are accessed by specific LAN clients for specific purposes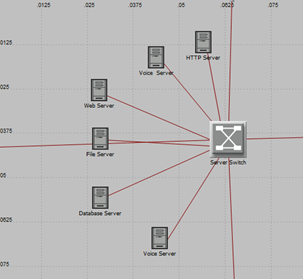 | Figure 8. Server Switch Segment |
Below is another setup diagram for the 100BaseLAN setup. The 100BaseT LAN is connected through a switch which is connected from the parent subnets in figure 7.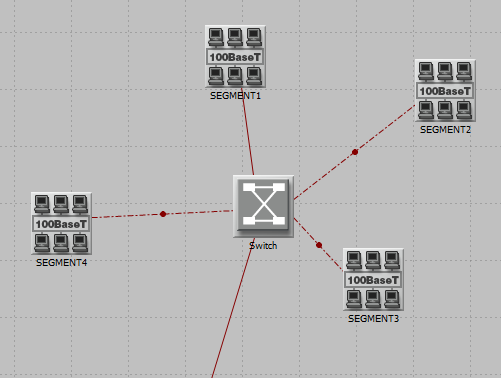 | Figure 9. 100baseLAN Setup |
In addition, below there is a 10BaseT LAN setup diagram. The 10BaseT LAN is connected through a switch which is connected from the parent subnets in figure 7.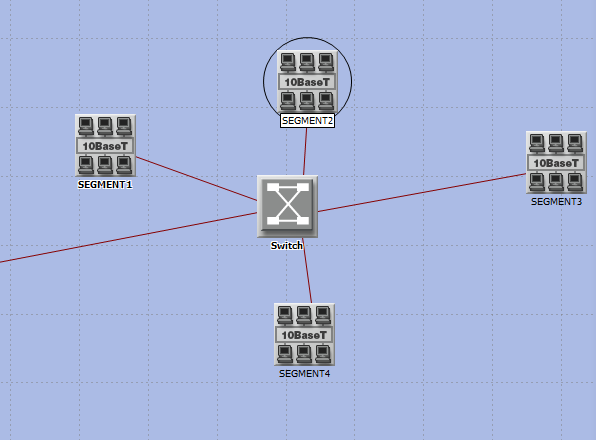 | Figure 10. 100BaseLAN setup |
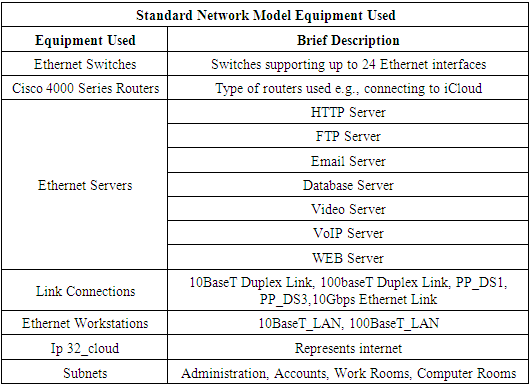
The following are some of the OPNET model equipment used.Table 2. Standard Network Model Equipment Used
 |
| |
|
5. Results and Discussion
In this subsection, we present and discuss the results of OPNET simulations obtained using the method that was described earlier under the subtitle Research Methodology. The results and discussions section of this report delves into crucial performance metrics analyzed through an OPNET simulation. It comprehensively explores Response Time, IP Traffic Dropped, Packet End-to-End Delivery, LAN Delay/Latency, Video Conference Traffic Received, and Voice Traffic Received. Each metric provides valuable insights into network performance, shedding light on aspects like server response, packet drops, queuing mechanisms, end-to-end delivery, LAN segment performance, and the traffic patterns of video and voice data. The analysis showcases trends, variations, and implications for Quality of Service (QoS), enabling a deeper understanding of network behaviour and highlighting the impact of different factors on network performance. The obtained data were exported to Microsoft Excel for additional analysis and comparative discussion using graphs.
5.1. Response Time
In this subsection, we present and discuss the results of OPNET simulations obtained using the method that was described earlier under the subtitle Research Methodology. The results and discussions section of this report delves into crucial performance metrics analysed through an OPNET simulation. It comprehensively explores Response Time, IP Traffic Dropped, Packet End-to-End Delivery, LAN Delay/Latency, Video Conference Traffic Received, and Voice Traffic Received. Each metric provides valuable insights into network performance, shedding light on aspects like server response, packet drops, queuing mechanisms, end-to-end delivery, LAN segment performance, and the traffic patterns of video and voice data. The analysis showcases trends, variations, and implications for Quality of Service (QoS), enabling a deeper understanding of network behaviour and highlighting the impact of different factors on network performance.The x-axis (horizontal) represents time, whereas the labels on the y-bar denote throughput (vertical) bits per second.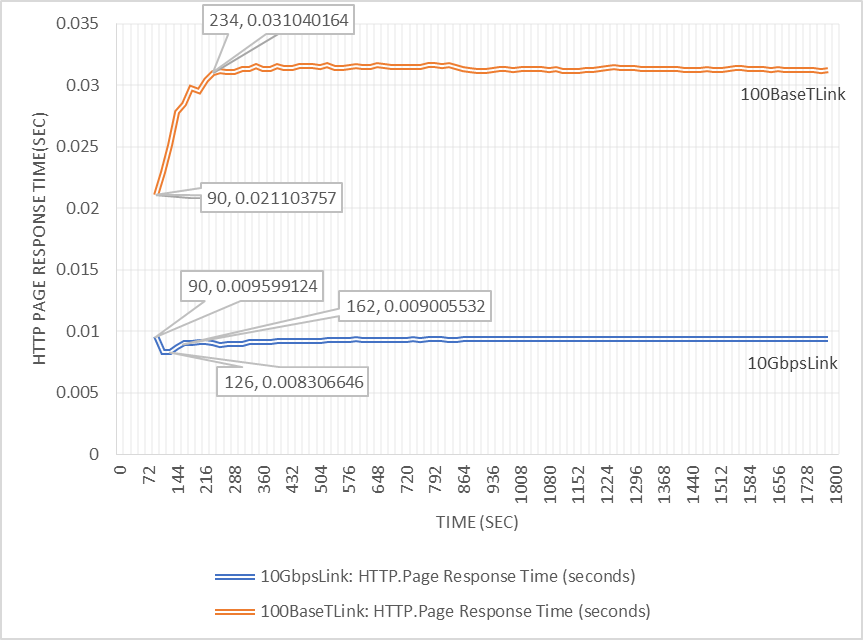 | Figure 11. HTTP Page Response Time (Sec) |
Figure 11 depicts the HTTP page response time for two different links, 10Gbps and 100BaseT Link, measured in seconds. The x-axis represents time in seconds, while the y-axis represents HTTP page response time in seconds. For the 10Gbps link, the graph shows a decrease in HTTP page response time from 0.009599124 to 0.008306646 seconds as the network connection is established. However, the processing time increases from 90 to 126 seconds. There is a subsequent increase in response time to 0.009005532 seconds, and processing time increases from 126 to 162 seconds. After 162 seconds, the graph remains almost flat.For the 100BaseT Link, the HTTP page response time rises from 0.021103757 to 0.031040164 seconds, and the processing time increases from 90 to 234 seconds. After 234 seconds, the graph becomes almost flat.Interpreting of the HTTP page response time results:i) Performance Measurement: HTTP page response time is a crucial metric for assessing server performance and network quality of service. It reflects the time taken to retrieve the entire page with all its inline objects.ii) 10Gbps Link vs. 100BaseT Link: The 10Gbps link exhibits lower HTTP response times (0.008306646 seconds) compared to the 100BaseT Link (0.031040164 seconds). This suggests that the 10Gbps link has better network performance and provides a higher quality of service in terms of HTTP response time.iii) Graph Trends:• Upward Trends: When the graph rises over time, it indicates an increase in HTTP response time. This could be due to more clients/users attempting to communicate simultaneously, leading to network traffic, potential bottlenecks, and increased latency.• Flat Trends: A generally flat graph suggests consistent processing without traffic or queue problems. This is indicative of a well-managed server and network, resulting in a stable HTTP response time.• Drops in Graph: A slight drop during a steady state implies sufficient network capacity, and the server is processing requests without encountering queue errors.The implications are that for:• 10Gbps Link: The lower HTTP response time suggests better network performance, making it more suitable for handling simultaneous communication from multiple clients.• 100BaseT Link: The higher response time indicates potential traffic congestion due to the smaller bandwidth, making it less capable of supporting a large volume of traffic simultaneously.In summary, the 10Gbps link demonstrates superior performance with lower HTTP response times, while the 100BaseT Link shows limitations in handling simultaneous traffic, resulting in higher response times.
5.2. IP Traffic Dropped
This refers to a reduction in the amount of data transmitted and received over the network using Internet Protocol (IP). Packet loss, where data packets fail to reach their destination, can lead to performance issues in digital communication. Packet loss occurs when one or more transmitted data packets fail to arrive at their destination. This can cause a noticeable performance issue for all types of digital communication [2]. Packet loss occurs when network congestion, hardware issues, software bugs, and several other factors cause dropped packets during data transmission [3].As defined by the OPNET simulation software in this case, it is the number of IP datagrams dropped by all nodes in the network across all IP interfaces. The reasons for dropping an IP datagram can be caused by insufficient space in the central processor's queue, insufficient space in a slot processor's buffer (only when slot-based processing is enabled), the maximum number of hops exceeded by an IP datagram on non-routing nodes, for destinations that are more than one hop away, a local router interface was not found to be used as the next hop, or the route table lookup failed to yield a route to the destination. The labels on the x-axis (horizontal) show the time taken in seconds, while the labels on the y-axis (vertical).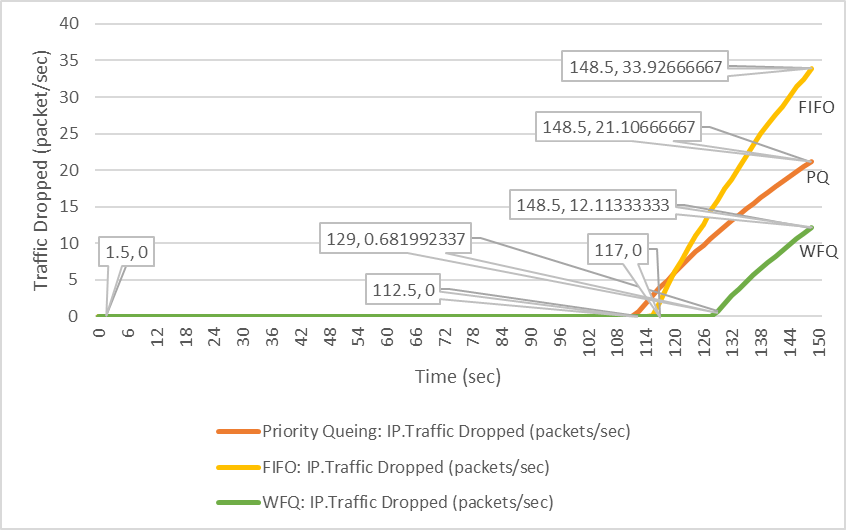 | Figure 12. IP Traffic Dropped |
Figure 12 shows that the PQ graph started to rise when the network connection was established, taking time from 0 to 112.5 seconds, and by then no traffic had dropped. From 112.5 to 148.5 seconds processing time, the "traffic dropped" in packets per second rose to 21.10666667 from 0. For FIFO, the graph started to rise when the network connection was established, which took time from 0 to 117 seconds, and by then no traffic had dropped. From 117 to 148.5 seconds processing time, the "traffic dropped" in packets per second rose to 33.92666667 from 0. For WFQ, the graph started to rise when the network connection was established, which took time from 0 to 129 seconds. From 129 to 148.5 seconds processing time, the traffic dropped in packets per second rose from 0.681992337 to 12.11333333.Interpreting of the IP Traffic Dropped results:The findings from the OPNET simulation research indicated that the network experienced IP traffic drops. In the simulation, IP traffic drops were measured by the number of IP datagrams dropped by all nodes in the network across all IP interfaces. Various factors contributed to packet drops, such as insufficient space in the processor's queue, buffer limitations, exceeded hop limits, unavailability of a local router interface, or route table lookup failures.The simulation results, represented in Figure 12, show the IP traffic drop trends for different queuing mechanisms: PQ (Priority Queuing), FIFO (First-In-First-Out), and WFQ (Weighted Fair Queuing). The x-axis represents the processing time, and the y-axis shows the rate of traffic dropped in packets per second.Observations from the graph:i) PQ (Priority Queuing):• The PQ graph showed no traffic drop initially.• From 112.5 to 148.5 seconds, the traffic drop increased to 21.10666667 packets per second.ii) FIFO (First-In-First-Out):• The FIFO graph had no traffic drop at the beginning.• From 117 to 148.5 seconds, the traffic drop increased to 33.92666667 packets per second.iii) WFQ (Weighted Fair Queuing):• The WFQ graph started rising after the network connection was established (0 to 129 seconds).• From 129 to 148.5 seconds, the traffic drop increased from 0.681992337 to 12.11333333 packets per second.FIFO had the highest data traffic drop, followed by PQ, and WFQ had the lowest. WFQ's fairness in resource allocation among different flows and its dynamic adjustment of service charges contribute to a more equitable traffic management approach, reducing the likelihood of high-priority traffic dropping lower-priority traffic.The steepness of the curves in the graph reflects the severity of traffic drops. Steeper curves imply more significant packet drops, which can result from network congestion, insufficient bandwidth, outdated infrastructure, or other factors. The increased dropped packets as observed caused.• Reduced Quality of Service: Increased dropped packets can lead to degraded performance, especially in real-time applications like video streaming or VoIP, causing disruptions and delays.• Network Congestion: It could indicate that the network infrastructure or configurations might not effectively handle the incoming traffic load, resulting in congestion.• Performance Bottlenecks: Processing delays or insufficient resources (buffer, CPU) could be causing packets to be dropped, impacting overall network performance.
5.3. Packet End-To-End Delivery
The time interval between the creation of a packet at the source and its reception at the destination is referred to as packet end-to-end delay. This duration signifies the time taken for a packet to traverse the network. The unit of measurement for this time is seconds. Various types of delays contribute to this overall delay, including processing delay (Dproc), queuing delay (Dqueue), transmission delay (Dtrans), and propagation delay (Dprop). Mathematically, it is represented by the following equation. The dependability of a network is indicated by a routing protocol with the least amount of latency. This metric holds significance in delay-sensitive applications such as video conferencing, video streaming, and voice transmission. | (1) |
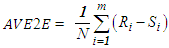 (Ahmed, Ebrahim, & Khalifa, 2020)In another study, it was explained that the End-to-End Delay of each packet is the cumulative result of delays experienced at a sequence of intermediate nodes on the way to the destination. Each delay consists of two components: a fixed part, such as transmission delay and propagation delay, and a variable part, including processing delay and queuing delay at the nodes [2]. The packet end-to-end delivery in the OPNET simulation software refers to the time taken to transmit a video application packet to a destination node's application layer. It captures data from all nodes in the network. The metric is crucial for delay-sensitive applications, such as video conferencing and streaming. The DE2EI equation above mathematically represents this delay, emphasizing the importance of routing protocols with minimal latency for network dependability.The labels on the x-axis represent the time taken in seconds, while the labels on the y-axis show throughput in bits
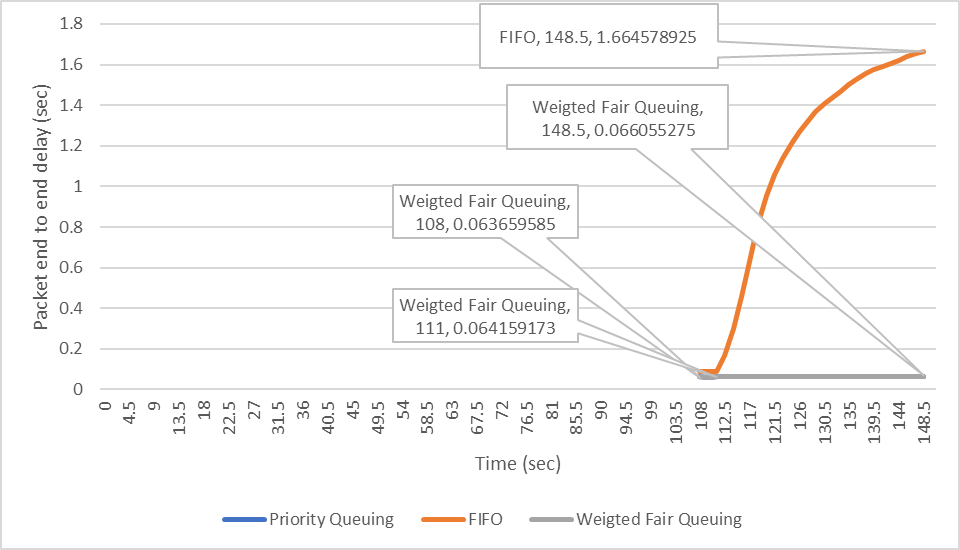 | Figure 13(a). Packet End-To-End Delivery |
 | Figure 13(b). Packet End-To-End Delivery |
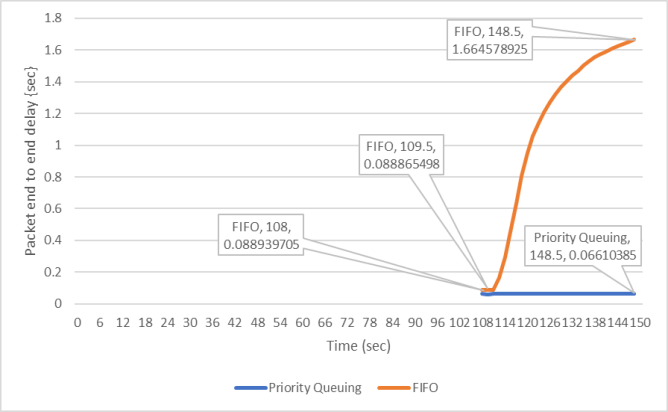
Figure 13(a) and (b) show that all the QoS graphs took 0 to 108 seconds to establish a connection. According to the data, the FIFO graph's packet end-to-end delay in seconds rose from 0.088939705 to 1.664578925 seconds, while its processing time increased from 108 to 148.5 seconds. The Priority queuing rose slightly from 0.063659585 to 0.06610385 seconds between the processing time of 108 to 148.5 seconds. For the Weighted Fair Queuing graph, the packet end-to-end delay in seconds slightly rose from 0.063659585 to 0.066055275 seconds between a processing time of 108 to 148.5 seconds.Interpreting of the Packet End-To-End Delivery results:Figure 14 presents QoS graphs for different queuing mechanisms (FIFO, Priority Queuing, and Weighted Fair Queuing) from 108 seconds to 148.5 seconds. The analysis identifies key patterns:i) Rising Curves and Network Load:The QoS graphs in Figure 14(a) and (b) illustrate that all connections took 0 to 108 seconds to establish. When the graphs advance from 108 seconds to 148.5 seconds, a rising curve indicates an increase in network load. This rise in delay suggests that packets experience heightened latency, waiting in queues during congestion. Factors like transmission, propagation, nodal, and queuing delays for flows with lower weights and priority contribute to higher packet end-to-end delays.ii) Flat Curves and Consistent Performance:Conversely, a relatively flat curve in the graph signifies consistent end-to-end delay across all network load levels. This suggests consistent performance even as the network load increases, potentially due to some flows having higher weights or high-priority traffic. This indicates a level of stability and predictability in performance under varying network loads.iii) Comparison of Queuing Mechanisms:The analysis of different queuing mechanisms reveals insights into their performance:• FIFO Queuing: The graph indicates a substantial increase in packet end-to-end delay, rising from 0.088939705 to 1.664578925 seconds. This queuing mechanism proves less effective in achieving the required network performance and QoS.• Priority Queuing: Despite a slight increase from 0.063659585 to 0.06610385 seconds, priority queuing demonstrates relatively lower delays, making it a favourable option compared to FIFO.• Weighted Fair Queuing (WFQ): Both WFQ and Priority Queuing initially show the lowest delay of 0.063659585 seconds at 108 seconds processing time. However, at 148.5 seconds, WFQ exhibits the lowest delay of 0.066055275 seconds, making it the preferred choice on average. This highlights WFQ's effectiveness in achieving good network performance and QoS by allocating weighted resources to different flows, allowing fine-tuning and control of delays.
5.4. LAN Delay/Latency
Delay refers to the time taken for a packet to be processed within a computer network, encompassing processing, queuing, transmission, and propagation delays [6]. In the context of a local area network (LAN), latency represents the time for a data packet to traverse from its source to its destination within the LAN. Others refer to it as the time delay experienced by data packets while traversing a local area network from source to destination. It primarily includes propagation delay (signal travel time through the medium) and processing delays within network devices [7] [8]. This metric is typically measured in milliseconds (ms) or microseconds (μs) owing to the inherently low latencies within LANs, attributable to their limited geographical scope.The study conducted a comparison, in seconds, across three (3) LAN segments: The Accounts office with 100 users in the subnet, the Administration office with 10 network users, and the Work rooms offices with 50 users. Figure 14 showcases the results obtained from the OPNET simulation. The x-axis denotes processing time in seconds, while the y-axis represents the delay in seconds.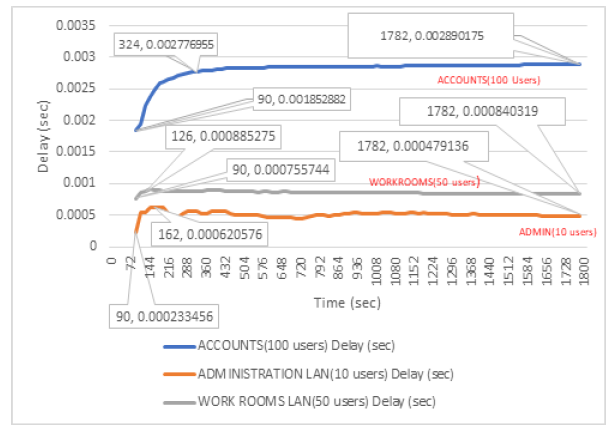 | Figure 14. LAN Delay/Latency |
Figure 14 illustrates that all LAN delay graphs, measured in seconds, took 0 to 90 seconds to establish a connection. For the Administration block with ten (10) users, the average LAN delay increased from 0.000233455532 to 0.000620576033 seconds as the maximum delay, while processing time escalated from 90 to 162 seconds. Following 162 to 1782 seconds of processing time, the LAN delay gradually decreased to its lowest value of 0.000479135543 at 1782 seconds.Regarding the Workrooms block with fifty (50) users, the average LAN delay rose from 0.000755743636 to 0.000885275112 seconds, and processing time increased from 90 to 126 seconds. Subsequently, after 126 to 1782 seconds of processing time, the LAN delay slightly increased before gradually reducing to a value of 0.000840318716 at 1782 seconds.In the case of the Accounts block with one hundred (100) users, the average LAN delay increased from 0.001852881895 to 0.002776954801 seconds, and processing time rose from 90 to 342 seconds. From 342 to 1782 seconds of processing time, LAN delay exhibited a slow increment until it reached its highest value of 0.002890174642 at 1782 seconds.Interpretation of the LAN delay or latency results:The OPNET simulation research findings delved into the dynamics of LAN delay or latency across different scenarios within a local area network, evaluating its impact on network performance and Quality of Service (QoS). The interpretation of the results is:i) LAN Delay Measurement:• LAN delay, characterized by the time taken for data packets to travel from source to destination within the LAN, was assessed across three segments: Accounts office (100 users), Administration office (10 users), and Workrooms offices (50 users).• The measured delay values ranged from microseconds to a few milliseconds, indicating relatively low latencies typical of LANs due to their limited geographical range.ii) Variations in LAN Delay with User Load:• The study illustrated how LAN delay changes concerning the number of users and the resulting traffic load.• As the number of users increased within each segment, the average LAN delay exhibited specific patterns in response to the workload.iii) LAN Delay Trends:• Administration Block (10 users): With a gradual increase in processing time from 90 to 162 seconds, LAN delay initially rose but gradually reduced, indicating efficient traffic handling after a temporary bottleneck.• Workrooms Block (50 users): A similar trend occurred, with a slight rise in LAN delay following increased processing time. However, it eventually reduced, highlighting effective traffic management despite the increased load. • Accounts Block (100 users): This segment experienced a more significant increase in LAN delay as processing time extended from 90 to 342 seconds, suggesting potential congestion or limitations in handling the increased workload.Implications of LAN Delay Trends:• Increasing Delay: Indicates potential traffic congestion, leading to longer delays, which could impact real-time applications, causing latency issues and degraded service quality.• Decreasing Delay: Suggests efficient network management, enabling smoother communication and faster response times, especially for real-time applications.• Constant Delay: Reflects stable network performance despite increased user activity, indicating a robust architecture capable of maintaining consistent service quality and predicting response times regardless of user fluctuations. This stability hints at the network's potential for scalability and sustained performance.Overall, the findings emphasize the critical role of LAN delay as a metric for assessing network performance. They highlight how variations in user load can impact delay, influencing network congestion and the overall user experience, and underscore the importance of efficient traffic management for optimal network performance and QoS maintenance.
5.5. Video Conference: Traffic Received (Bytes/Sec)
Traffic received (bytes/sec) denotes the rate at which data is received by a network interface or device, commonly expressed in bytes per second. It quantifies the volume of incoming data directed toward a specific destination, such as a server, computer, or any network-enabled device. This metric is pivotal for monitoring network performance, evaluating bandwidth utilization, and determining data transfer rates, especially in activities like capacity planning, network optimization, or diagnosing network issues [4]. For instance, tracking the influx of data in bytes per second through a network interface aids administrators in comprehending the quantity and speed of data entering a system. In the context of video conferencing, as defined by the OPNET simulation software, "traffic received" signifies the average bytes per second forwarded to all video conferencing applications by the transport layers within the network.The study conducted a comparison of Video traffic received in bytes per second using three (3) QoS scheduling techniques: PQ, WFQ, and FIFO. Figure 15 illustrates the results derived from the OPNET simulation. The x-axis (horizontal) represents time in seconds, while the y-axis denotes the Video traffic received in bytes per second.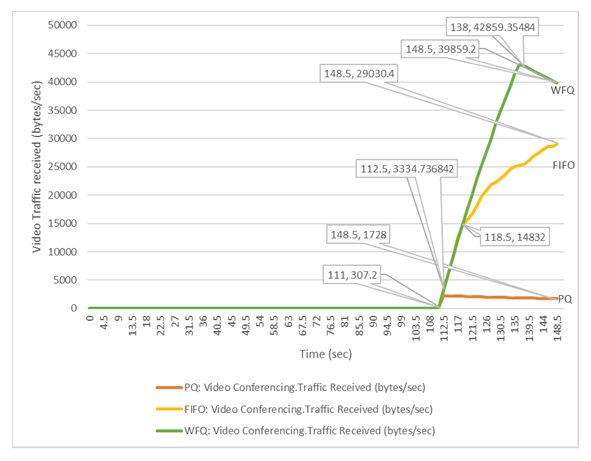 | Figure 15. Video Conference: Traffic Received (Bytes/Sec) |
Figure 15 displays graphs illustrating the video traffic received in bytes per second, indicating an initial rise following the establishment of the network connection, spanning from 0 to 111 seconds. Specific details from the presented data include:• WFQ: Video traffic received increased from 307.2 to 42859.35484 bytes per second between 111 and 138 seconds. Subsequently, it experienced a slight drop from 42859.35484 to 39859.2 bytes per second between 138 and 148.5 seconds.• FIFO: The video traffic received rose from 153.6 to 29030.4 bytes per second within 111 to 148.5 seconds.• PQ: Traffic increased from 307.2 to 3334.736842 bytes per second between 111 and 112.5 seconds, followed by a decrease to 1728 bytes per second between 112.5 and 148.5 seconds.Interpretation of the Video Conference: Traffic received (bytes/sec) results:The OPNET simulation research findings delve into the dynamics of Video Conference across different scenarios within a local area network, evaluating its impact on network performance and Quality of Service (QoS):i) Increase in Video Traffic Received:• FIFO: Suggests straightforward traffic handling, with surges indicating increased data or queued backlog.• PQ: Indicates priority changes or elevated high-priority video traffic.• WFQ: Implies fair resource allocation or increased video traffic weight for bandwidth share.ii) Decrease in Video Traffic Received:• FIFO: Might signal reduced data transmission or altered data type proportions.• PQ: Indicates a lowered priority for video packets, leading to decreased transmission.• WFQ: Could suggest reduced weight or resource allocation for video traffic.iii) Constant Video Traffic Curve:• FIFO: Shows consistent video packet handling without major fluctuations.• PQ: Indicates stable priority levels despite varying network traffic.• WFQ: Implies consistent resource allocation for video traffic.Observations:WFQ presented the highest video traffic received (42859.35484 bytes per second), followed by FIFO (29030.4 bytes per second) and PQ (3334.736842 bytes per second). Hence, in this context, WFQ showcased superior network performance in terms of video traffic received, a pivotal metric influencing Quality of Service (QoS) and network performance evaluation.
5.6. Voice Conference: Traffic Received (Bytes/Sec)
Voice traffic received (bytes/sec) refers to the rate at which voice data packets are received by a network interface or device, typically measured in bytes per second. This metric specifically pertains to the amount of data transmitted over a network carrying voice communication, usually facilitated by protocols like VoIP (Voice over Internet Protocol). Unlike traditional data traffic, voice traffic is time-sensitive and demands real-time transmission to ensure clear and uninterrupted communication. When measuring voice traffic received in bytes per second, it reflects the flow of data associated with voice packets arriving at a destination within a specified time frame [5]. The OPNET simulation software defines Voice traffic received (bytes/sec) as the average number of bytes per second forwarded to all Voice applications by the transport layers within the network. The study compares Voice traffic received in bytes per second across three QoS scheduling techniques: PQ, WFQ, and FIFO. Figure 4.6 illustrates the results obtained from the OPNET simulation, with the x-axis displaying time in seconds and the y-axis representing the Voice traffic received in bytes per second.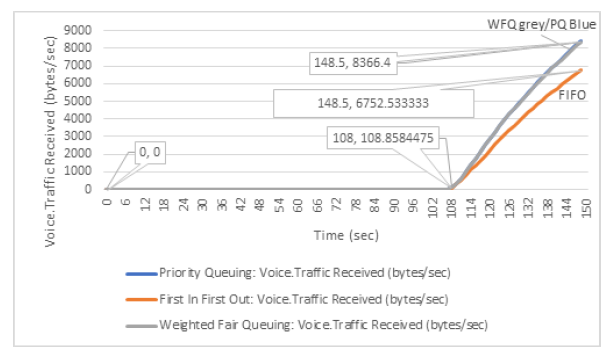 | Figure 16. Voice Traffic Received (Bytes/Sec) |
Figure 16 illustrates that all graphs depicting voice traffic received in bytes per second began their ascent when the network connection was established, taking from 0 to 108 seconds. Both WFQ and PQ exhibited closely similar trends. According to the data, WFQ's voice traffic received in bytes per second rose from 108.8584475 to 8366.4 within 108 to 148.5 seconds. Similarly, FIFO's voice traffic received in bytes per second increased from 100.8219178 to 6752.533333 within the same time frame. PQ's traffic received in bytes per second rose from 108.8584475 to 8430.4 within 108 to 145.5 seconds.Interpretation of the Voice traffic received (bytes/sec) results:This research, conducted through OPNET simulation, focuses on Voice Traffic Received (bytes/sec) and its implications on network performance, particularly concerning Quality of Service (QoS). By comparing three QoS scheduling techniques; PQ, WFQ, and FIFO. Figure 16 visually depicts the trends associated with Voice Traffic Received in bytes per second over time.The findings reveal compelling insights into how these QoS techniques affect Voice Traffic Received: i) Notable increases in Voice Traffic Received across different scheduling techniques indicate varying trends: FIFO's rise suggests a surge in voice packet transmission, PQ's increase hints at altered packet priority, and WFQ's uptick signifies potential resource allocation or weight changes favouring voice traffic.ii) Conversely, decreases in Voice Traffic Received imply declines in transmission: FIFO's drop may suggest reduced transmission of voice data, while PQ and WFQ reductions might point towards lowered priority or resource allocation for voice traffic.iii) Consistent curves in Voice Traffic Received signify stable handling over time: FIFO and PQ show steady flows, while WFQ maintains consistent resource allocation for voice traffic.Observations from the data highlight PQ's superior performance in Voice Traffic Received, registering the highest volume at 8430.4 bytes per second, closely followed by WFQ at 8366.4 bytes per second. Despite marginal differences, these findings underscore PQ's effectiveness in managing voice traffic, thereby influencing network QoS and performance assessment.
6. Future Scope and Conclusions
In conclusion, the comprehensive analysis conducted through OPNET simulations provides a detailed understanding of the nuanced dynamics defining network performance and Quality of Service (QoS) within a Wired Local Area Network (LAN). Through the examination of crucial metrics such as Response Time, IP Traffic Dropped, Packet End-to-End Delivery, LAN Delay/Latency, and the reception of Video Conference and Voice Traffic, this study unravels insights crucial for optimizing network functionality.The assessment of Response Time highlights the stark disparity between the 10Gbps and 100BaseT links, underscoring the profound impact of bandwidth on network responsiveness. IP Traffic Dropped analysis not only elucidates the nuances of various queuing mechanisms but also unveils their influence on traffic management, quality, and potential bottlenecks.Packet End-to-End Delivery evaluation accentuates the significance of different queuing mechanisms in shaping network performance, emphasizing Weighted Fair Queuing's prowess in balancing traffic allocation. LAN Delay/Latency measurements across diverse segments unveil crucial patterns, emphasizing the sensitivity of network performance to user load and traffic variation.Meticulous scrutiny of Video Conference and Voice Traffic reception underscores the role of QoS techniques in managing different data types, with WFQ demonstrating superiority in handling Video Traffic and the PQ technique excelling in managing Voice Traffic.While this comprehensive analysis serves as a compass for network administrators and stakeholders, guiding them toward strategies for elevating QoS, mitigating congestion, and fortifying the network infrastructure, it is crucial to acknowledge the potential for further improvement. Areas for future research or potential extensions of the current study should explore additional simulation scenarios analogous to larger real-life network scenarios. This investigation will ascertain whether the same conclusions can be made and delve into enhancing the performance of wireless local areas, providing a more comprehensive understanding of network dynamics for future challenges.
References
| [1] | DCS Technologies inc, "network-infrastructure-design," 2015. [Online]. Available: https://www.dcstech.ca/network-infrastructure-design.html. [Accessed 1 June 2022]. |
| [2] | Cisco Press, "Analyzing the Cisco Enterprise Campus Architecture," 15 July 2010. [Online]. Available: https://www.ciscopress.com/articles/article.asp?p=1608131&seqNum=3. |
| [3] | Cisco Certified Expert, "network-design-methodology," 14 November 2022. [Online]. Available: https://www.ccexpert.us/network-design/network-design-methodology.html. |
| [4] | Network Direction, "Network Lifecycle," 2022. [Online]. Available: https://networkdirection.net/articles/network-theory/networklifecycle/. |
| [5] | Researchgate, "Network Development Life Cycle (NDLC) Mode," 2018. [Online]. Available: https://www.researchgate.net/figure/Network-Development-Life-Cycle-NDLC-Model_fig1_329489108. |
| [6] | S. Petryschuk, "Network Design and Best Practices," 7 April 2021. [Online]. Available: https://www.auvik.com/franklyit/blog/network-design-best-practices/. [Accessed 2 June 200]. |
| [7] | N-able, "Network Planning and Design," 4 January 2019. [Online]. Available: https://www.n-able.com/blog/how-to-design-a-network. [Accessed 1 June 2022]. |
| [8] | Lazorpoint, "Network Infrastructure Design & Implementation," 2022. [Online]. Available: https://www.lazorpoint.com/solutions/network-infrastructure-design. [Accessed 10 July 2022]. |
| [9] | CS Odessa Corp, "Local area network (LAN). Computer and Network Examples-Network Diagrams," 1993 — 2022. [Online]. Available: https://www.conceptdraw.com/examples/local-area-network-diagram. [Accessed 3 June 2022]. |
| [10] | Cisco Systems, Inc, "www.cisco.com," 2022. [Online]. Available: https://www.cisco.com/c/en/us/td/docs/voice_ip_comm/cucme/srnd/design/guide/cmesrnd/nstrct.html. [Accessed 1 June 2022]. |
| [11] | Network Encyclopedia, "Network Infrastructure Design – Planning a Campus Network," 2022. [Online]. Available: https://networkencyclopedia.com/network-infrastructure-design/. |
| [12] | S. Petryschuk, "Network Design and Best Practices," 7 April 2021. [Online]. Available: https://www.auvik.com/franklyit/blog/network-design-best-practices/. |
| [13] | L. Popa, "Hierarchical Network Design," 21 July 2021. [Online]. Available: https://www.auvik.com/franklyit/blog/hierarchical-network-design/. |
| [14] | Versitron, "use-of-core-switches-distribution-switches-and-access-switches," 2022. [Online]. Available: https://www.versitron.com/whitepaper/use-of-core-switches-distribution-switches-and-access-switches. |
| [15] | Fiber Cabling Solution, "core-switch-vs-distribution-switch-vs-access-switch," 20 September 2018. [Online]. Available: https://www.fiber-optic-cable-sale.com/core-switch-vs-distribution-switch-vs-access-switch.html. |
| [16] | Team Nuggets, "Top-down vs. Bottom-up Network Design," 11 January 2016. [Online]. Available: https://www.cbtnuggets.com/blog/technology/networking/top-down-vs-bottom-up-network-design. |
| [17] | B. Sentala, C. S. Lubobya and A. Zulu, "Performance Evaluation and Compression of IP Packets in a Wireless Local Area Network (WLAN)," Journal of Wireless Networking and Communications, vol. 11, no. 1, pp. 1-10, 2022. |
| [18] | T. Simon and B. Baruch, "Performance Evaluation of Buffer Size for Access Networks in First Generation Optical Networks," International Journal of Internet of Things, vol. 6, no. 3, pp. 98-105, 2017. |

 Abstract
 Reference
 Full-Text PDF
 Full-text HTML