-
Paper Information
- Paper Submission
-
Journal Information
- About This Journal
- Editorial Board
- Current Issue
- Archive
- Author Guidelines
- Contact Us
International Journal of Networks and Communications
p-ISSN: 2168-4936 e-ISSN: 2168-4944
2019; 9(1): 37-52
doi:10.5923/j.ijnc.20190901.03

Performance Comparison between O- and C-bands Optical Carrier-Assisted Nyquist Half-Cycle SSB Communication Systems
 Abstract
 Reference
 Full-Text PDF
 Full-text HTML
Mays M. Ibrahim, Raad S. Fyath
Department of Computer Engineering, Al-Nahrain University, Baghdad, Iraq
Correspondence to: Mays M. Ibrahim, Department of Computer Engineering, Al-Nahrain University, Baghdad, Iraq.
| Email: |  |
Copyright © 2019 The Author(s). Published by Scientific & Academic Publishing.
This work is licensed under the Creative Commons Attribution International License (CC BY).
http://creativecommons.org/licenses/by/4.0/

This paper investigates the noise characteristics and transmission performance of Nyquist half-cycle single-sideband system incorporating amplified or unamplified optical link. The system design is based on intensity modulation/optical carrier assisted direct detection scheme. Digital signal processing is used at the receiver to compensate dispersion and nonlinearity of the optical fiber. Simulation results are presented for both 1310 and 1550 nm single-channels carrying 224 Gbps 16-QAM data. The results are used as a guideline to extend the results for O- and C-band wavelength division multiplexing (WDM) systems. The maximum transmission distance Lmax is deduced for different systems using a bit error rate threshold of 4.5×10⁻³ which corresponds to 7% overhead decision forward error correcting code. The results reveal that Lmax of the unamplified 1550 nm single-channel system is about 1.75 time that of the 1310 nm counterpart. The simulation is reversed when optical amplifiers are used to compensate fiber loss leading to higher transmission distance at 1310 nm. Further, using 0 dB carrier and signal lasers offer 44 and 72 km transmission distance for the unamplified 16-channel WDMs operating at O- and C-bands, respectively. Inserting optical amplifiers changes these values to 450 and 110 km, respectively. The simulation results are performance using Optisystem ver. 14 and are in good agreement with published experimental data.
Keywords: Nyquist half cycle (NHC) optical communication, O- and C-bands NHC, 16-QAM IM/DD, Optical SSB 16-QAM
Cite this paper: Mays M. Ibrahim, Raad S. Fyath, Performance Comparison between O- and C-bands Optical Carrier-Assisted Nyquist Half-Cycle SSB Communication Systems, International Journal of Networks and Communications, Vol. 9 No. 1, 2019, pp. 37-52. doi: 10.5923/j.ijnc.20190901.03.
Article Outline
1. Introduction
- The emerging advanced optical networks face two main challenges related to the transmission capacity and user-end cost [1-5]. To deal with the increasing traffic demand associated with advanced data application based on internet of things (IOT) and cloud computing, the network should adopt advanced optical communication techniques [6-8]. Among these techniques are high-order modulation to increase the number of bits carried by the transmitting symbol [9, 10] and using multiplexing technique to transmit multichannel on the same link [3, 11, 12]. To reduce the cost at the user end, intensity modulation/direct detection (IM/DD) schemes are preferred to be used [13-15]. The DD receiver does not use a local laser source for the detection process and hence reduces the cost and increases the receiver robustness [16, 17]. Different IM/DD schemes have been used in optical networks such as orthogonal frequency-division multiplexing (OFDM) [18, 19], carrierless amplitude phase (CAP) modulation [5, 20], and subcarrier multiplexing (SCM) [21, 22]. The SCM scheme attracts increasing interest since it does not need high-speed numerical calculations when compared with OFDM, which uses fast Fourier transform, and CAP which uses virtual in-phase (I) and quadrature-phase (Q) filters.To increase the spectral efficiency (SE) of the SCM scheme, the following points should be taken into the consideration(i) Modulating the subcarrier by high-order modulation formats such as quadrature-amplitude modulation (QAM) [2, 9].(ii) Using Nyquist-half cycle (NHC) signaling where a rectangular-spectrum shape is adopted for the transmission pulses to ensure zero intersymbol interference (ISI) based on first Nyquist criterion [14, 17, 23-25]. In this case, the minimum transmission bandwidth required to transmit
 symbol rate with zero ISI is equal to
  . In other words, the raised-cosine filter shaping is redesigned here using approximated zero roll-off factor.(iii) Transmitting only one single-sideband (SSB) of the optical modulated carrier [25, 26-28]. The SSB transmission also reduces the effect of fiber group-velocity dispersion (GVD) which limits the maximum transmission distance in high-bit rate communication fiber link [29, 30].(iv) Using wavelength-division multiplexing (WDM) [9, 14, 22, 25, 31, 32] and polarization-division multiplexing (PDM) [11, 16, 27]. The PDM uses dual-polarization (DP) transmission to double the transmitted data rate.Recently, NHC-SSB SCM attracts increasing interest as a high spectral efficiency-modulation scheme suitable for high-bit rate links in short- and medium-reach optical network applications [1, 17, 25, 31]. An optical link based on this modulation scheme can be implemented using IM/DD configuration which reduces the cost and increases the robustness of the link. In 2017, Zhu et al. [23] have demonstrated the transmission of 16-QAM 224 Gbps data over 160 km standard single-mode fiber (SSMF) at C-band using NHC-SSB modulation. The transmission system uses optical carrier-assisted (OCA) technique to enhance the detection efficiency of the used DD receiver. In the experiment, the optical carrier was added with an additional (signal) laser at the transmitter side and the resultant waveform was delivered along the fiber. The scheme is equivalent to heterodyne coherent detection with a local oscillator and a single-ended photodiode (PD). The experimental results of Ref. [23] set a record of fiber link length for C-band 224 Gbps single channel and single PD direct detection transmission. Therefore, the OCA-NHC SSB configuration will be used as a basis for investigation in this work. The aim of is to investigate the transmission performance of NHC-SSB system operating at different link environments. This includes a single-channel and WDM systems operating at C- and O-bands with and without optical amplification using IM/DD scheme.
2. System Configuration and Noise Analysis
2.1. System under Observation
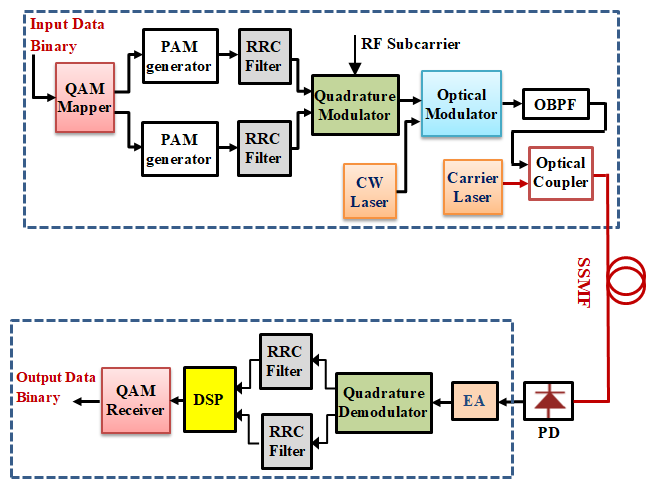 | Figure 1. Block diagram of optical-carrier assisted intensity modulation/direct detection (IM/DD) system incorporating Nyquist half-cycle (NHC) single-sideband (SSB) modulation format. PAM: Pulse amplitude modulation; RRC: Root raised-cosine; OBPF: Optical bandpass filter; PD: Photodiode; EA: Electronic amplifier, DSP: Digital signal processing |
 | (1a) |
 | (1b) |
 is the symbol rate,
  is the bit rate, and M is the modulation order.(iii) A high-order optical bandpass filter is used to select the lower-sideband (LSB) of the optical modulator output.(iv) The system uses two laser sources. A signal laser of frequency
  which is modulated by the data. The second laser is called the carrier laser of frequency
  and acts as an assisted carrier. The fields of the modulated signal laser and carrier laser should be combined before optical detection and therefore, the detection process is based on OCA-scheme. This scheme is useful for using DD receiver to detect the optical SSB signal.(v) The optical receiver uses a digital signal processing (DSP) unit for compensating fiber dispersion and nonlinear optics effects.(vi) The transmission link consists mainly of a SSMF. If optical amplifiers (OAs) are used to compensate fiber losses, the link is divided into many spans. Each span consists of 50 km SSMF followed by an OA to compensate the span loss.(vii) The field of the continuous-wave (CW) carrier laser can be combined with the field of the SSB component of the modulated signal laser at the transmitter side. This scheme is useful since both carrier and signals lasers are under control in the transmitter side. However, in WDM system, the carrier laser may be used in the receiver side to reduce the interference with near neighboring signal channels and also to reduce the effect of fiber nonlinear optics.
2.2. Receiver Noise Analysis
- This subsection presents frame work to identify the noise characteristics of the detection process in the receiver. Two special cases are considered here, one corresponds to a transmission link incorporating OAs and the second one corresponds to unamplified link. The first case has been investigated briefly in Ref. [23] and will be discussed again here for comparison purposes with the second case. It is worth to mention here that unamplified links are useful for short-reach optical networks from cost and robustness points of view.
2.2.1. Noise Analysis for Amplified-Link System
- This subsection presents detailed derivation of expressions describing the SNR of NHC SSB receiver incorporated in an amplified link system. The derivation stands heavily on the analysis reported in Ref. [23] and gives clear steps with remarks. The optical signal lunched at the fiber input can be expressed as
 | (2) |
 is the assisted optical carrier and
  is the SSB optical signal. The polarization of both
  and
and  are assumed to be aligned along the x axis with
  denotes the unit vector of the x polarization. Further,
 | (3a) |
 | (3b) |
 Field amplitude of the CW optical carrier.
  Frequency of the CW optical carrier.
 Field amplitude of the CW optical signal.
  Frequency of the CW optical signal.
  frequency of the RF subcarrier.
  Baseband signal with |u (t)|≤1.Assume that the optical channel has idea characteristics (i.e., the effect of attenuation, dispersion, and nonlinear optics are negligible) and the receiver performance is dominated by the contribution of amplified spontaneous emission (ASE) noise
  generated by the in-line optical amplifiers
 | (4) |
 and
and  denote the ASE noise sources in both polarization and
  is the unit vector of the y polarization. Under these assumptions, the received optical signal r(t) can be written as
  | (5a) |
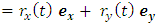 | (5b) |
 and
and  are the x and y polarization components, respectively.
 | (6a) |
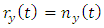 | (6b) |
 which is related to the square of the incident field amplitude
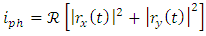 | (7) |
 is PD responsitivity with is PD quantum efficiency, q is the electron charge, h is Planck’s constan, t and
  is the frequency of the incident field.Inserting eqns. (6a) and (6b) into eqn. (7) yields
 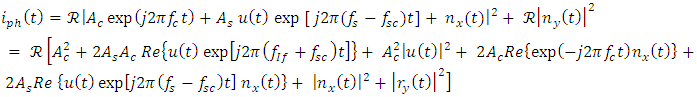 | (8) |
 is the intermediate frequency
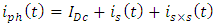
  and Re [.] denotes the real part of the complex argument.To get a clear physical insight on eqn. (8), the photocurrent may splitted into group of components
 Dc component.
  Desired signal.
  Signal-signal beat interference (SSBI).
  Carrier-noise (from the same polarization) beating.
  Signal-noise (from the same polarization) beating.
  Noise-noise beating.The expressions of these six photocurrent component are as follows
  | (9a) |
 | (9b) |
 | (9c) |
 | (9d) |
 | (9e) |
 | (9f) |
 can be deduced from the photocurrent
  | (10) |
 and
and  are the average power of the signal and noise associated with the photocurrent, respectively.
 | (11a) |
 Here
Here  denotes the expectation of the argument
 | (11b) |
 is the spectral density of the received ASE noise in each polarization and
  is the optical band pass filter (OBPF) bandwidth used at the receiver side to suppress the amplified spontaneous emission noise incident on the PD.Substituting eqns. (11a) and (11b) into eqn. (10) gives
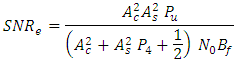 | (12) |
 and the power of the optical signal
  The carrier-to-signal power ratio is then given by
 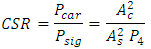 | (13a) |
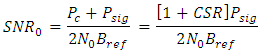 | (13b) |
 is reference optical bandwidth which is usually set to 0.1 nm in the measurement.(ii) After the photodetection, the signal-to-SSBI ratio SIR is given by
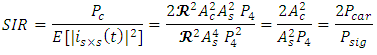 | (14) |
 and
and  Then the electrical SNR can be rewritten as (see eqn. (12))
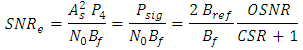 | (15) |
2.2.2. Noise Analysis for an Unamplified-Link System
- The optical signal lunched at the fiber input can be expressed by eqn. (2). The receiver PD generates a photocurrent
 which is related to the square of the incident field amplitude
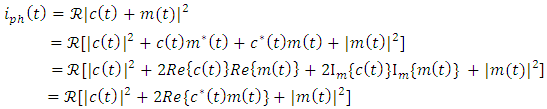 | (16) |
 | (17) |
 | (18) |
 and
and  denote the direct-current (DC) component, desired signal, and SSBI, respectively, which are given by
 | (19a) |
 | (19b) |
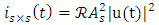 | (19c) |
 can be blocked by inserting a series capacitance in the current path.(ii) The signal component
  represents a DSB/suppressed carrier (SC) as a modulated version of the baseband signal
  with an effective RF carrier having a frequency equals
  . Coherent (synchronous) quadrature demodulator should be used to recover the signal
  from the component
  .(iii) The SSBI component
  cannot be eliminated by any filtering process since its spectrum overlaps with the signal spectrum.The electrical signal-to-noise ratio
  associated with the photocurrent can be computed from eqn. (10). In the absence of optical amplification, the main receiver noise components are thermal noise, which is mainly due to the front-end electronic amplifier used to amplify the photogenerated current, carrier shot noise, and signal shot noise [32]
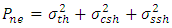 | (20a) |
 , and
, and  denote, respectively, the standard deviations (root-mean-square (RMS)) noise currents and they are given by
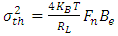 | (20b) |
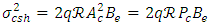 | (20c) |
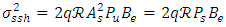 | (20d) |
 load resistance and
  noise figure [33]. In this equation,
  is Boltzmann constant, T is the absolute temperature (in Kelvin), and
  is the receiver electrical bandwidth. Equations (20c) and (20d) are deduced from the fact that the power spectral density (PSD) of the shot noise equals
  average current), where q is the magnitude of the electric charge [34].The electrical SNR of the unamplified-link system is then given by
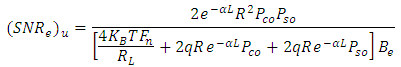
 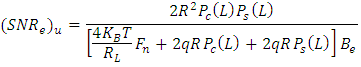 | (21) |
 and
and  denote, respectively, the carrier and signal power estimated at the end of the fiber link whose length is L, and they are related to the power launched at the fiber input
  by
by | (22a) |
 | (22b) |
 (measured in
  by
by | (23) |
 | (24) |
 the carrier laser field is coupled with the received signal field, and the resultant waveform is applied to the PD), then eqn. (24) can be modified to cover this case
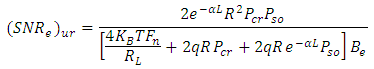 | (25) |
 is the power of the receiver-side inserted CW carrier laser. Here
  is the electrical SNR corresponding to the case of an unamplified link supported with carrier laser inserted at the receiver side.
3. Results
- This section presents results related to NHC-SSB system operating with different transmission link environment. Eight scenarios are used to describe the link environment based on the operating wavelength, number of WDM multiplexed channels, and the presence or absence of optical amplification. These scenarios areScenario A1: 1310 nm single-channel system without optical amplifiers.Scenario A2: 1310 nm single-channel system with optical amplifiers.Scenario A3: O-band WDM system without optical amplifiers.Scenario A4: O-band WDM system with optical amplifiers.Scenario B1: 1550 nm single-channel system without optical amplifiers.Scenario B2: 1550 nm single-channel system with optical amplifiers.Scenario B3: C-band WDM system without optical amplifiers.Scenario B4: C-band WDM system with optical amplifiers.A 224 Gbps 16-QAM data is assumed to be carried by each single channel. Other parameters valued used in the simulation are listed in Table 1. The values of maximum transmission distance
 reported in this section correspond to the lengths of the fiber link which make the receiver bit error rate (BER) approaches its threshold value. A
  BER threshold is used here which corresponds to 7% overhead hard-decision (HD) forward-error correcting (FEC). The simulation results are obtained using Optisystem ver. 14 software package.
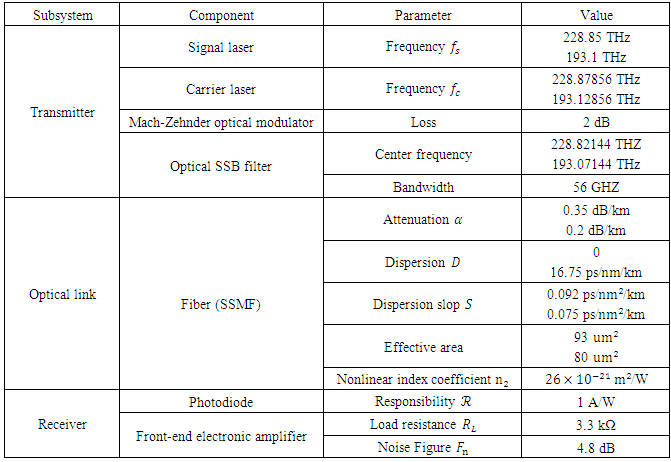
3.1. Single-Channel Transmission
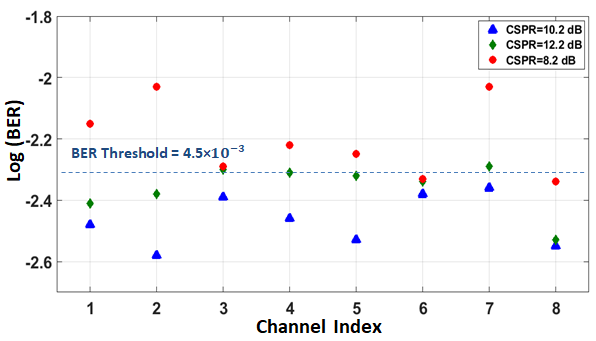
- Figure 2 shows the signals spectra and constellation diagrams at different points of the unamplified 1310 nm single-channel system (Scenario A1). The results are obtained using
 dBm,
dBm,  dBm (inserted at the transmitter side) and fiber length L =36 km. This link length corresponds to the maximum transmission distance,
  , under these conditions. Note that the a double-side band (DSB) spectrum of the modulated radio frequency (RF) subcarrier covers approximately 56 GHz bandwidth which corresponds to
 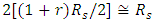 when
when  . This 56 GHz bandwidth also equals the bandwidth of the transmitted optical SSB signal. Note further, the ability of used DSP unit to compensate the fiber dispersion and recover the required constellation diagram. The simulation is repeated for the unamplified 1550 nm single-channel system (Scenario B1) and the results are reported in the Appendix.
 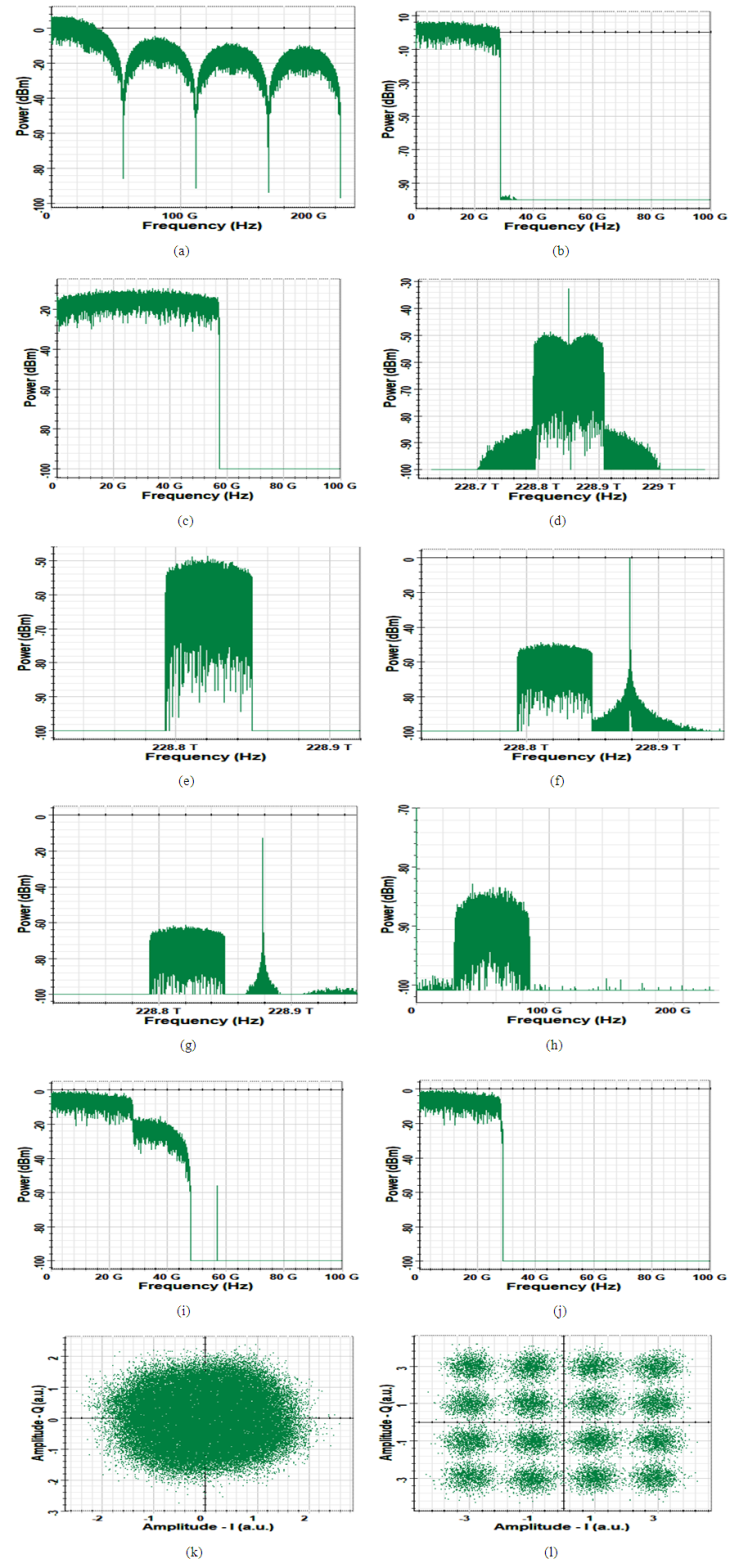 | Figure 2. Spectra and constellation diagrams related to an unamplified link 224 Gbps 16-QAM system operating at 1310 nm wavelength with L=36 km, Ps=0 dBm and Pc=0 dBm (carrier at transmitter). (a) Spectrum of the QAM pulse generator output (I-phase component). (b) Spectrum of the QAM modulator input. (c) Spectrum of the QAM modulator output. (d) Spectrum of the optical modulator output. (e) Spectrum of the optical SSB signal. (f) Spectrum of signal SSB + assisted carrier. (g) Spectrum of the optical signal at the fiber output. (h) Spectrum of the amplified photocurrent. (i) Spectrum of the QAM demodulator output. (j) Spectrum of the filtered QAM demodulator output. (k) Receiver constellation diagram at the DSP input. (L) Receiver constellation diagram at the DSP output |
 is set to 0 dBm, and the values of
  are estimated for different values of signal laser power
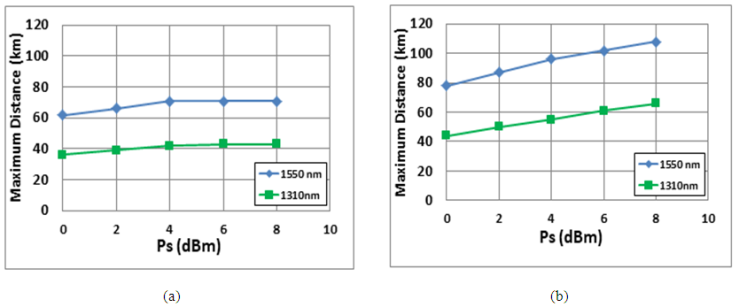 | Figure 3. Variation of maximum reach Lmax with signal laser power Ps assuming unamplified 224 Gbps 16-QAM system operating with Pc=0 dBm. (a) Carrier at the transmitter. (b) Carrier at the receiver |
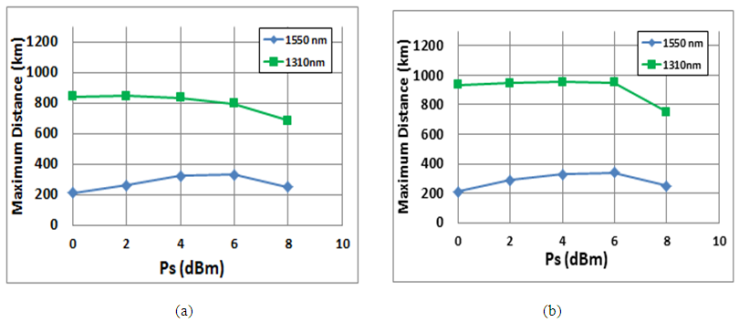 | Figure 4. Variation of maximum reach Lmax with signal laser power Ps assuming amplified 224 Gbps 16-QAM system operating with Pc=0 dBm. (a) Carrier at the transmitter. (b) Carrier at the receiver |
3.2. WDM Systems
- Two NHC-SSB WDM systems are designed in Optisystem environment for O-band and C-band operation. Each of the WDM system uses 100 GHz channel spacing
 and carries 224 Gbps 16-QAM date rate per channel. The frequency of
  channel laser is computer from
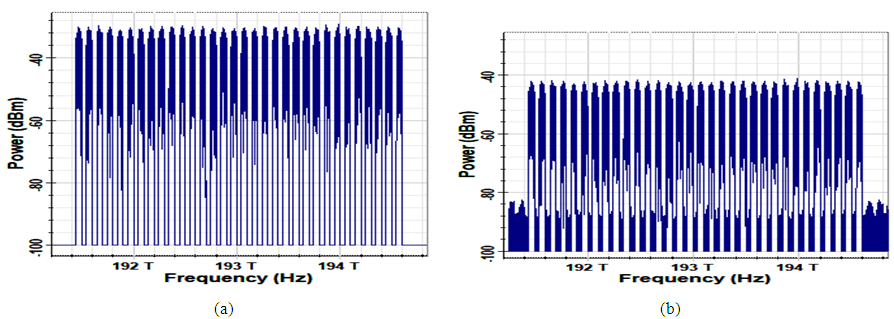
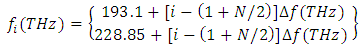 Figure 5 shows the spectrum of the O-band multiplexed signal at the fiber input and after 43 km transmission over unamplified link. The results are presented for
  dBm,
dBm,  dBm (inserted at the receiver side, L=Lmax=43 km, and N = 32). Note that the output spectrum is almost a copy of the input spectrum indicating the absence of distortion due to four-wave mixing (FWM) associated with fiber nonlinear optics. The only difference is the output spectrum level is reduced by 15 dB (=0.35dB/km × 43 km) due to fiber loss. The simulation results in Fig. 5 is repeated in Fig. 6 for
  dBm and Lmax=63 km. Note that the spectrum at the fiber output is slightly distorted when compared with the spectrum at the fiber input. This distortion comes from the FWM effect.
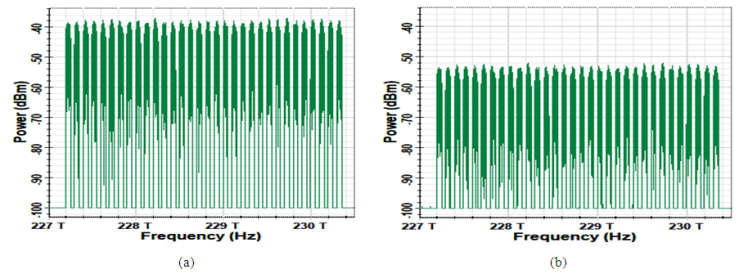 | Figure 5. Optical power spectra corresponding to unamplified 32×224 Gbps O-band WDM system operating with 16-QAM signal and Ps=0 dBm. (a) At the fiber input. (b) After 43 km transmission |
 and 8 dBm, respectively. The fiber length is set to Lmax which equals
 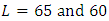 km, respectively. Other parameters used in the simulation are
  dBm and N = 32. Note that the effect of FWM on the output spectrum is more pronounced when compared with Fig. 5 and 6, especially, when
  dBm.
dBm.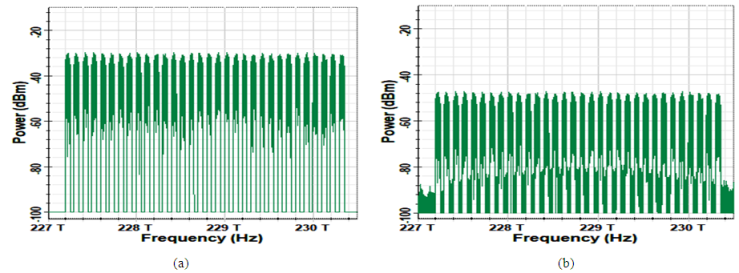 | Figure 6. Optical power spectra corresponding to unamplified 32×224 Gbps O-band WDM system operating with 16-QAM signal and Ps=8 dBm. (a) At the fiber input. (b) After 63 km transmission |
 | Figure 7. Optical power spectra corresponding to unamplified 32×224 Gbps C-band WDM system operating with 16-QAM signal and Ps=0 dBm. (a) At the fiber input. (b) After 65 km transmission |
 | Figure 8. Optical power spectra corresponding to unamplified 32×224 Gbps C-band WDM system operating with 16-QAM signal and Ps=8 dBm. (a) At the fiber input. (b) After 60 km transmission |
 onnumber of multiplexed channels for O-band and C-band, respectively. The results are reported for unamplified link with
  dBm (inserted at the receiver side). The O-band operation reveals the following results(i) When the number of multiplexed channels N ≤ 16, the maximum transmission distance is almost independent of N. Further, Lmax increases with signal laser power Ps. When Ps=0 dBm, Lmax ≈ 44 km when N= 1, 4, 8, and 16. Increasing Ps to 10 dBm yields Lmax ≈ 68 km.(ii) Increasing N to 32 decreases Lmax to 43 km and 50 km, when Ps=0 and 10 dBm, respectively. Note also that Lmax increases with Ps and reaches 63 km when Ps=8 dBm. Increasing Ps above 8 dBm reduces the value of Lmax. This behavior can be attributed to FWM effect associated with fiber nonlinear optics. Therefore, one can conclude that the optimum value of Ps=8 dBm when N=32 which gives the longest possible reach of 63 km.
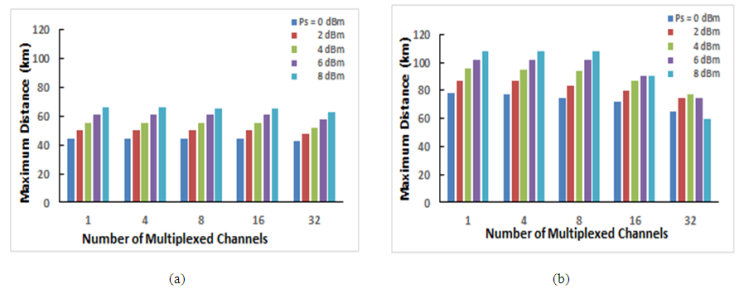 | Figure 9. Dependence of maximum reach of unamplified 16-QAM WDM system on number of multiplexed channels and assuming Pc=0 dBm and 224 Gbps 16-QAM channel data. (a) O-band. (b) C-band |
4. Comparison with Published Experimental Works
4.1. 1550 nm Single-Channel System
- This subsection compares simulation results obtained in this work with the experimental data reported in Ref. [23]. Both simulation and experimental results are related to OCA-SCM operates with 224 Gbps NHC-SSB 16-QAM signaling. The experimental results in Ref. [23] were presented for three transmission links: B2B, one span, and two spans. Each span consists of 80 km SSMF ended with 16 dB EDFA for losses compensation. Also an EDFA was inserted at the fiber input to boost the lunch power. The gain G of this OA was adjusted to achieve the required lunch power (see Fig. 10).
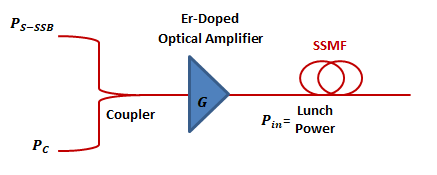 | Figure 10. Configuration of an optical link with boost erbium-doped optical amplifier used in the experiment of Ref. [23] |
 and the optical carrier-to-signal power ratio (CSPR) were taken as independent parameters in the results presented in Ref. [23]. From Fig.10. The optical signal lunched at the fiber input can be expressed as
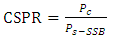 | (26a) |
 | (26b) |
 to a certain value, simulate the optical modulator subsystem, and record the SSB signal power
  .(ii) Calculate the required carrier laser power
  and EDFA gain
  .(iii) Set the values of other system parameters related to the transmitter, transmission link, EDFAs, and receiver as those reported in Ref. [23].For example, to achieve
  = 9 dBm and
  dB as considered in the reference, the signal laser power is set to 5 dBm in the simulation. The simulation yields
  dBm, and therefor, the carrier laser power is set to 3.5 dBm to achieve
  dB. The total power at the coupler output equals
  which corresponds to
  dBm. The gain G of the boost EDFA is set to 5.3 dB to get a 9 dB lunch power. Under these settings, the simulation yields BERs of
  , and
, and  for B2B, one span, and two-span transmission respectively. These are to be compared with
 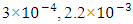 , and
, and  experimental BERs, respectively, as reported in Fig. 9c in Ref. [23]. Note that, both simulation and experimental BERs are lower than
  , which represents the BER threshold for 7% HD-FEC code. Note further that the simulation BERs,
  , are in the same order of the experimental ones,
  where
where  . Figures 11 (a-c) show the simulated optical spectra after 0, 80, and 160 km transmission distance, respectively. The simulated and experimental constellation diagrams after 80 and 160 km are given in parts d and e of this figure.
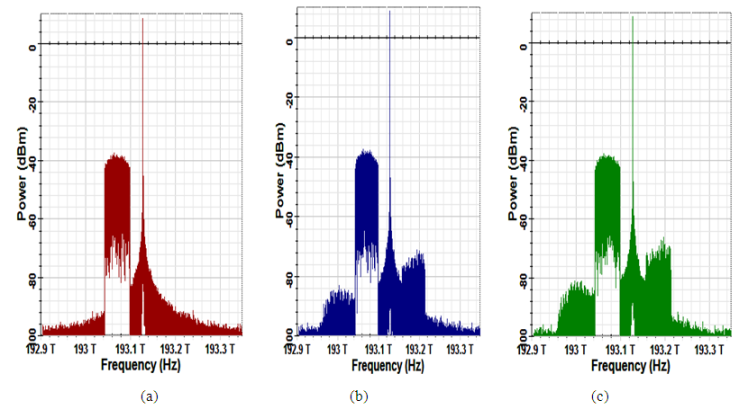 | Figure 11. Spectra of (carrier + SSB) waveforms and constellation diagrams related to amplified 224 Gbps carrier-assisted 16-QAM system operating at C-band (carrier at transmitter). (a) Spetrum after 0 km transmission. (b) Spectrum after 80 km transmission. (c) Spectrum after 160 km transmission. (d) Simulated and experimental constellation diagrams after 80 km transmission. (e) Simulated and experimental constellation diagrams after 160 km transmission |
 | Figure 11. (Continued) |
 | Figure 12. Variation of BER with lunch power after 160 km transmission with of 14 dB |
4.2. C-Band Wavelength-Division Multiplexing System
- Zou at al. [28] reported experimental results describing the transmission of 8×100 Gbps WDM signal over 320 km SSMF at C-band. Each channel operates with NHC-SSB 16-QAM signaling and DD scheme. The 320 km distance is distributed into four spans; each span uses 80 km-SSMF followed by 16 dB EDFA for loss compensation. The polarization of the odd lasers (lasers 1, 3, 5, and 7) are set orthogonal to the polarizations of the even lasers (laser 2, 4, 6, and 8) to reduce the interference between successive lasers fields due to fiber nonlinear optics. The WDM system uses 50 GHz channel spacing with additional EDFA inserted after the multiplexer to determine the required total power lunched into the fiber. Two BER thresholds were used in Ref. [28] to assess the performance of the demonstrated system;
 and
and  , which are related to 20% and 7% HD-FEC codes, respectively. Chromatic-dispersion compensation (CDC) technique was used to compensate fiber dispersion. The experiment was repeated with digital back propagation (DBP) technique to compensate both fiber dispersion and fiber nonlinearity.To simulate the experimental system reported in [28], an assisted optical carrier is inserted in each of the WDM channel transmitters. Thus, each transmitter contains both signal and carrier lasers. This approach has two main effects. (i) The total power launched into the fiber will be increased leading to high fiber nonlinear optics effects. (ii) The spectrum of the signal at the output of the channel transmitter covers frequencies from
  to
to  . For
. For  Gbps and 16-QAM signaling
  and
and  , the bandwidth of the transmitter signal
  GHz. Therefore, channel spacing of 50 GHz with high-order 40 GHz demultiplexer bandpass filters are used to ensure negligible crosstalk in accord with the experimental results. For comparison purposes, the above experimental work is simulated here using Optisystem software with lunch power per channel
  of 1 dBm and
  of 10.2 dB. When
  is set to 0 dBm, the simulation gives
  dBm
dBm  . The carrier laser power
  required to achieve a
  of 10.2 dB is equals – 0.3 dB
 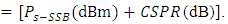 The lunch power per channel
 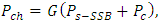 where G is the gain of the OA inserted after the multiplexer. Note that,
  dBm. Therefore,
  dB is used to yield
  dBm.Figure 13 shows simulation results related to the system under observation when the transmission link consists of 4 spans (320 km). Parts a and b display the optical spectra at the input and output of the transmission link. Note, the output spectrum contains many intermodulation distortion components due to the effect of fiber nonlinearity. Parts c and d compare the power spectra at the transmitter output and receiver input of channel 1. The two spectra contain almost the same frequency content, which reflects the effectiveness of the receiver DSP unit in compensating chromatic dispersion and nonlinear fiber optics. This is clear further by comparing the constellation diagrams at the receiver before and after the DSP unit as shown in parts e and f of this figure, respectively.
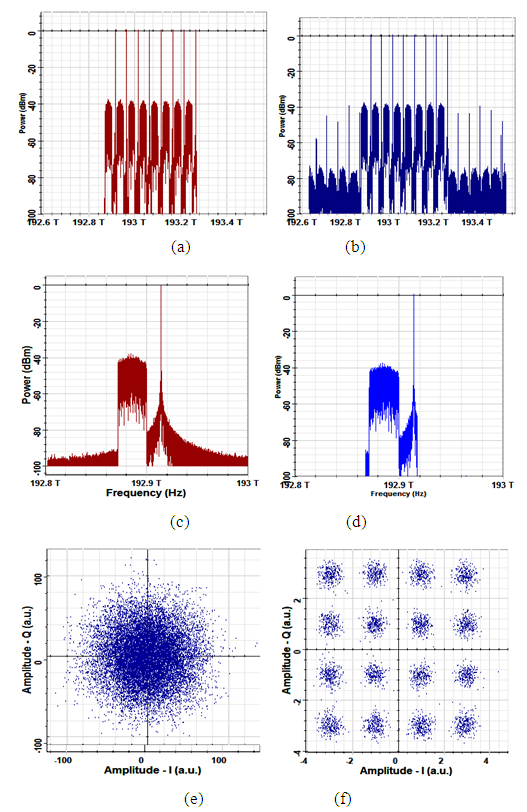 | Figure 13. Optical power spectra and constellation diagrams corresponding to unamplified (8×100 Gbps) C-band WDM system operating with 16-QAM signal and Ps=0 dBm. (a) Spectrum at the fiber input. (b) Spectrum after 320 km transmission. (c) Spectrum at the transmitter output of channel 1. (d) Spectrum at the receiver input of channel 1. (e) Receiver constellation diagram at the DSP input. (f) Receiver constellation diagram at the DSP output |
 is used. In fact, the simulation predicts successful transmission over 5 spans (400 km) as shown in Fig. 15 when
  dBm and CSPR = 10.2 dB. Figures 15 also contains results corresponding to CSPR of 8.2 and 12.2 dB and included here to address the effect of CSPR or the channels BERs. Investigating the results in Fig. 4.13 reveals that at constant lunch power per channel
  , using CSPR of 10.2 dB offers BERs less than the BER threshold for all the eight channels. Increasing CSPR on 12.2 dB or reducing CSPR to 8.2 dB increases the BERs of the channels and makes some of them above the BER threshold. This result can be explained as follows.
  . Therefore,
 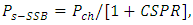 and hence, increasing CSPR leads to increasing
  The BER characteristics depends on the effective SNR, which can be stated as
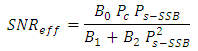 | (27) |
 . In this equation,
  is proportionality constant,
  represents the signal-independent noise power, and
  represents the signal × signal beat interference. Taking the derivative of
  with respect
  and set it to zero yields
 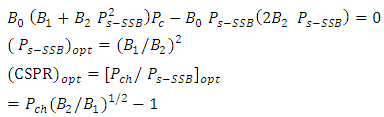 Note that, the optimum value of CSPR depends on channel lunch power
  and system parameters (B1 and B2). If one considers a 10.2 dB is the optimum value of CSPR at
  dB, then
  . Thus, the actual
  generated by the optical modulator
 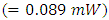 should by amplified by
  before lunching it into the fiber.
 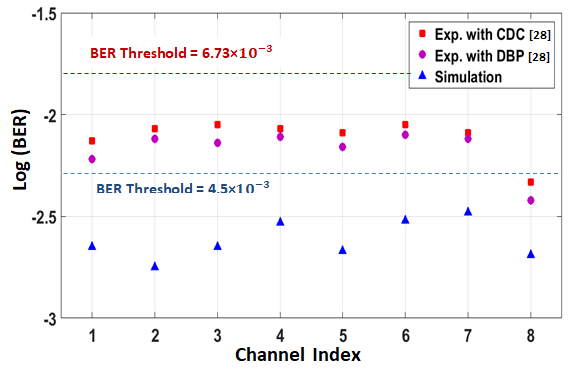 | Figure 14. Comparison between measured BERs [28] and simulated ones for all the 8 channels after 320 km transmission assuming Pch = 1 dBm and CSPR = 10.2 dB |
 | Figure 15. Simulated BERs of the 8 channels after 400 km transmission assuming Pch = 1 dBm |
5. Conclusions
- The noise characteristics and transmission performance have been investigated of optical carrier assisted NHC-SSB system designed with IM/DD scheme. Simulation results have been presented for both amplified and unamplified WDM systems operating at O- and C-bands with 224 Gbps 16-QAM channel data. The simulation results are in good agreement with published experimental data. The main conclusions drawn from this study are(i) The C-band WDM system offers higher transmission distance compared with O-band counterpart when no optical amplification is used. When Ps=Pc= 0 dBm, Lmax = 78 and 72 km when number of multiplexed channels N= 1 and 16, respectively, in the C-band system. These values are to be compared with 44 km for O-band system.(ii) Using optical amplification to compensate the link losses will increase the transmission distance of the C-band WDM system to 210 and 110 km when N= 1 and 16, respectively, and assuming Ps=Pc= 0 dBm. These values are to be compared with 935 and 450 km for the O-band system, respectively.(iii) Performance degradation due to fiber nonlinear optics becomes effective when N= 32 channels and this is more pronounced when Ps increases beyond 0 dBm. This leads to an optimum value for Ps which gives the longest transmission distance. For the unamplified system, (Pc)optimum= 4 and 8 dBm for C- and O-bands, respectively. The corresponding values of Lmax are 77 and 63 km, respectively.
Appendix
- Results Related to 1150 nm Single-Channel Transmitter
 | Figure 16. Spectra and constellation diagrams related to an unamplified 224 Gbps 16-QAM system operating at 1550 nm wavelength with L=62 km, Ps=0 dBm and Pc=0 dBm (carrier at transmitter). (a) Spectrum of the QAM pulse generator output (-phase component). (b) Spectrum of the QAM modulator input. (c) Spectrum of the QAM modulator output. (d) Spectrum of the optical modulator output. (e) Spectrum of the optical SSB signal. (f) Spectrum of signal SSB + assisted carrier. (g) Spectrum of the optical signal at the fiber output. (h) Spectrum of the amplified photocurrent. (i) Spectrum of the QAM demodulator output. (j) Spectrum of the filtered QAM demodulator output. (k) Receiver constellation diagram at the DSP input. (L) Receiver constellation diagram at the DSP output |
References
| [1] | J. Zhang, Y. Zheng, X. Hong, and C. Guo, "Increase in capacity of an IM/DD OFDM PON using super-Nyquist image-induced aliasing and simplified nonlinear equalization", IEEE Journal of Lightwave Technology, vol. 35, no. 19, pp. 4105-4113, Oct. 2017. |
| [2] | O. A. Sab, P. Plantady, A. Calsat, S. Dubost, L. Schmalen, V. Letellier, and J. Renaudi, "25.4-Tb/s transmission over transpacific distances using truncated probabilistically shaped PDM-64QAM", IEEE Journal of Lightwave Technology, vol. 36, no. 6, pp. 1354-1361, Mar. 2018. |
| [3] | A. Tanaka, S. Murakami, T. Tajima, T. J. Xia, and G. A. Wellbrock, "Terabit/s Nyquist super channels in high capacity fiber field trials using DP-16QAM and DP-8QAM modulation formats", IEEE Journal of Lightwave Technology, vol. 32, no. 4, pp. 776-782, Feb. 2014. |
| [4] | R. Linden, N. C. Tran, E. Tangdiongga, and T. Koonen, "Optimization of flexible non-uniform multilevel PAM for maximizing the aggregated capacity in PON deployments", IEEE Journal of Lightwave Technology, vol. 36, no. 12, pp. 2328-2336, Jun. 2018. |
| [5] | C. C. Wei, K. Z. Chen, L. W. Chen, C. Y. Lin, W. J. Huang, and J. Chen, "High-capacity Carrierless amplitude and phase modulation for WDM long-reach PON featuring high loss budget", IEEE Journal of Lightwave Technology, vol. 35, no. 4, pp. 1075-1082, Feb. 2017. |
| [6] | B. P.S. Sahoo, C. C. Chou, C. W. Weng, and H. Y. Wei, "Enabling Millimeter-Wave 5G Networks for Massive IoT Applications", IEEE Consumer Electronics magazine, vol. 8, pp. 49-54, Jan. 2019. |
| [7] | Z. Zhang, J. Dang, L. Wu, H. Wang, J. Xia, W. Lei, J. Wang, and X. You, "Optical mobile communications: principles, implementation and performance analysis", IEEE Transactions on Vehicular Technology, vol. 68, no. 1, pp. 471-482, Jan. 2019. |
| [8] | J. Son and R. Buyya, "SDCon: integrated control platform for software-defined clouds", IEEE Transactions on Parallel and Distributed Systems, vol. 30, pp. 230-244, Jan. 2017. |
| [9] | D. Soma, Y. Wakayama, S. Beppu, S. Sumita, and T. Tsuritani, "10.16-Peta-B/s dense SDM/WDM transmission over 6-mode 19-core fiber across the C+L band", IEEE Journal of Lightwave Technology, vol. 36, no. 6, pp. 1362-1368, Mar. 2018. |
| [10] | D. Soma, S. Beppu, Y. Wakayama, K. Igarashi, T. Tsuritani, I. Morita, and Masatoshi Suzuki, "257-Tbit/s weakly coupled 10-mode C + L-band WDM transmission", IEEE Journal of Lightwave Technology, vol. 36, no. 6, pp. 1375-1381, Mar. 2018. |
| [11] | M. Nakao, T. Ishihara, and S. Sugiura, "Dual-mode time-domain index modulation for Nyquist-criterion and faster-than-Nyquist single-carrier transmissions", IEEE Access, vol. 5, pp. 27659 -27667, Nov. 2017. |
| [12] | S. Peng, A. Liu, X. Pan, and H. Wang, "Hexagonal multicarrier faster-than Nyquist signaling", IEEE Access, vol. 5, pp. 3332- 3339, Mar. 2017. |
| [13] | M. Chagnon, M. M. Osman, and D. V. Plant, "Half-terabit single-carrier direct-detect transceiver, formats, and DSP: analysis and demonstration", IEEE Journal of Lightwave Technology, vol. 36, no. 2, pp. 447-459, Jan. 2018. |
| [14] | Z. Li, E. Sillekens, L. Galdino, T. Xu, B. C. Thomsen, P. Bayvel, and R. I. Killey, "Digital linearization of direct-detection transceivers for spectrally-efficient 100 Gb/s/λ WDM metro networking", IEEE Journal of Lightwave Technology, vol. 36, no. 1, pp. 27-36, Jan. 2018. |
| [15] | S. T. Le , K. Schuh, M. Chagnon, F. Buchali, R. Dischler, V. Aref, H. Buelow, and K. M. Engenhardt, "1.72-Tb/s virtual-carrier-assisted direct-detection transmission over 200 km", IEEE Journal of Lightwave Technology, vol. 36, no. 6, pp. 1347-1353, Mar. 2018. |
| [16] | K. Zou, Y. Zhu, F. Zhang, and Z. Chen, "200Gbit/s Nyquist 16-QAM half-cycle subcarrier modulation transmission with dual-polarization direct detection", 21st OptoElectronics and Communications Conference/International Conference on Photonics in Switching (OECC/PS), pp. 3-7, Jul. 2016. |
| [17] | J. Tang, J. He, D. Li, M. Chen, and L. Chen,"64/128-QAM half-cycle subcarrier modulation for short-reach optical communications ", IEEE Photonics Technology Letters, vol. 27, no. 3, pp. 284-287, Feb. 2015. |
| [18] | R. Bai, Q. Wang, and Z. Wang, "Asymmetrically clipped absolute value optical OFDM for intensity-modulated direct-detection systems", IEEE Journal of Lightwave Technology, vol. 35, no. 17, pp. 3680-3691, Sep. 2017. |
| [19] | M. Chen, Q. Chen, H. Zhou, Z. Zheng, J. He, and L. Chen, "Low-complexity receiver using under sampling for guard-band SSB-DDO-OFDM", IEEE Photonics Journal vol. 9, no. 4, Article no. 7203012, Aug. 2017. |
| [20] | J. A. Altabas, S. Rommel, R. Puerta, D. Izquierdo, J. I. Garces, and I. T. Monroy, "Nonorthogonal multiple access and carrierless amplitude phase modulation for flexible multiuser provisioning in 5G mobile networks", IEEE Journal of Lightwave Technology, vol. 35, no. 24, pp. 5456-5463, Dec. 2017. |
| [21] | N. Liu, X. Chen, C. Ju, and R. Hui, "40-Gbps vestigial sideband half-cycle Nyquist subcarrier modulation transmission experiment and its comparison with orthogonal frequency division multiplexing", Optical Engineering, vol. 53, no. 9, Article no. 096114, Sept. 2014. |
| [22] | Z. Li, M. S. Erkılınc, K. S. Sillekens, L. Galdino, T. Xu, B. C. Thomsen, P. Bayvel, and R. I. Killey, "Spectrally efficient 168 Gb/s/λ WDM 64-QAM single-sideband Nyquist-subcarrier modulation with Kramers–Kronig direct-detection receivers", IEEE Journal of Lightwave Technology, vol. 36, no. 6, pp. 1340-1346, Mar. 2018. |
| [23] | Y. Zhu, K. Zou, Z. Chen, and F. Zhang,"224 Gb/s optical carrier-assisted Nyquist 16-QAMhalf-cycle single-sideband direct detection transmission over 160 km SSMF", IEEE Journal of Lightwave Technology, vol. 35, no. 9, pp.1557-1565, May 2017. |
| [24] | K. Zhong, X. Hou, Y. Wang, L. Wang, J. Yuan, C. Yu, A. P. T. Lau, and C. Lu, "Experimental demonstration of 608Gbit/s short reach transmission employing half-cycle 16-QAM Nyquist-SCM signal and direct detection with 25Gbps EML", Optics Express, vol. 24, no. 22, pp. 25057-25067, Oct. 2016. |
| [25] | M. M. Ibrahim and R. S. Fyath, "Performance investigation of unamplified C-band Nyquist 16-QAM half-cycle transmission for short-reach optical communications", International Journal of Networks and Communications, vol. 9, no. 1, pp. 1-22, Jan. 2019. |
| [26] | Z. Li, M. S. Erkılınc, K. Shi, E. Sillekens, L. Galdino, T. Xu, B. C. Thomsen, P. Bayvel, and R. I. Killey, "Digital linearization of direct-detection transceivers for spectrally efficient 100 Gb/s/λ WDM metro networking", IEEE Journal of Lightwave Technology, vol. 36, no. 1, pp. 27-36, Jan. 2018. |
| [27] | X. Ruan, K. Li, D. J. Thomson, C. Lacava, F. Meng, I. Demirtzioglou, P. Petropoulos, Y. Zhu, G. T. Reed, and F. Zhang, "Experimental comparison of direct detection Nyquist SSB transmission based on silicon dual-drive and IQ Mach-Zehnder modulators with electrical packaging", Optics Express, vol. 25, no. 16, pp. 19332-19342, Aug. 2017. |
| [28] | K. Zou, Y. Zhu, and F. Zhang, "800 Gb/s (8×100 Gb/s) Nyquist half-cycle single-sideband modulation direct-detection transmission over 320 km SSMF at C-band", IEEE Journal of Lightwave Technology, vol. 35, no. 10, pp. 1900-1905, May 2017. |
| [29] | S. Endo, K. I. A. Sampath, and J. Maeda, "Chromatic dispersion-based modulation distortion compensation for analog radio-over-fiber: performance improvement in OFDM transmission", IEEE Journal of Lightwave Technology, vol. 36, no. 24, pp. 5963-5968, Dec. 2018. |
| [30] | C. Yang, M. Luo, C. Li, W.i Li, and X. Li, "Transmission of 64-Gb/s pilot-assisted PAM-4 signal over 1440-km SSMF with phase noise mitigation", IEEE Photonics Technology, vol. 11, no. 1, Article no. 7200709, Feb. 2019. |
| [31] | S. Chen, C. Xie, and J. Zhang, "Comparison of advanced detection techniques for QPSK signals in super-Nyquist WDM systems", IEEE Photonics Technology Letters, vol. 27, no. 1, pp. 105-108, Jun. 2015. |
| [32] | J. M. Senior, "Optical fiber communications principles and practice", Prentice Hall, Financial Times, England, 2009. |
| [33] | G. P. Agrawal, "Lightwave technology telecommunication systems", Wiley Intersscience, John Wiley, Sons, 111 River Street, Hoboken, NJ 07030, Canada, 2005. |
| [34] | L. N. Binh, "Optical modulation advanced techniques and applications in transmission systems and networks", Taylor and Francis Group, LLC, Boca Raton, London, New York, CRC Press, 2018. |