-
Paper Information
- Paper Submission
-
Journal Information
- About This Journal
- Editorial Board
- Current Issue
- Archive
- Author Guidelines
- Contact Us
International Journal of Networks and Communications
p-ISSN: 2168-4936 e-ISSN: 2168-4944
2019; 9(1): 23-36
doi:10.5923/j.ijnc.20190901.02

Configurable Beam-Steering Network for Phase Array Antennas- Part I: Proposed Configurable Photonic True Time Delay Line
 Abstract
 Reference
 Full-Text PDF
 Full-text HTML
Duaa Alyas Karim Aljaf1, Raad Sami Fyath2
1Department of Electronic and Communications Engineering, Al-Nahrain University, Baghdad, Iraq
2Department of Computer Engineering, Al-Nahrain University, Baghdad, Iraq
Correspondence to: Duaa Alyas Karim Aljaf, Department of Electronic and Communications Engineering, Al-Nahrain University, Baghdad, Iraq.
| Email: |  |
Copyright © 2019 The Author(s). Published by Scientific & Academic Publishing.
This work is licensed under the Creative Commons Attribution International License (CC BY).
http://creativecommons.org/licenses/by/4.0/

Beam-steering networks for phase array antennas (PAAs) have been successfully and efficiently implemented in the literature using photonic true time delay line (TTDL). The delay line has been designed according to the operating microwave frequency  and number of radiating elements N of the PAA and cannot be adopted efficiently for other PAAs operating at different parameters values. Future wireless communication base stations will deal with PAAs having different values of
  and N and therefore, it is essential to design smart beam-steering networks. In this paper, a configurable photonic TTDL is proposed for PAA beam-steering network. The delay line consists of cascaded linearly chirped fiber Bragg gratings (LCFBGs) whose number is adopted according to the operating frequency, number of radiating elements, and steering angle. A parametric study of the used LCFBG is performed and the simulation results reveal that a FBG designed with 80 mm length and modified Gaussian apodization offers a 562 ps time delay difference across its reflectively spectrum bandwidth (4 nm). The scanning capabilities of PAAs incorporating this configurable photonic delay line is investigated and the results are given in the accompanying paper [1]. The simulation results reported here are obtained using OptiGrating ver. 14-1 Software.
Keywords: Phase array antenna, Linearly chirped fiber Bragg grating, Microwave photonics, True time delay line
Cite this paper: Duaa Alyas Karim Aljaf, Raad Sami Fyath, Configurable Beam-Steering Network for Phase Array Antennas- Part I: Proposed Configurable Photonic True Time Delay Line, International Journal of Networks and Communications, Vol. 9 No. 1, 2019, pp. 23-36. doi: 10.5923/j.ijnc.20190901.02.
Article Outline
1. Introduction
- Recently, there is increasing interest in microwave photonics (MWP)-based signal processing which connects microwave domain with optical domain [2, 3]. The MWP technique enables efficient generation and processing of microwave signals using photonic technology [4, 5]. The main inherent features of MWP are immunity to electromagnetic interference, low loss, wide-bandwidth operation, compactness, and light weight [6, 7]. Further, MWP can offer tunability and reconfigurability for the whole system, which is hard to realize using conventional microwave technologies [8, 9].One of the main applications of MWP is beam steering and beam forming of microwave and millimeter wave phase array antennas (PAAs) [10, 5]. This application has been demonstrated successfully for wireless communications [11-13] and radar imaging systems [14]. The steering operation of traditional PAAs relies on microwave phase shifters which are used to control the phase of each radiating elements (sub-antenna) in the PAA. The interference of electromagnetic waves from these radiating elements control the beam pattern in the free space. Microwave photonic phase shifters suffer from beam-squint problem which limits the operation bandwidth [5]. This problem arises due to the dependence of beam steering angle on the microwave frequency which leads to the divergence of beam directions of different microwave frequencies at increasing steering angles. This problem can be solved by using a true time delay line (TTDL) which offers a linear phase shift-frequency characteristics and hence ensures a frequency-independent steering angle. Photonic delay line has been emerged as promising candidates for TTDL beam steering networks in terms of loss and bandwidth beside its suitability for implementation in MWP platform [15, 16]. In photonic beam steering network, the microwave signal is mapped into an optical carrier. The modulated optical carrier is then launched into the photonic TTDL to get the required delay and the resultant optical signal is photodetector to get a delayed version of the microwave signal.It is worth to mention here that photonic-based beam steering networks cannot be in general realized using conventional photonic transmission lines (optical fibers or optical waveguides). These photonic lines offer time delay which is almost independent of the laser wavelength. The time delay
 offered by photonic line of length
  is given by
  , where
  is the speed of light in free space and
  is the refractive index of propagation medium. Therefore, the phase shift
  between successive radiating elements cannot be varied by tuning the laser wavelength. In contrasts photonic TTDL implemented using fiber Brag grating (FBG) technology offers a time delay
  which is a function of the laser wavelength
  [6]. The corresponding phase shift
  where
where  is the time period of a microwave signal of frequency
  (or wavelength
  ). Hence the steering angle
  [17] becomes equal to
  , where
  is the radiating elements spacing. In this case
  is independent of the microwave signal spectral contents and can be controlled by tuning the laser wavelength
  The individual radiating element are frequently space about a half–wavelength apart (i.e.,
  ), where
  is taken as the center wavelength of the microwave signal spectrum. This makes
 Therefore, to obtain a fixed value of
  the time delay
  should be adapted according to the operating microwave frequency
  At low microwave frequencies, the required value of
  can not be obtained by one FBG and cascaded configuration of photonic TTDLs is required. This issue is addressed in this paper where an adaptive photonic TTDL is proposed using FBGAs and optical switches. The concepts of this work may be applied in base stations of wireless communication systems which will deal with PAAs having different values of
  and number of radiating elements. Therefore, it is essential to design smart beam-steering networks for these base stations and this subject will be addressed in the accompanying paper [1].
2. Background on Apodized Linearly Chirped Fiber Bragg Grating
- This section introduces the main concepts of FBG and its linearly chirped version. The principles of refractive index-apodization profiles are briefly illustrated.
2.1. Concepts of Fiber Bragg Grating
- Fiber Bragg gratings (FBGs) are formed by constructing a periodic or aquasi-periodic modulation of refractive index inside the core of an optical fiber, see Figure 1. This change in index of refraction is typically created by exposing the fiber core to an intense interference pattern of UV energy. The exposure produces a permanent increase in the refractive index of the fiber's core, creating a fixed index modulation according to the exposure pattern. This fixed index modulation is called a grating [18]. A small amount of light is reflected at each period. All the reflected light signals combine coherently to one large reflection at a particular wavelength. This is referred to as the Bragg condition, and the wavelength at which this reflection occurs is called the Bragg wavelength. Only those wavelengths that satisfy the Bragg condition are affected and strongly back reflected through the same core of the fiber. Uniform FBGs are based on a periodical modulation of the refractive index in the core of an optical fiber Figure 1, and they are the most popular grating-based type of technology.
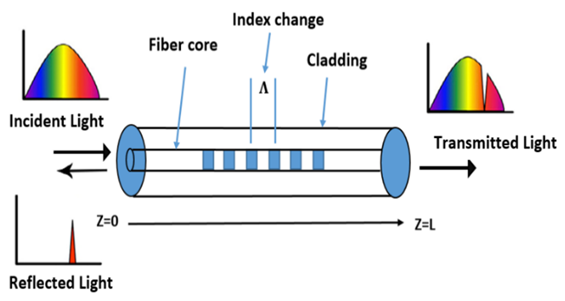 | Figure 1. Concept of fiber Bragg grating. Illustrative spectra of the incident, reflected and transmitted waves are given |
 equals to [19]
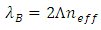 | (1) |
 is the period of the refractive index modulation, and
  is the effective refractive index of the fiber core. In a chirped FBG, periodicity of the modulation is not constant, but it changes along the propagation axis z; the function
  defines the chirp pattern. This implies that each different section of the grating reflects a different Bragg wavelength, and the overall spectrum of the FBG results from the spectrum of each section of the grating.Consider an uniform FBG extended along the z-axis from z=0 to z=L. Assume that the periodic variation of the refractive index over the grating axial direction (z–axis) takes the following form [20]
 | (2) |
 is the axial average of the refractive index,
  represents the peak of the refractive index variation, and
  denotes the grating pitch which represents the period of the z-dependent refractive index variation as shown in Figure 2. The typical value of
  varies in the range
  to
to  . Under weak coupling (i.e.,
  , the fundamental mode of the grating wavelength can be expressed as [18]
 | Figure 2. Refractive index change in optical fiber |
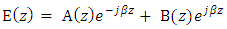 | (3) |
 and
and  represent forward- and backward-propagating modes, respectively, and
  is the propagation constant
  | (4) |
 is the effective refractive index of the fundamental mode whose wavelength is
  The relation between the forward mode
  and the backward mode
  is governed by the following coupled equations [18]
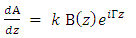 | (5a) |
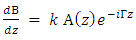 | (5b) |
 is the coupling coefficient
  | (5c) |
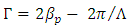 | (5d) |
 and
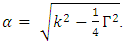
and  . Taking the derivative of both sided of equ. 3 with respect to z yields
  | (6a) |
 | (6b) |
 | (7) |

 | (8) |
 Using equ. 5b yields
  | (9) |
 gives
gives | (10) |
 | (11) |
 | (12) |
2.2. Linearly Chirped FBG
- The chirped FBG has nonuniform grating period
 along its length z. When
  varies linearly with z, the structure is called linearly chirped (LC) FBG. The LCFBG is characterized by a wider reflection spectrum since each wavelength component is reflected at different grating position. This type of FBG can be fabricated by varying the peak refractive index variation
  (see equ. 2) with the axial length z. For an FBG extending from z = 0 to z = L, the linearly chirped period can be expressed as [20]
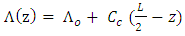 | (13a) |
 is the center period of the grating and
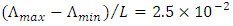
  is the chirp parameter. The maximum and minimum grating periods occur at z = 0 and z = L, respectively
  | (13b) |
 | (13c) |
 and
and  is the total chirp. Recall that the Bragg wavelength
  is related to the grating period
  and effective refractive index
  by
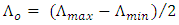
by  Then for a LCFBG, the minimum and maximum value of the Bragg wavelength can be computed from
  | (14) |
 | (15) |
 of the FBG is defined as the variation of the time delay
  associated with reflection transfer function with wavelength
  | (16) |
 | (17) |
 which corresponds to the grating period at the axial center of the FBG. Note that
  is constant over the spectral range of interest and this ensures a linear variation of time delay with
  This feature is very important to design TTDL where the time delay can be varied linearly with the laser wavelength.
2.3. Apodization Profiles
- Refractive index-apodization profile refers to the case when the peak of the refractive index variation
 is not uniform along the FBG axis (see equ. 2). In this case
  is z-dependent and can be expressed as
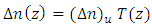 | (18) |
 corresponds to the uniform apodization profile where the peak of the refractive index is uniform across the length of the FBG and T(z) is the apodization profile or function. Note that T(z) is similar to a spatial window used in signal processing.It is well known from the literature that using apodization and linear chirping in Bragg gratings reduces the side lobe level in the reflectivity response and also the group time delay response ripple [21]. However, different apodization profiles having different impact and it would be useful to choose the profile that is more suitable for the problem under investigation. In this work, the apodization profile is chosen to give large time delay difference across the LCFBG spectrum. The investigation done in this work reveals that the best results are obtained by using two types of apodization profiles(i) Modified Gaussian Apodization (MGA) [22]
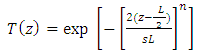 | (19) |
 is the taper parameter.(ii) Gaussian Apodization (GA) [22]
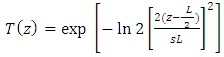 | (20) |

3. Proposed Beam-steering Network
3.1. System Configuration
- Figure 3 illustrates the main concepts of the configurable photonic TTDL-based beam-steering network investigated in this work. For N-element PAA, the outputs of N-tunable semiconductor lasers (TSLs) are multiplexed and the resultant waveform is then modulated by the microwave signal. The modulated multiplexed signal is launched into the configurable TTDL and the output is applied to 1:N demultiplexer. Each of the demultiplexer output is detected by a photodiode (PD) to recover a delayed version of the microwave signal which is then amplified by a low-noise amplifier (LNA) before feeding the radiating element. The configurable photonic delay line consists of K cascaded identical FBGs. Successive FBGs are separated by electrically controlled optical switch (OS) (see Figure 3(b-d)). The OS operates in either bar state or cross state depending whether the state of the control signal is ON or OFF, respectively. When the OS operates in the bar state, the switch passes the input optical signal to next FBG for extra delay. In the cross state, the input signal does not need extra time delay and therefore passes directly to the demultiplexer input.
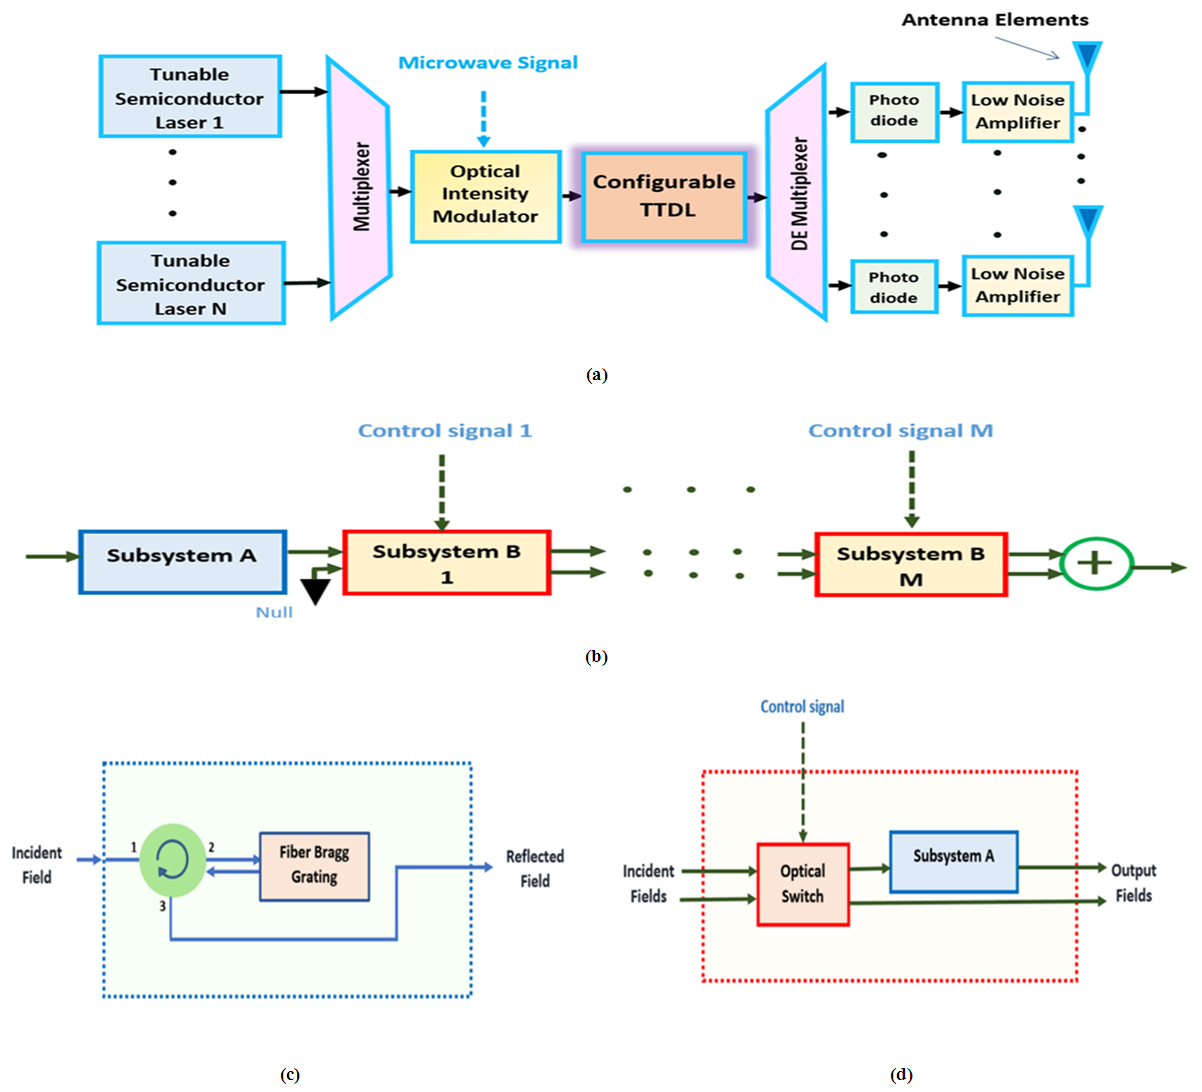 | Figure 3. Proposed photonic TTDL-based beam steering. (a) System configuration; (b) Configurable photonic delay line; (c) Subsystem A; (d) Subsystem B |
3.2. Design Guidelines
- The performance of the photonic TTDL depends mainly on the reflection characteristics of the employed FBGs. The design of the FBG should satisfy the following requirements(i) High-peak and wideband optical power reflection spectrum centered at a given wavelength
 The wavelength of the used TSLs should distributed around the center wavelength
  and see almost the same power reflection. According to that, -0.5dB bandwidth measure is used here to estimate the bandwidth of the power reflection spectrum
  This ensures 0dB (i.e., 100%) power reflection at the center wavelengths
  and -0.5dB (i.e., 89%) at the lower and higher cutoff wavelengths. The slight variations in the power reflections seen by the semiconductor lasers can be equalized at the receiver end by adapting the gains of the LNAs.(ii) Linear variation of the time delay associated with FBG amplitude (field) reflection transfer function across the spectrum and without ripple. This is useful to ensure a linear variation of the time delay with TSLs wavelength spacing.(iii) Large time delay across the spectrum
  and it is preferred to yield high dispersion parameter
  A linearly chirped FBG (LCFBG) is used in this delay line to yield a linear time delay-wavelength characteristics. The Bragg wavelength varies linearly along the FBG axis and yields a time delay that decreases linearly with the wavelength in the reflection spectrum bandwidth. Figure 4 shows an ideal time delay characteristics
  of a LCFBG across the power reflection bandwidth
 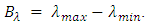 Here
Here  and
and  are, respectively, the upper and low cutoff wavelengths of the spectrum. The chirp parameter of the FBG is a positive quantity and computed from
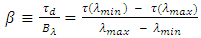 | (21) |
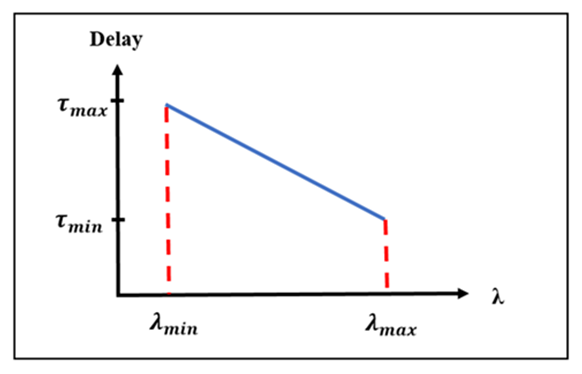 | Figure 4. Time delay characteristics  of a LCFBG across the power reflection bandwidth of a LCFBG across the power reflection bandwidth |
 within the reflection bandwidth can be expressed as
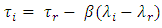 | (22) |
 and
and  are the time delays associated with
  and the reference wavelength
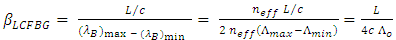
  , respectively.The time delay difference between two adjacent TSLs whose wavelengths differs by
  is given by
 | (23) |
 with
with  The TSLs operate in continuous-wave (CW) mode with equal wavelength spacing
  The wavelengths of the TSLs (
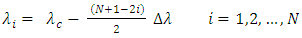
 ) are assumed to be distributed symmetrically around the spectrum center wavelength. Figure 5 illustrates the wavelengths corresponding to a 4-element PAA.
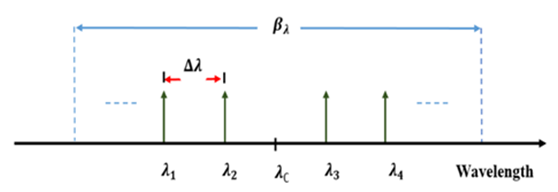 | Figure 5. Wavelengths distribution of four TSLs used in the 4-element of PAA |
 | (24) |
 and
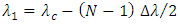
and 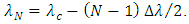 The maximum wavelength spacing
  is set to
  to ensure that the wavelengths of the first and last lasers (i.e.,
  and
and  ) are not located at the spectrum edges. According to that
  and
and  even when
  approaches it maximum value. Setting
  to
to  is useful to tolerate FBG fabrication error. In other words, this setting ensures that the wavelengths of the TSLs are laying within the FBG spectrum. When
  tends to its maximum value
  then
then  and
and  approach their minimum and maximum values, respectively.
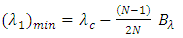 | (25a) |
 | (25b) |
 with its beam-steering network uses a single LCFBG. The phase shift
  between two successive radiating elements is related to the corresponding time delay difference by
  | (26) |
 and
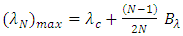
and  is the period and frequency of the microwave signal used to modulate the lasers optical carriers, respectively. Then the steering angle
  is given by
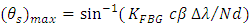
 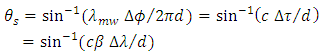 | (27) |
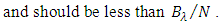
 function should not exceed 1. This yields the following threshold condition which determines the upper bound of the wavelength spacing,
 | (28) |
 then the maximum achievable steering angle is given by
  | (29) |
 | (30a) |
 | (30b) |
 denotes the maximum integer in the argument.b- Multi FBG-Based Beam-Steering NetworkConsider the case when the beam steering is achieved by using number of FBGs,
  from the K cascaded FBG available in the photonic line. The used optical circulators isolate the incident field from the reflected field for each used FBG. Therefore, the isolator acts as a buffer stage between two successive FBGs. Hence the total reflection transfer function of the
  cascaded gratings can be computed as the product of the transfer functions of
  gratings. The word “isolated” is used here to identify that the reflected field of the FBG does not affect the operation of the previous FBG in the cascaded network. According to this discussion, the total reflection transfer function of the
  cascaded gratings can be expressed as
 | (31a) |
 is the field reflection transfer function of the
  FBG involves in the operation and
  is the optical frequency. Further, the magnitude and the phase of the total field reflection transfer function are expressed, respectively as
 | (31b) |
 | (31c) |
 seen by used cascaded FBGs is computed as
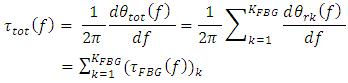 | (32) |
 represents the time delay associated with the reflection transfer function of the
  FBG evaluated at the optical frequency
  Note that(i) The total time delay is the accumulation of the individual time delays of the used FBGs calculated under isolation condition.(ii) When the used FBGs are identical, then
 and
and  where
where  and
and  correspond to a single FBG.(iii) If each FBG is designed to have 100% power reflection at the center frequency and -0.5dB bandwidth consideration, then the total power reflection evaluated at the FBG spectrum edges is 89.%, 79.4%, 70.8%, and 63.1% when
  = 1, 2, 3, and 4, respectively, This requires careful consideration to adapt the gains of the LNAs to compensate for the power reflection variation seen by the TSLs.(iv) For identical
  gratings, the steering angle becomes
 | (33a) |
 | (33b) |
 | (33c) |
 | (33d) |
 denotes ceil function which rounds up the argument to the next integer.(v) Using element spacing
  equals
  yields
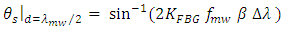 | (34a) |
 | (34b) |
 the required wavelength difference
  can be estimated the following expression
 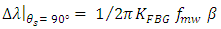 | (35a) |
 | (35b) |
 Optical SwitchThe
  optical switch can be designed using Mach-Zehnder (MZ) configuration and implemented using silicon photonic platform. Figure 6 shows a schematic of MZ switch which consists of an input optical coupler, interferometric MZ region, and an output optical coupler. The control voltage is applied across one of the MZ arms to change its refractive index and hence introducing propagation phase difference with respect to the other arm [23].
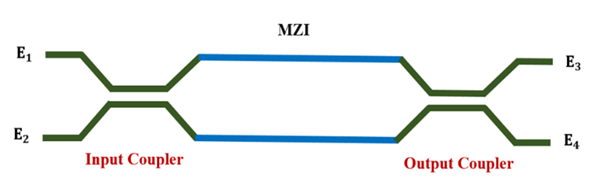 | Figure 6. Schematic of the  Mach-Zhender switch used in the proposed photonic delay line Mach-Zhender switch used in the proposed photonic delay line |
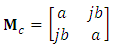 | (36) |
 and
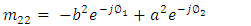
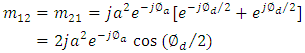
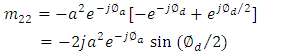
and  are, respectively, the bar and cross transmission coefficients of the coupler. The MZ interferometer (MZI) is assumed to have lossless arm waveguides and therefore, the transfer matrix
  which relates the output fields to the input fields will be determined by the propagation phases of the two arms
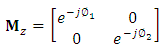 | (37) |
 and
and  are, respectively, the phases gained by the electric fields at the end of the upper and lower waveguides.If one assumes identical input and output couplers, the switch output fields
  and
and  are related to its input fields
  and
and  by
by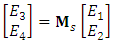 | (38a) |
 is the transfer function of the
  switch
 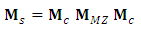 | (38b) |
 | (38c) |
 | (39a) |
 | (39b) |
 | (39c) |
 which corresponds to a 3dB-directionl coupler. Introducing
  and
and  as the phase average and difference, respectively, leads to
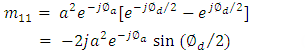 | (40a) |
 | (40b) |
 | (40c) |
 leads to
  . Recall that
  and this is independent of the condition
  . Consider now the following special operating states(i) Case I: No applied voltageIn this case,
  (assuming equal-length MZ arms). Then
  and
and  This corresponds to cross-state operation. Since the optical power is proportional to the absolute-value square if the electric field, then
  and
and  (ii) Case II: Voltage is applied to yield
  In this case
  and
and  This indicates bar-state operation which yields
 and
and  The insertion loss of the switch,
  , can be Compared from
 For the two special cases mentioned above,
  . Note that the loss of the directional coupler
 and this equals
  when
when  . For lossless coupler (i.e.,
  ) then
  . For lossy coupler,
  Note further that
  since the MZ waveguide arms are assumed lossless.
4. Performance Evaluation of Linearly Chirped FBG
- The time delay-wavelength characteristics of the proposed photonic delay line dependents on the reflection response of the used LCFBG. This section presents parametric study to characterize the time delay spectrum associated with the reflection transfer function of LCFBG operating with apodization profile and 1550 nm reference wavelength. The simulation results are obtained using the commercial software package "OptiGrating ver. 14-1". Initial simulation tests are performed to select the apodization profile suitable for efficient design of photonic.TTDL-based beam steering. The target is to get(i) Large time delay difference across the FBG spectrum bandwidth (which is denoted here by
 ).(ii) The time delay
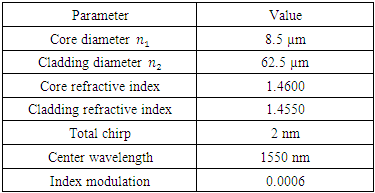
  varies linearly across the spectrum bandwidth without ripple.The initial simulation tests performed in this work have shown that modified Gaussian apodization (MGA) designed with, n = 4 and s = 0.7 offers the best time delay spectrum performance. The next apodization profile to be used is the Gaussian (GA) designed with s = 0.5. Therefore, the investigation in this section focuses only on these two apodization types. In the following, results are reported for MGZ-based FBG. Results related to Gaussian profile are given in the Appendix.The FBG structure parameters used in the simulation are chosen to match those of a standard single-mode fiber (SSMF), see Table 1. This is useful to achieve high coupling efficiency at the FBG / SSMF interface. The
  of the FBG is estimated to be 2.24 at
  nm using the expression
  [32]. Here
  is the core diameter,
  is the core refractive index, and
  is the cladding refractive index. Note that
  is lower than 2.405 which is the upper bound for single-mode operation. Unless otherwise started, the following parameters are used in the simulation: refractive index modulation
 total chirp
  and FBG length L= 80 mm.
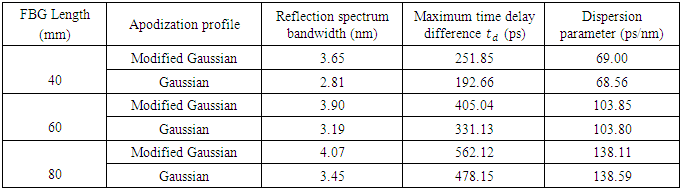
|
 Parts a and b of this figure describe the apodization profile and chirp profile, respectively. The variation of the grating refractive index modulation
  and grating period
  along the FBG length is displayed in Figure 7c. Note that the grating period decreases linearly with z (from
  nm at z = 0 to
  nm at z = L). The total chirp is
  and the chirp parameter
 nm/mm. Part d of Figure 7 shows the spectrum of both power reflection and transmission transfer functions. The reflectivity spectrum has a bandwidth
  nm at -0.5dB level and 0dB peak level at the center wavelength
  nm. The variation of the time delay across the reflectivity spectrum is presented in Figure 7e which shows a linear decrease with wavelength. The maximum time delay difference
  ps which yields a dispersion parameter
  ps/nm.
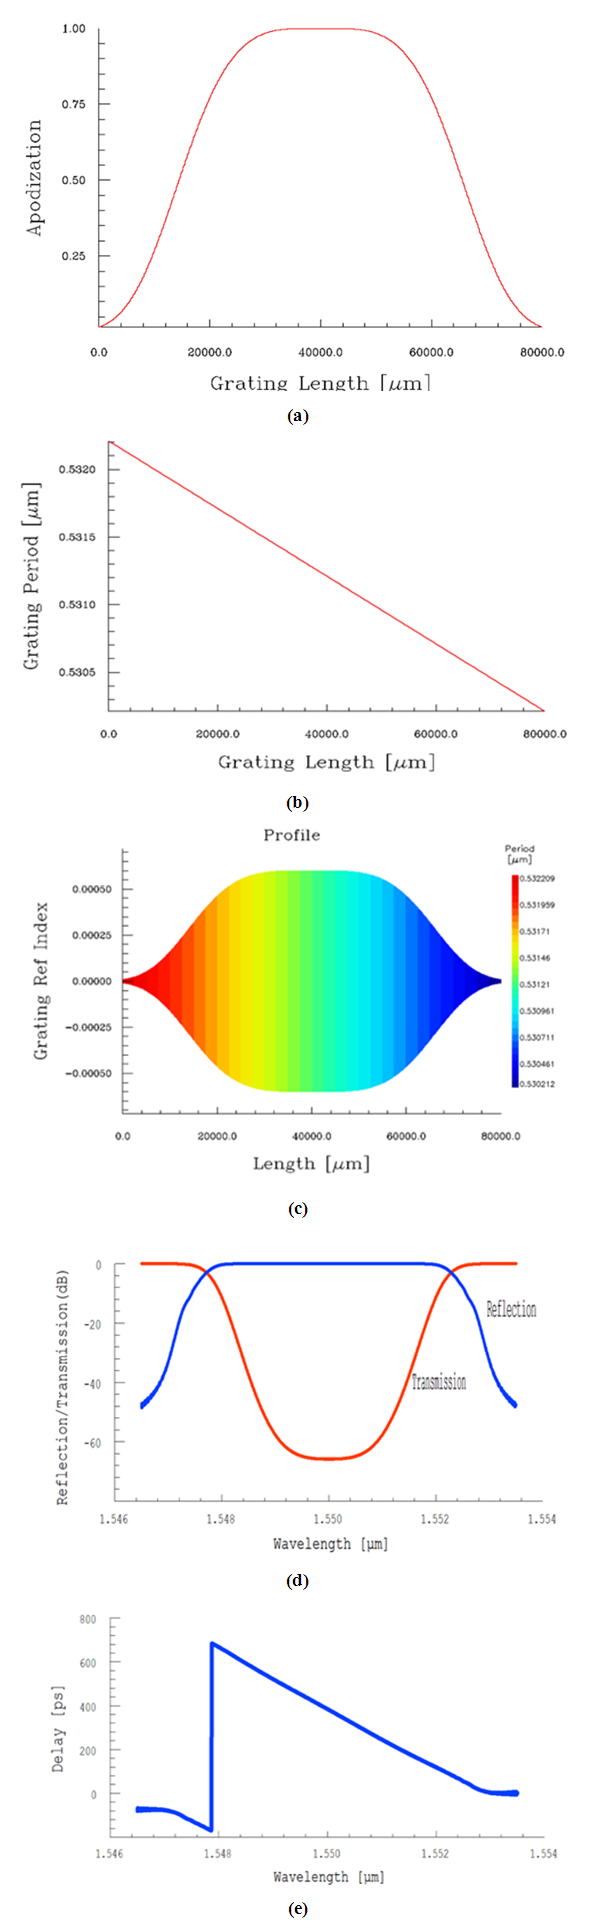 | Figure 7. Characteristics of 80 mm-LCFBG. (a) Apodization profile (b) Chirp profile. (c) Grating profile. (d) Spectrum of both power reflection and transmission transfer functions. (e) Spectrum of time delay |
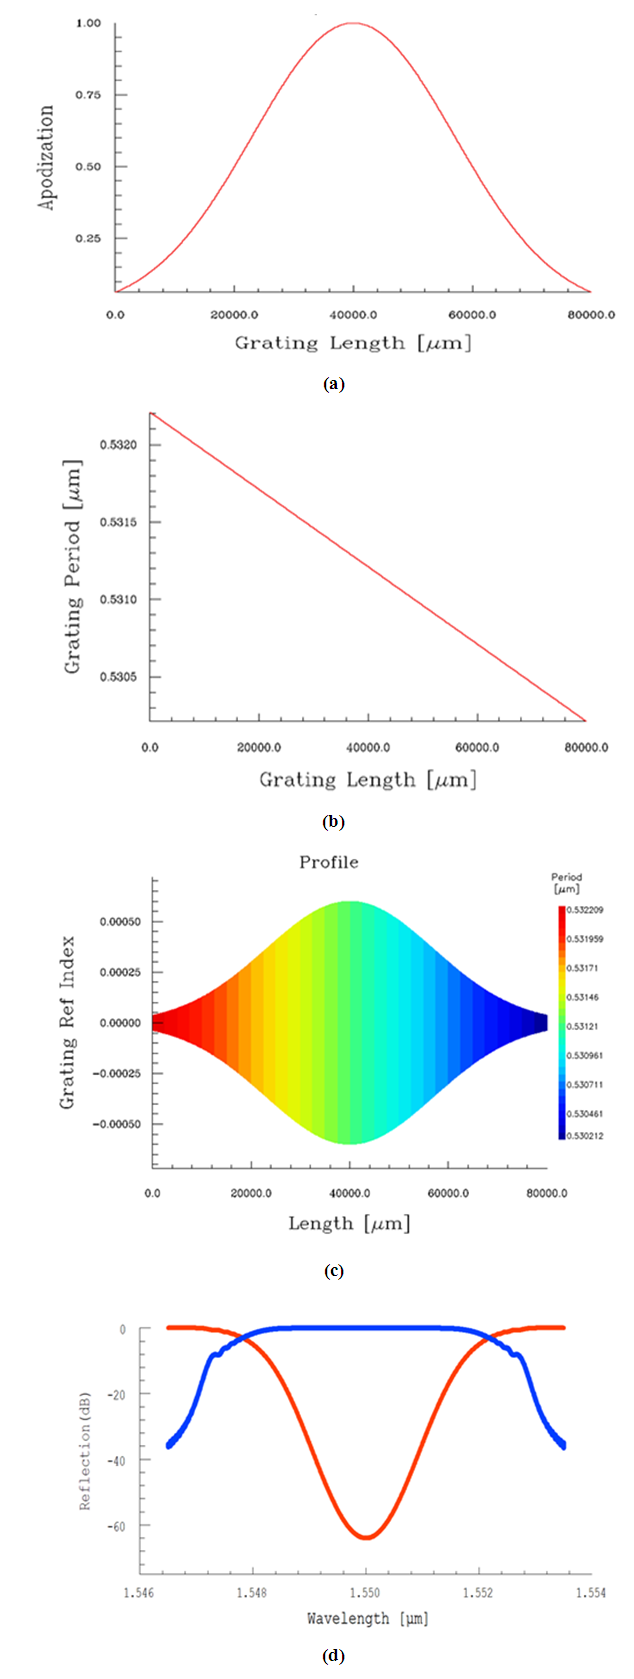
 and
and  ps over the reflectivity bandwidth
  and
and  respectively. The corresponding dispersion parameters
  are 69, 103.85 and 138.11 ps/nm, respectively.(ii) Increasing L to 100 and 120 nm destroys the linear
  characteristics and leads to two and three sections, respectively.
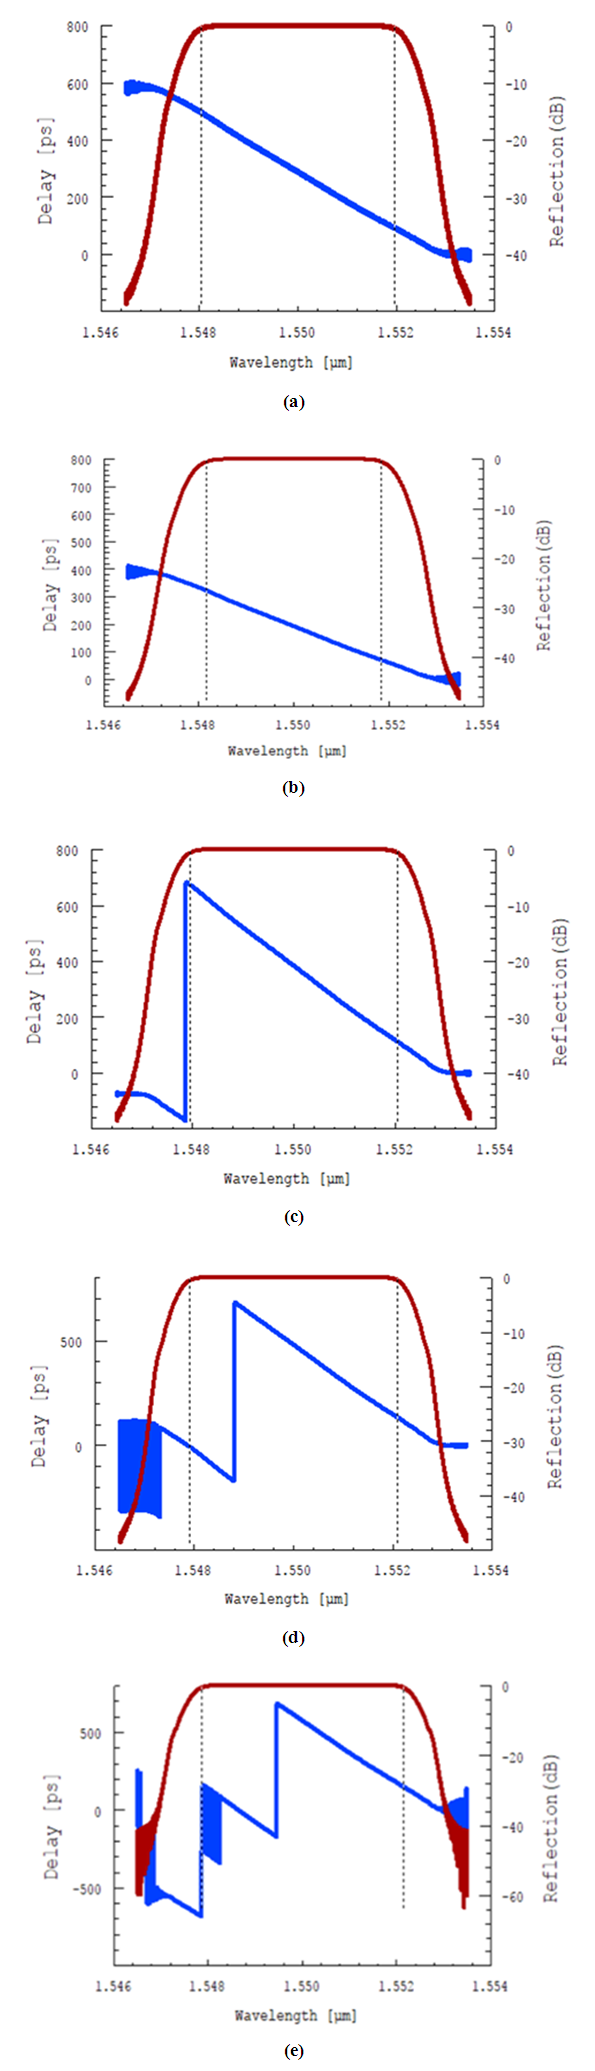 | Figure 8. Effect of FBG length on its power reflectivity and time delay spectrum (a) L= 40 mm (b) L= 60 mm (c) L= 80 mm (d) L= 100 mm (e) L= 120 mm.  Delay Delay  Reflection Reflection |
 and
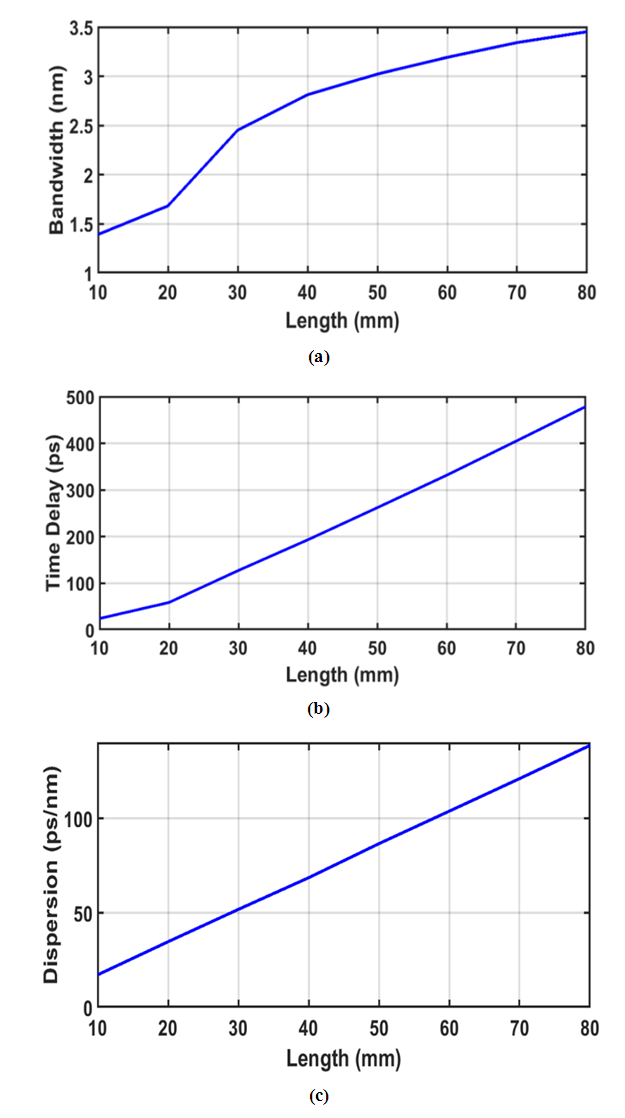
and  on FBG length is illustrated in Figures 9(a-c), respectively. At L = 95 nm, the
  characteristics becomes discontinuous and consists of two linear sections. The discontinuous multisession behavior remains for L
  95 nm. Therefore, the results in Figure 9 are presented for L
  90 mm. Note that spectrum bandwidth increases sublinearly with FBG length. In contrast, the parameter
  increases almost linearly with L and reaches a maximum value of 562.12 ps at L
  80 mm. Then
  decreases with L as L increases toward 90 mm. In the region of L
  80 mm, the
  relation can be fitted by the linear characteristics
  where
where  and L are measured in ps and mm, respectively. Further,
  ps and
 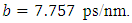 In other words,
  increases by about 7.8 ps for each 1 mm increase in the FBG length when L
  80 mm. Note further that the sublinear and linear variations of
  and
and  respectively, with L (for L
  80 mm region) makes the dispersion parameter
  an increasing function of L here. At L
  80 mm,
  approaches its maximum value of 562.12ps and
  equals 4.07 nm. This leads to
  ps/nm which represents the maximum dispersion parameter in the region of L
  80mm. Therefore, 80 mm-LCFBGs will be used later to design the beam-steering network. It is worth to mention here that the peak power reflectivity
  equals
  (85%)
(85%)  (98%), and 0dB (100%) at L
  10, 20, and
  30 mm, respectively.
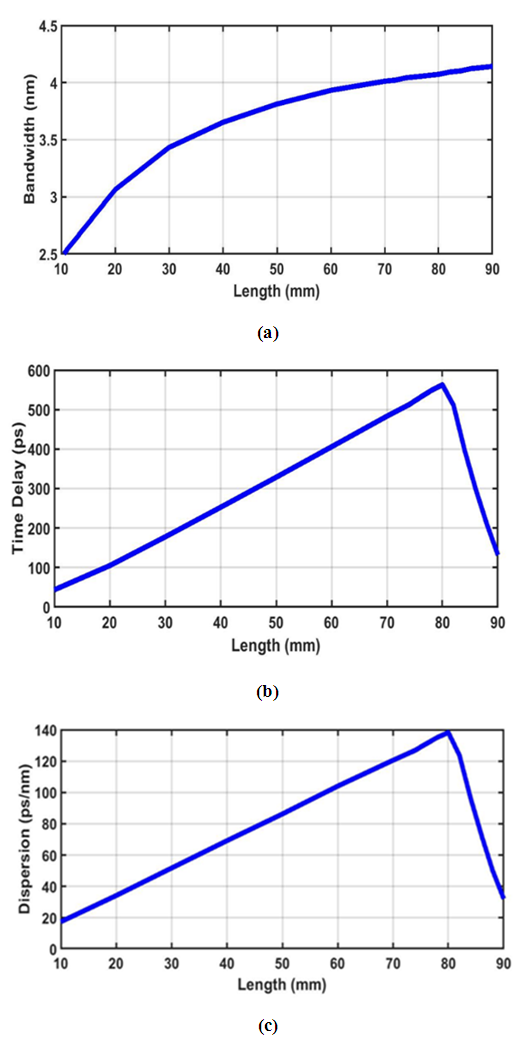 | Figure 9. Effect of FBG length on the (a) bandwidth (b) time delay (c) dispersion |
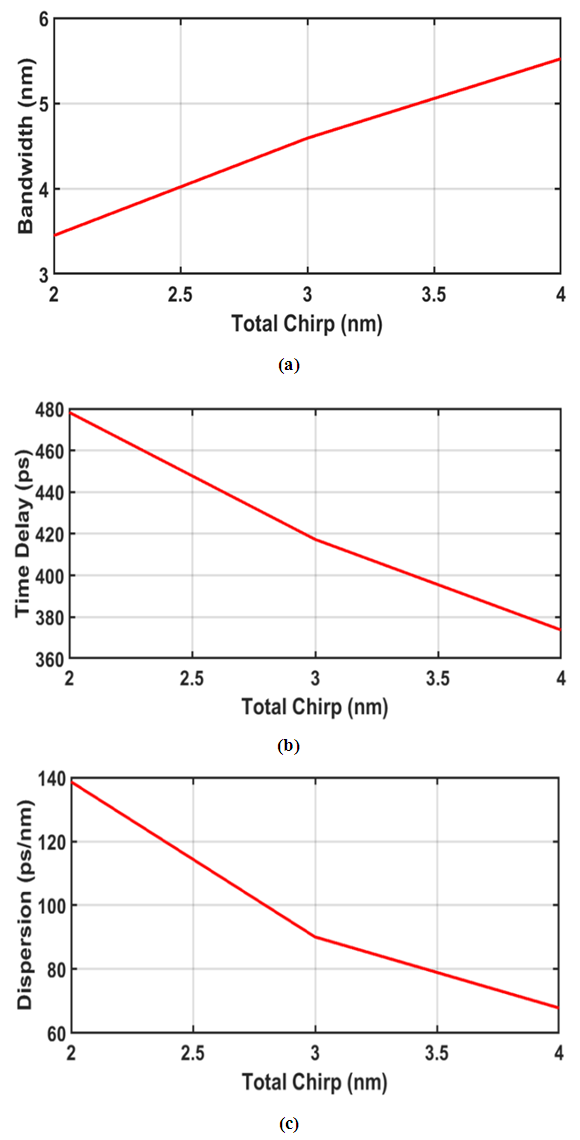
 increases linearly with the total chirp (slope
  1.74).(ii) The time delay difference
  decreases slightly and almost linearly with the total chirp (slope
  -50 ps/nm).(iii) The dispersion parameter decreases almost linearly with total chirp (slope
  -71 ps/nm).
 | Figure 10. Effective of total chirp of 80 mm-LFBG on the (a) bandwidth. (b) time delay. (c) dispersion |
 is used as a trade off between the two mentioned performance parameters,
  and
and  Table 2 lists performance comparison between two LCFBGs, one is designed with MGA
 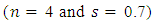 and the other is designed with GA
  The comparison results are presented for three FBG lengths (40, 60 and 80 mm). Other structure parameters used in the simulation are identical for both FBGs as given in Table 1. The simulation reveals that the peak power reflectivity is 0dB for all the cases considered here and therefore not listed in Table 2. Investigation the results in Table 2 highlights the following findings. Using MGA enhances both spectrum bandwidth
  and time delay
  almost by the same factor over GA. This leads to approximately the same dispersion parameter
  for the two apodization profiles. This enhancement factor is about 1.30, 1.22, and 1.18 for L = 40, 60, and 80 mm, respectively. From engineering point of view, one can say that MGA offers about 20-30% increase in both
  and
and  over GA and this leads to the same dispersion parameter
|
5. Conclusions
- A Configurable photonic true time delay line (TTDL) consisting of cascaded linearly chirped fiber Bragg grating (LCFBGs) has been proposed to support the design of PAA beam-steering networks. Parametric study of the designed LCFBG has been performed and the simulation results reveal that designing the LCFBG with modified Gaussian apodization (MGA) offers high-performance time delay characteristics. A LCFBG of 80mm length offers 562.12 ps time delay difference across the 4.07 nm spectrum spectral bandwidth. The length of the LCFBG should be chosen carefully to yield a linear time delay-optical wavelength characteristics. Designing the LCFBG with L>80 mm will destroys this linear relation.
Appendix Performance Parameters of LCFBG Design with Gaussian Apodization
 | Figure A1. Characteristics of 80 mm-LCFBG. (a) Apodization profile. (b) Chirp profile. (c) Grating profile. (d) Spectrum of both power reflection and transmission transfer functions |
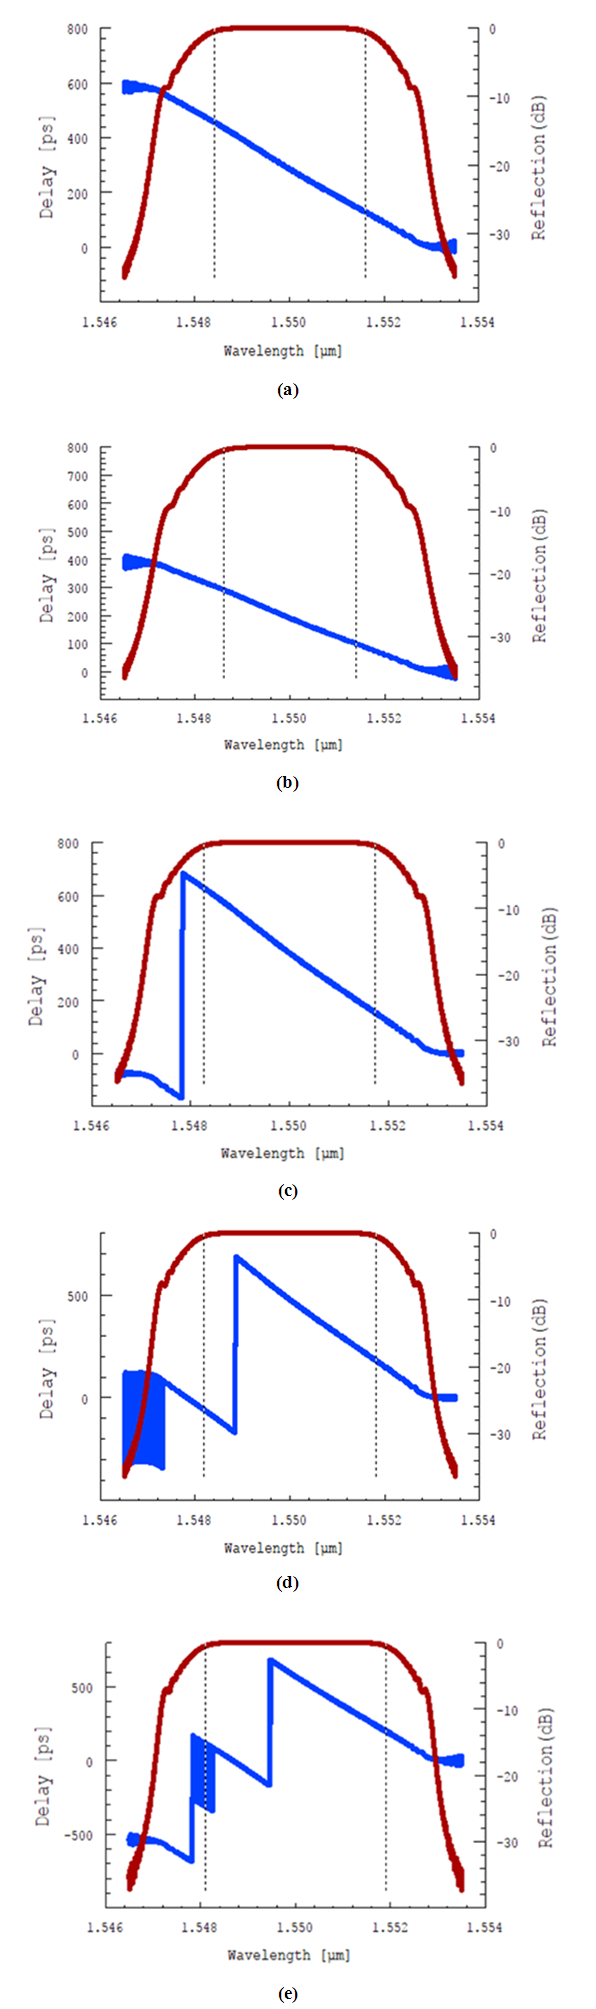 | Figure A2. Effect of FBG length on its power reflectivity and time delay spectra (a) L= 40 mm (b) L= 60 mm (c) L= 80 mm (d) L= 100 mm (e) L= 120 mm.  Delay Delay  Reflection Reflection |
 | Figure A3. Effect of FBG Length on the (a) bandwidth (b) time delay and (c) dispersion |
 | Figure A4. Effective of total chirp of 80 mm-LFBG on the (a) bandwidth (b) time delay and (c) dispersion |