-
Paper Information
- Paper Submission
-
Journal Information
- About This Journal
- Editorial Board
- Current Issue
- Archive
- Author Guidelines
- Contact Us
International Journal of Networks and Communications
p-ISSN: 2168-4936 e-ISSN: 2168-4944
2018; 8(3): 63-80
doi:10.5923/j.ijnc.20180803.02

Effect of Four-Wave Mixing on the Transmission Performance of O-Band Multichannel PAM-Based Unamplified Datacenter Interconnects
 Abstract
 Reference
 Full-Text PDF
 Full-text HTML
Duha S. Ahmed, Raad S. Fyath
Department of Computer Engineering, Al-Nahrain University, Baghdad, Iraq
Correspondence to: Duha S. Ahmed, Department of Computer Engineering, Al-Nahrain University, Baghdad, Iraq.
| Email: |  |
Copyright © 2018 The Author(s). Published by Scientific & Academic Publishing.
This work is licensed under the Creative Commons Attribution International License (CC BY).
http://creativecommons.org/licenses/by/4.0/

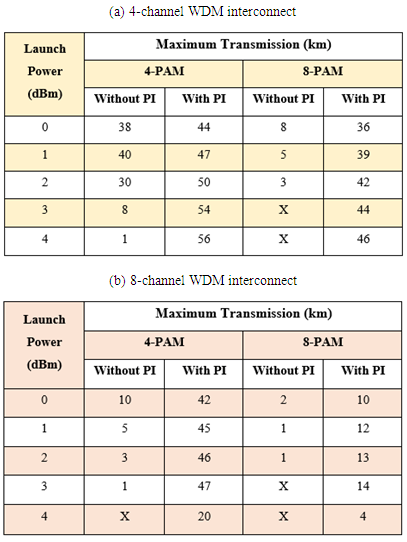
Optical links incorporating multilevel pulse amplitude modulation (PAM) with intensity modulation/direct detection (IM/DD) scheme have shown promising features when used as low-cost data center interconnects. This paper addresses the transmission performance of PAM-based wavelength division multiplexing (WDM) interconnect operating in the O-band with 112 Gbps channel data rate and 200 GHz channel spacing and without using optical amplification. The effect of four-wave mixing (FWM), associated with nonlinear fiber optics, on the transmission performance of the unamplified O-band PAM-WDM interconnect is investigated analytically. Simulation results, obtained using Optisystem ver. 15, are then presented for eight different Scenarios, namely 4-PAM 4WDM, 8-PAM 4WDM, 4-PAM 8WDM and 8-PAM 8WDM operating in the absence and presence of polarization interleaving (PI). The results reveal that using PI enhances the transmission performance of O-band PAM-WDM interconnects and this effect is more pronounced for 4-PAM system. At 0 dBm channel launch power, the maximum reach for the 4-PAM 8-WDM interconnect increases from 10 to 42 km by applying PI. These values are to be compared with 38 to 44 km, 8 to 36, and 2 to 10 km, for 4-PAM 4-WDM, 8-PAM 4-WDM, and 8-PAM 8-WDM, respectively.
Keywords: Intensity modulation/direct detection (IM/DD), Data center optical interconnects, Optical pulse amplitude modulation (PAM), Wavelength-division multiplexing (WDM), Four-wave mixing (FWM), Polarization interleaving (PI)
Cite this paper: Duha S. Ahmed, Raad S. Fyath, Effect of Four-Wave Mixing on the Transmission Performance of O-Band Multichannel PAM-Based Unamplified Datacenter Interconnects, International Journal of Networks and Communications, Vol. 8 No. 3, 2018, pp. 63-80. doi: 10.5923/j.ijnc.20180803.02.
Article Outline
1. Introduction
- Recently, there is exponential increase in traffic demand in optical networks to cover bandwidth hungry applications such social networking, cloud computing, and high definition TV and video [1-4]. This increasing demand has triggered different research groups to investigate the performance of high-speed datacenter interconnects implemented using high-order modulation formats and advanced multiplexing techniques [5-8]. The current 10 and 40 Gbps wavelength-division multiplexing (WDM) solutions employed in short-reach optical networks are not able successfully to keep up with the ever-growing demand [7]. Recent standardization works have been focused on delivering 100 and 400 Gbps alternatives for short-reach applications [9, 10]. Since cost and robustness are major concerns, intensity modulation/direct detection (IM/DD) technique (i.e., noncoherent technique) is strongly recommended for implementing these advanced interconnects over coherent techniques [11-14]. The main features of IM/DD technique are (i) Intensity modulation can be implemented efficiently using directly modulated laser (DML) [15-18] or externally modulated laser (EML) [13-19] without the need of in-phase quadrature-phases (IQ) optical modulator.(ii) Direct detection has advantages of low cost and easy integration compared with coherent detection. The DD needs one single-end photodiode (PD) and one analog-to-digital converter (ADC) [20, 21]. In contrast, coherent receiver requires complex hardware including local laser, to act as a local oscillator and should be synchronized with the transmitter laser, balanced PDs, and more than one ADC [22].Optical data center interconnects (DCIs) based on multilevel pulse modulation (M-PAM) technique have attracted increasing interest for short-reach applications [23, 24]. The main motivations behind this interest are (i) The optical M-PAM interconnect can be efficiently implemented using IM/DD communication system and hence gains the main advantages and merit behind this system.(ii) The PAM modulation is obtained using robust and low-cost modulator configurations based on either DML [25] or EML [26, 27]. The second configuration is also applicable for dual-polarization multiplexing (DPM) and can be used to double the transmission data rate compared with single-polarization (SP) counterpart.(iii) The PAM is less complex than other advanced modulation techniques used for short-reach applications such as orthogonal frequency-division multiplexing (OFDM) [28] and carrierless amplitude/phase (CAP) modulation [29] which can be implemented using IM/DD configuration. The OFDM and CAP modulation are more complex than PAM since OFDM uses fast Fourier transform (FFT) and inverse FFT while the CAP uses orthogonal filter pairs at the transmitter and receiver [30].Recently, there is increasing interest in PAM-based optical interconnects capable of carrying 100 Gbps and beyond data rates. These interconnects should match the requirements handled by 100 Gigabit Ethernet (GbE), 400 GbE, and 1 Terabit Ethernet (TbE) standards. Mardoyan et al. [31] demonstrated the transmission of 150 Gbps 8-PAM signal over 2 km of standard single-mode link (SSMF) and 100 Gbps 4-PAM signal over 4 km of SSMF. The link operates at 1550 nm wavelength without optical amplification. Working at longer distance at this wavelength requires careful equalization for the fiber chromatic dispersion (CD) which is around 17 ps/(nm.km) [32]. This encourages researches to use 1310 nm window, where CD is almost negligible, for transmission the data over the PAM-based interconnects. El-Fiky [23] demonstrated 168 Gbps single-carrier 4-PAM transmission over 10 km SSMF using O-band laser operating at 1325 nm. A 224 Gbps PDM 4-PAM transmission over 10 km SSMF was demonstrated at 1310 nm by Morsy-Osman without using optical amplifier [11].Wavelength-division multiplexing technique has been also applied to enhance the capacity of the PAM interconnected beyond 100 Gbps. For example, Eiselt [6] demonstrated 8×56.25 Gbps (400 Gbps) 4-PAM DCI operating over 80 km of SSMF at C-band. The link was supported by optical amplification and dispersion compensation fiber (DCF). The main challenge behind the use of WDM to enhance the capacity of PAM interconnect is fiber nonlinear optics. The dependence of fiber refractive index and optical intensity according to Kerr effect gives rises to different nonlinear process such as four-wave mixing (FWM). The effects of FWM on the performance of C-band WDM system, designed with 50 GHz (or more) channel spacing, is small due to the relative high fiber CD in this band which introduces phase mismatch between the four waveforms involved in this process. In contrast, FWM may degraded the performance of the O-band WDM where CD is almost negligible in this band. The aim of this paper is to address the possibility of using 4×112 Gbps and 8×112Gpbs WDM systems to enhance the capacity of unamplified 4- and 8-PAM O-band datacenter interconnects. The effect of fiber nonlinear optics on the transmission performance is addressed analytically and supported by simulation based on a Optisystem software ver. 15.
2. Investigation of FWM in O-Band WDM Interconnects
2.1. Background
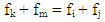
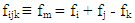
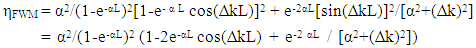
- Four-wave mixing is a nonlinear fiber process which occurs due to the dependence of fiber refractive index n on the intensity of the propagation waves according to Kerr effect [33]
 | (1) |
 | (2a) |
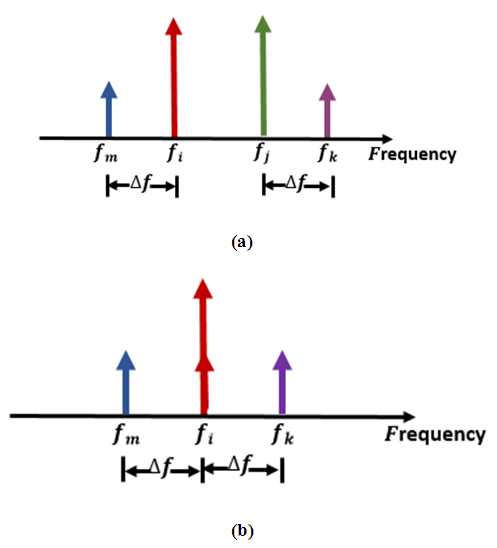 | Figure 1. Concepts of four-wave mixing (FWM) in the frequency domain (a) nondegenerate four-wave mixing (NDFWM) (b) degenerate four-wave mixing (DFWM) |
 | (2b) |
 | (3) |
 | (4) |
 | (5) |
 | (6) |
 | (7) |
 | (8) |
 | (9) |
 | (10) |
 | (11) |
 | (12) |
 | (13a) |
 | (13b) |
 | (14) |
2.2. Effect of Interconnect Parameters on FWM Efficiency
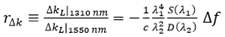
- This subsection presents results describing the effect of the dispersion parameters and length of the interconnect on the FWM efficiency. The calculations are performed for unamplified 4-PAM WDM link designed in the O-band with 200 GHz channel spacing to carry 112 Gbps per channel data rate. For comparison purposes, results related to C-band counterpart are also given.Figure 2 shows the dependence of ηFWM on the interconnect length for the 1550 nm system and taking the dispersion parameter D as an independent parameter and assuming αdB= 0.2 dB/km. The calculations are based on eqn. 13a and presented for three values of D, 1, 5, and 17 ps/(nm.km). The 17 ps/(nm.km) dispersion is related to a SSMF operating at 1550 nm window while 1 and 5 ps/(nm.km) dispersions are related to a SSMF designed with partially dispersion compensation scheme. Note that for this value of channel spacing (200 GHz), the effect of FWM is almost negligible when D = 17 and 5 ps/(nm.km) for all values of transmission distance. The statement is also true for D = 1 ps/(nm.km) and L > 5 km.
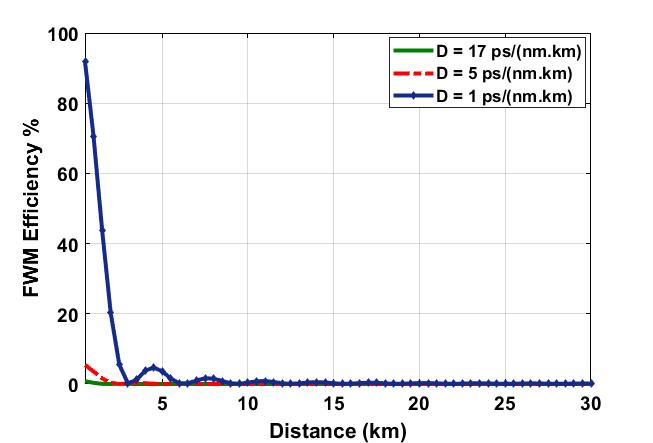 | Figure 2. Variation of FWM efficiency with fiber transmission length for the 1550 system |
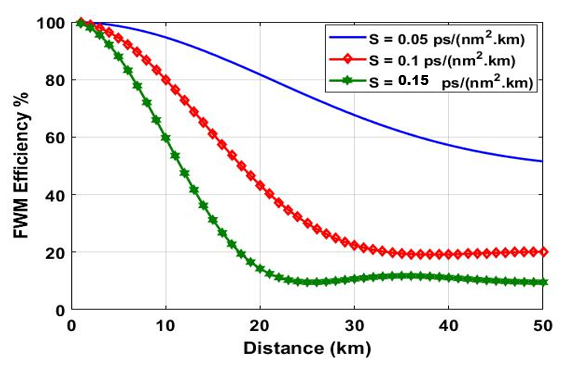 | Figure 3. Variation of ηFWM with transmission distance for the 1310 nm system |
 | (15) |
 | (16) |
 | (17a) |
 | (17b) |
 | (18a) |
 | (18b) |
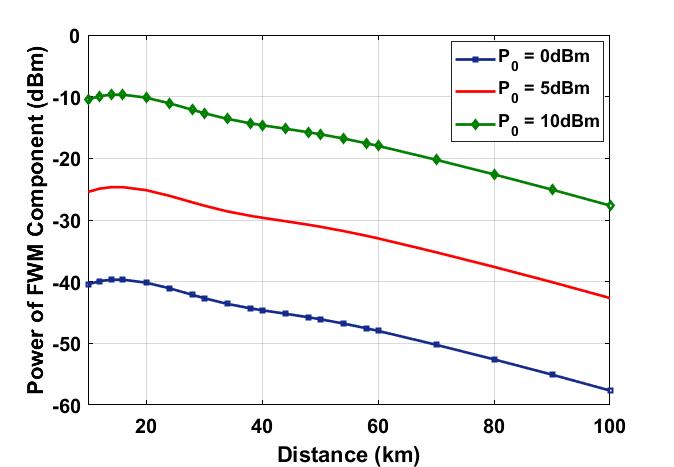 | Figure 4. Variation of FWM component power Pm with the fiber length at 1310 nm |
3. Design Issues for O-Band PAM WDM Interconnects
- This section discusses design issues and presents initial simulation transmission results for WDM interconnects incorporating 4- and 8-PAM modulation formats. The interconnects are designed for O-band operation with 200 GHz channel spacing to support the transmission of 112 Gbps data rate per channel. The results are presented for 4- and 8-channel WDM systems and give feasibility study on design DCIs to support 400 GbE and 800 GbE. The operation of each of the WDM channel is based on IM/DD scheme implemented using DML-based optical transmitter and unamplified SSMF link. The following results and related discussion focus on the effect of FWM on the transmission performance.As a starting point, which is useful for next discussion and comparison, the maximum transmission distance Lmax corresponding to a single-channel link is deduced as a function of channel launch power. The values of Lmax are estimated from the simulation when the receiver BER equals a threshold level (BERth) of 4.4×10⁻³. Recall that this BER limit represents the threshold of 7% overhead hard-decision (HD) forward error correction (FEC) code which yields 10-15 BER when the code is used. Figure 5 shows the dependence of Lmax on launch power for a single-channel link and presented for both 4- and 8-PAM systems. Note that Lmax increases almost linearly with launch power P0(dBm) with slope ≈ 2.75 km/dBm for both PAM formats. At a fixed launch power, the value of Lmax in the 4-PAM link exceeds that of the 8-PAM link by about 6-8 km. At P0 = 10 dBm, the 4- and 8-PAM links are able to transmit the 112 Gbps data over 73 and 66 km, respectively.
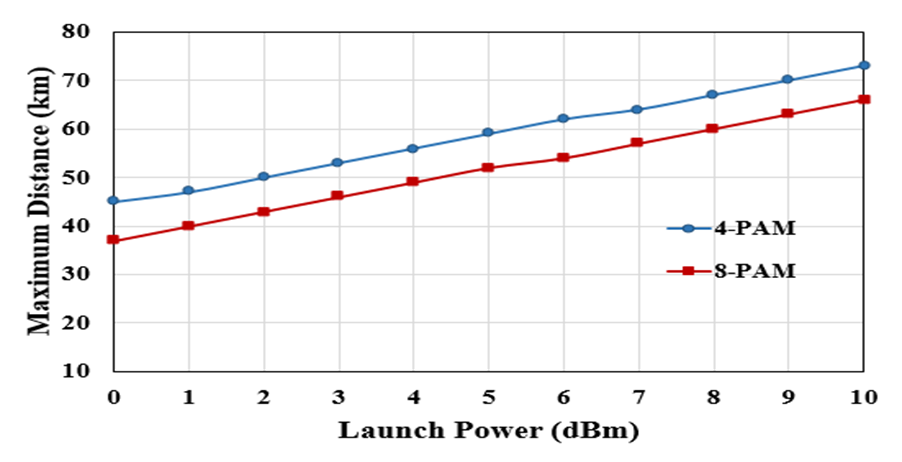 | Figure 5. Variation of maximum transmission distance with launch power for 112 Gbps single-channel PAM link |
3.1. WDM System Configuration
- Figure 6 shows a simplified block diagram for a PAM-based 4-channel WDM link. The multiplexer (MUX) and the demulitplexer (DEMUX) act as 4:1 wavelength combiner and 1:4 wavelength-selective splitters, respectively. The demultiplexer is simulated here using four parallel optical bandpass filters (OBPFs) whose center frequencies match the frequencies of the four unmodulated transmitter lasers. The lasers frequencies are selected according to the O-band WDM grid issued by ITU-T (International Telecommunication Union-Telecommunication Standardization Sector) [37]. The grid fixes the lasers frequencies that should be used with 50 GHz channel spacing and these frequencies are distributed symmetrically around central frequency (taken here as 228.85 THz which corresponds to λ = c/f = 1310.00 nm, where c = 299.8×10⁶ m/s is the speed of light in free space). The N-channel WDM system should be designed by selecting N frequencies from the grid with channel spacing n×50 GHz where n is a positive integer chosen to satisfy negligible crosstalk among the demultiplexer outputs.
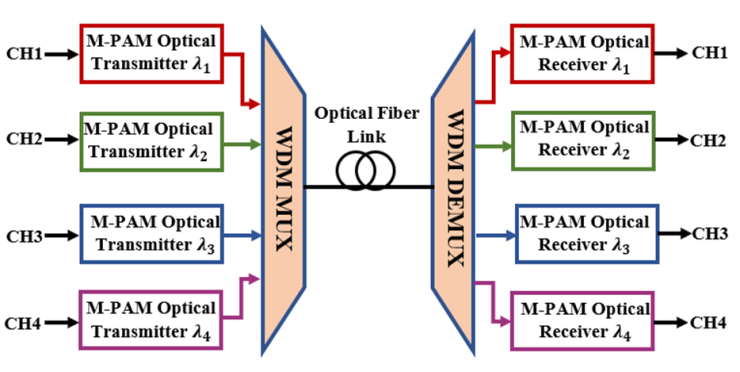 | Figure 6. Block diagram for PAM-based 4-channel WDM link |
 | (19) |
3.2. Initial Simulation Tests
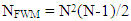
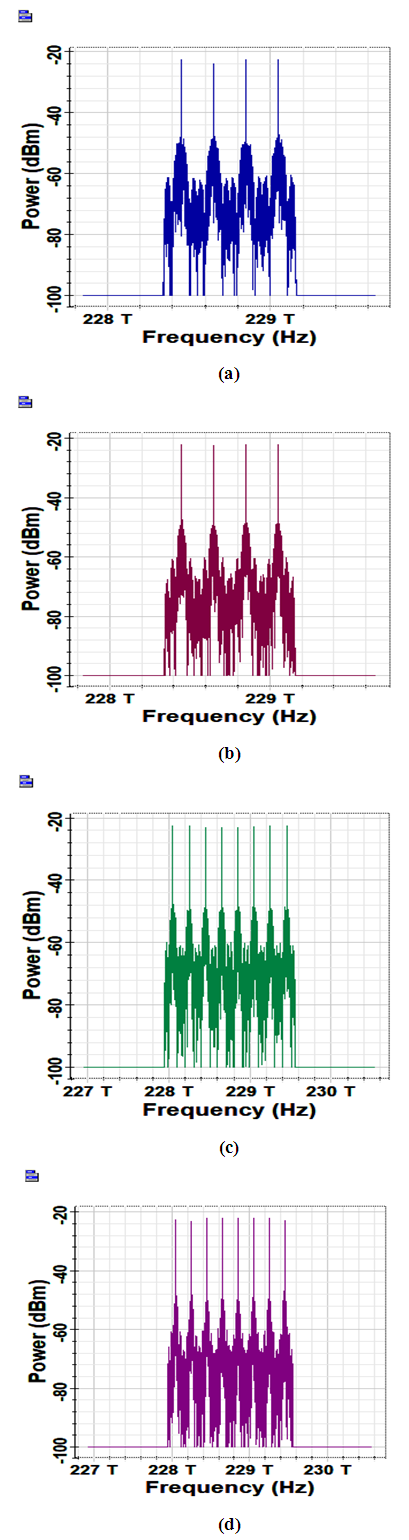
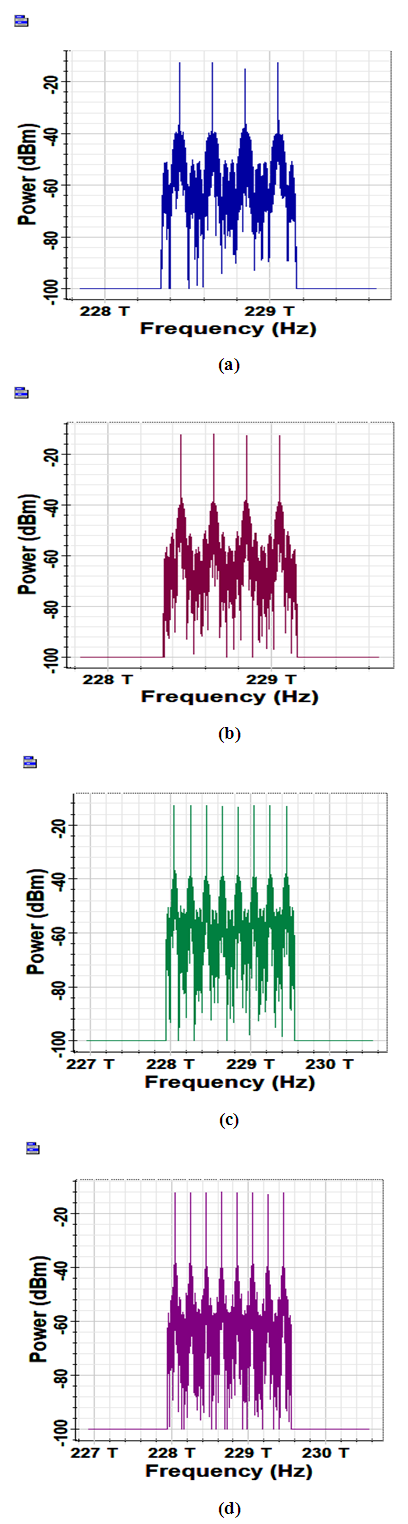
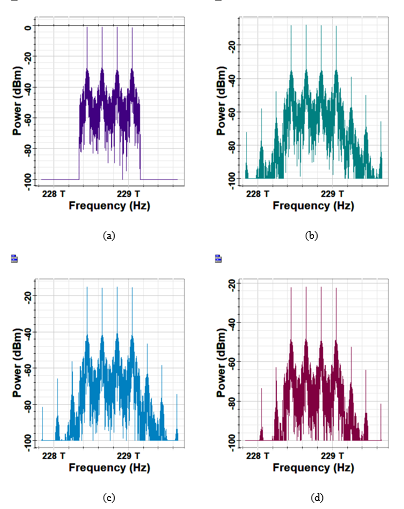
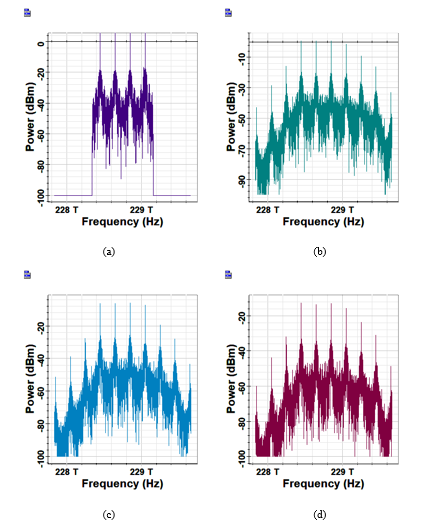
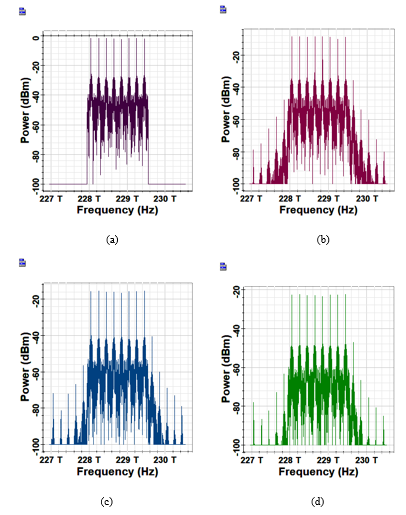
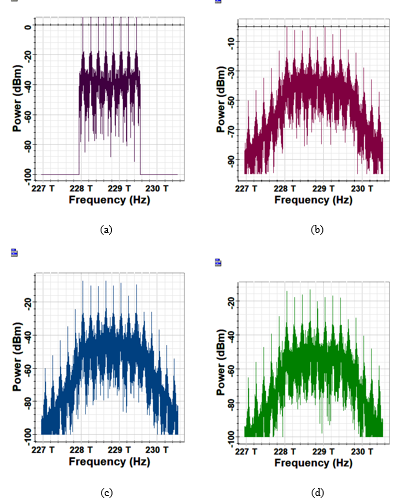
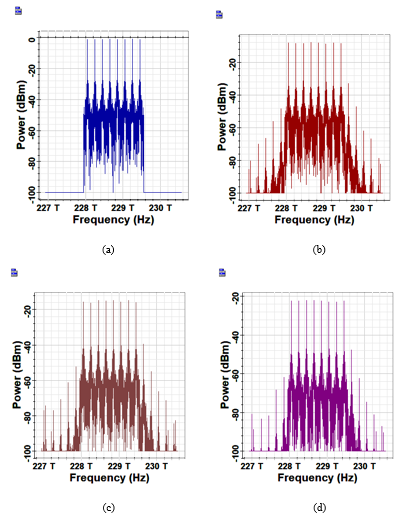
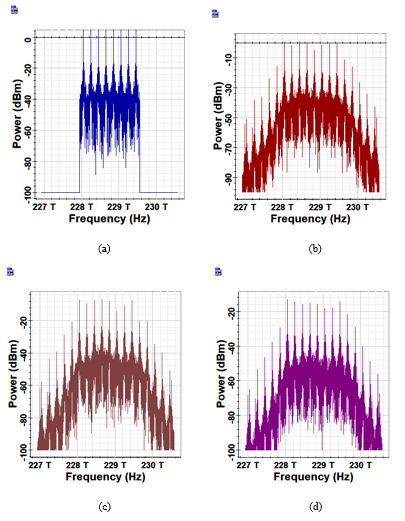
- Many simulation tests are performed to assess the dependence maximum transmission distance Lmax on channel launch power P0 for the 4- and 8-channel WDM links operating with 4- and 8-PAM modulation formats. The results (which will be shown in Section 4) indicate that two distinct regions can be seen in the Lmax-P0 plane. In the low power region, Lmax increases with increasing P0 but at a lower slope compared with single-channel transmission. In the second region, corresponding to high launch power, Lmax decreases with increasing P0. Careful investigation indicates clearly that the origin of this behavior is the nonlinear fiber optics and mainly due to FWM process. When the nonlinear refractive index parameter n2 in the used software is set to zero, the Lmax-P0 relation for both single-channel and WDM links become almost identical. Recall that n2 = 0 means that the fiber refractive index becomes intensity independent and therefore, Kerr effect vanishes. To get clear view about the effect of FWM, the spectra of the WDM waveforms at the multiplexer output and the fiber end are recorded for different operating conditions covering the following scenariosScenario A-4-4: 4-PAM 4-channel interconnectScenario A-8-4: 8-PAM 4-channel interconnectScenario A-4-8: 4-PAM 8-channel interconnectScenario A-8-8: 8-PAM 8-channel interconnect.There are also four ideal Scenarios covering the above operating conditions but without the effect of nonlinear fiber optics (i.e., n2=0) and denoted here by Scenarios B-4-4, B-8-4, B-4-8, and B-8-8, respectively.Figure 7 shows the waveforms spectra associated with Scenario A-4-4 (i.e., 4-PAM 4-channel link) when the channel launch power P0 equals 0 dBm and for three values of fiber length 20, 40, and 60 km. The simulation is repeated for P0 =10 dBm and the results are displayed in Fig. 8. The results related to the Scenarios A-8-4, A-4-8, A-8-8 are depicted in Appendix [Figs. (20 and 21), (22 and 23), and (24 and 25), respectively]. Results related to group B Scenarios (i.e., n2 = 0) are included in Figs. 9 and 10 for P0 equals 0 and 10 dBm, respectively. Comparing the results in Figs. 7, 8, and 20 to 25 highs light the following factsi. The level of the FWM component increases with launch power (which is an expected results) while the number of the generated FWM components are increasing function of both launch power and transmission distance which indicates the presence of cascaded FWM.ii. The above observation is more pronounced when number of channels and PAM order increase. In fact, increasing number of multiplexed channels means increasing the total optical intensity in the fiber core which enhances the nonlinear phenomenon further according to Kerr effect.
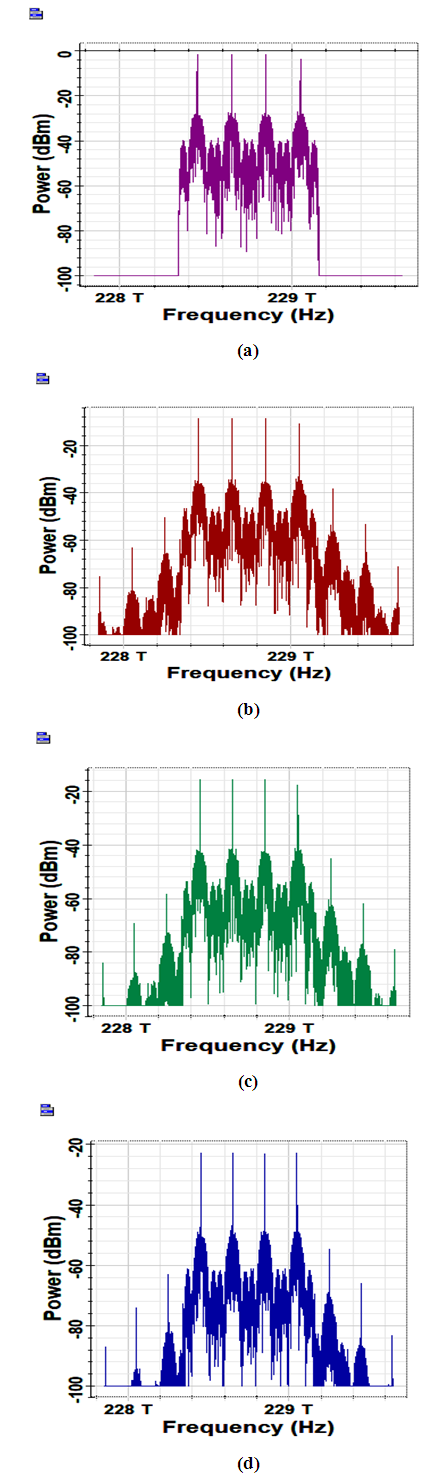 | Figure 7. Spectra corresponding to 4-PAM 4-channel WDM link operating with 0 dBm channel launch power (a) multiplex output (b)-(d) optical spectrum at the end of 20, 40, and 60 km fiber, respectively |
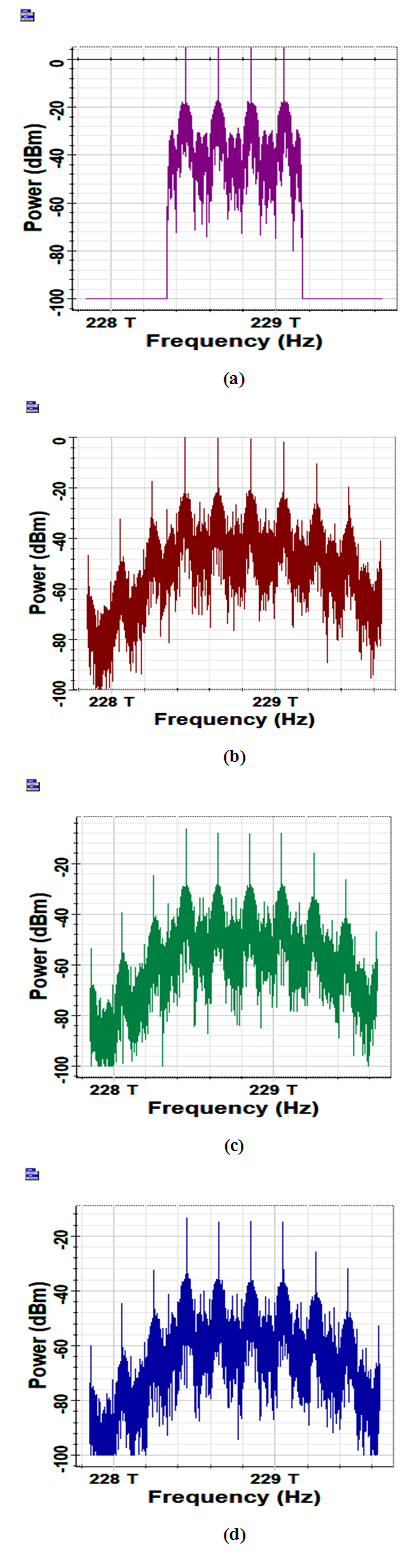 | Figure 8. Spectra corresponding to 4-PAM 4-channel WDM link operating with 10 dBm channel launch power (a) multiplex output (b)-(d) optical spectrum at the end of 20, 40, and 60 km fiber, respectively |
 | Figure 9. Received optical waveforms spectra corresponding to the four group B Scenarios. 60 km of fiber having n2 = 0 is used with 0 dBm channel launch power (a) 4-PAM 4-channel (b) 8-PAM 4-channel (c) 4-PAM 8-channel (d) 8-PAM 8-channel |
 | Figure 10. Received optical waveforms spectra corresponding to the four group B Scenarios. 60 km of fiber having n2 = 0 is used with 10 dBm channel launch power (a) 4-PAM 4-channel (b) 8-PAM 4-channel (c) 4-PAM 8-channel (d) 8-PAM 8 -channel |
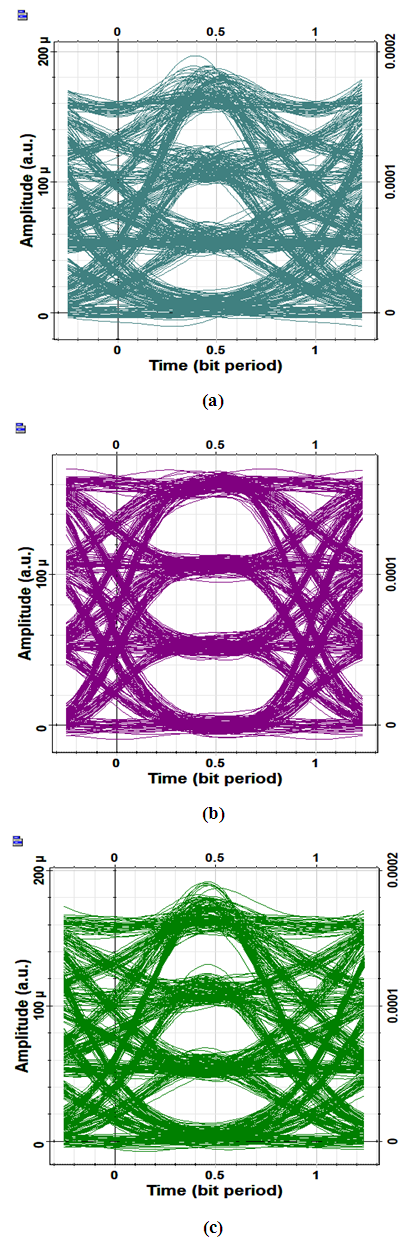
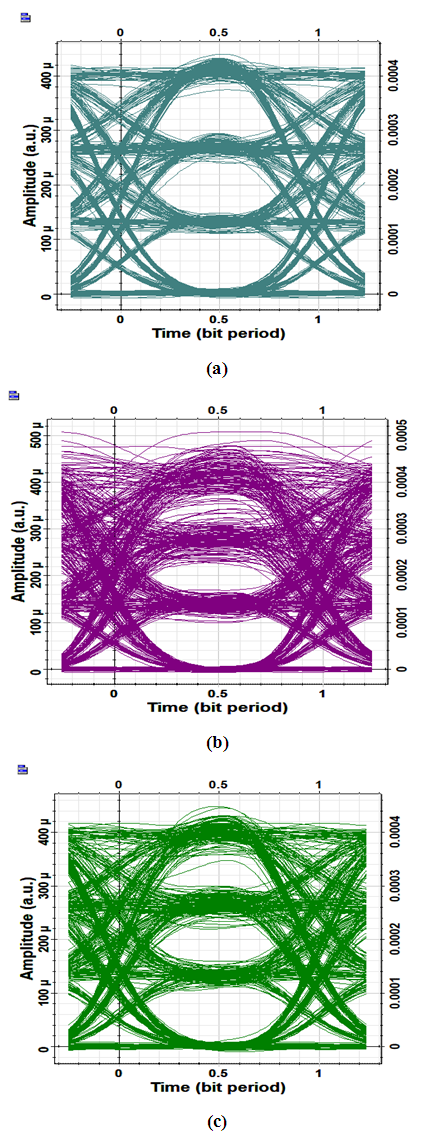 | Figure 11. Received eye diagrams for 4-PAM 8-channel link at 0 dBm launch power and 20 km transmission (a) Ch.1 (b) Ch.5 (c) Ch.8 |
 | Figure 12. Received eye diagrams for 4-PAM 8-channel link at 5 dBm launch power and 20 km transmission (a) Ch.1 (b) Ch.5 (c) Ch.8 |
 | Figure 13. Received eye diagrams for 4-PAM 8-channel link at 10 dBm launch power and 20 km transmission (a) Ch.1 (b) Ch.5 (c) Ch.8 |
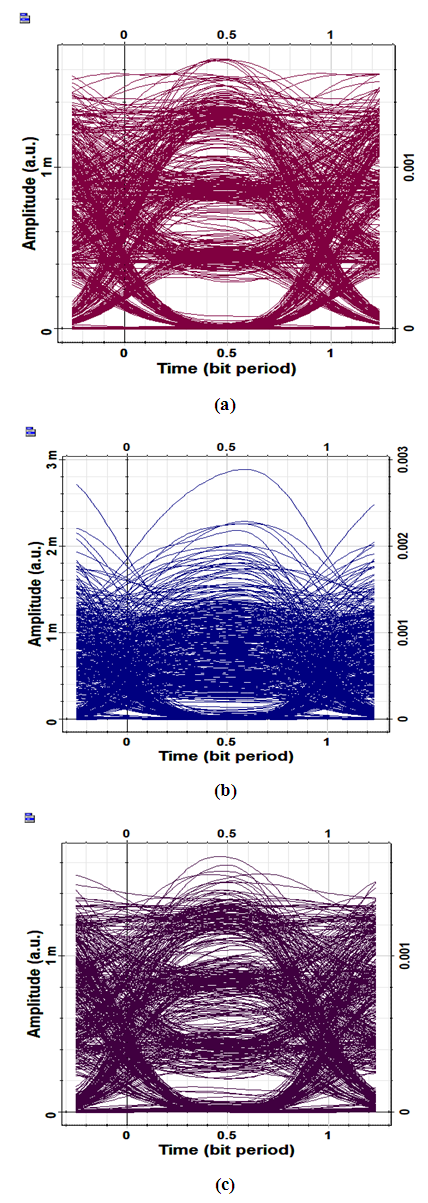
 | Figure 14. Eye diagrams corresponding to the transmission over 60 km of fiber having n2 = 0 and with 10 dBm launch power for 4-PAM 8-WDM (a) Ch.1 (b) Ch.5 (c) Ch.8 |
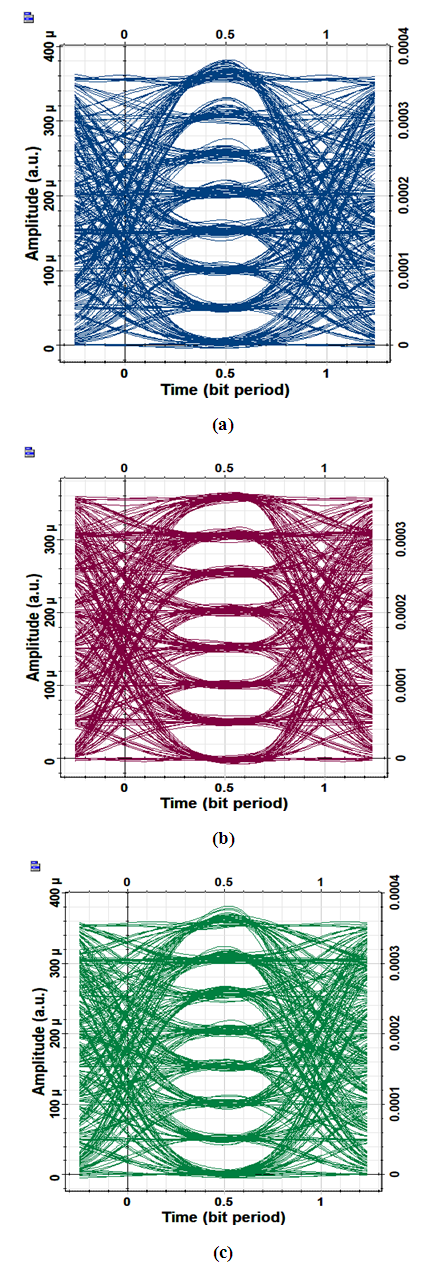 | Figure 15. Eye diagrams corresponding to the transmission over 60 km of fiber having n2 = 0 and with 10 dBm launch power for 8-PAM 8-WDM (a) Ch.1 (b) Ch.5 (c) Ch.8 |
4. Designing the PAM WDM Interconnect with Polarization Interleaving
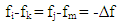
- It is well-know that most of the nonlinear mixing processes between two electromagnetic waves depend on the cross product of their polarization field vectors. Generally, the efficiency of the mixing process depends on cos(∆θP), where ∆θP is the phase difference between their polarization angles. Therefore, the effect of mixing vanishes when the two waves have orthogonal polarizations (i.e., ∆θP=0). These concepts have been already noticed in nonlinear fiber optics and the impact of interchannel nonlinear effects can be reduced considerably by ensuring that the neighboring channels are orthogonally polarized [38]. The same idea has been applied for high-bit rate long-haul optical communication systems to reduce interchannel nonlinearities [39, 40].In this work, the concept of polarization interleaving is applied to reduce the effects of fiber nonlinear optics on the performance of the designed PAM WDM interconnects. Two polarization interleaved (PI) WDM configurations are introduced here as shown in Figs. 16a and 16b. In Fig. 16a, a polarization controller (PC) is inserted at the output of each transmitter laser to control its state of polarization (SOP) before entering the multiplexer. The SOPs of the odd and even lasers should be orthogonal at the outputs of the polarization controllers. For example, in the 8-channel WDM link, the polarizations of the fields of lasers 1, 3, 5 and 7 are aligned in the x direction while the field polarizations of the lasers 2, 4, 6 and 8 are aligned in the y direction. This configuration is called here PI-WDM1 interconnect.
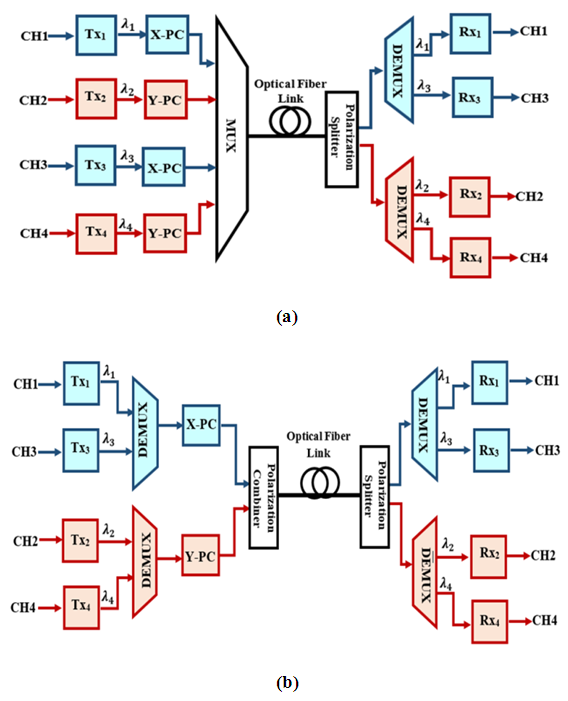 | Figure 16. Configurations of WDM interconnect with polarization controller (a) PI-WDM1 interconnect (b) PI-WDM2 interconnect. Tx: PAM optical transmitter, Rx: PAM optical receiver, X-PC and Y-PC: polarization controllers, X and Y denote X- and Y-Polarizations, respectively |
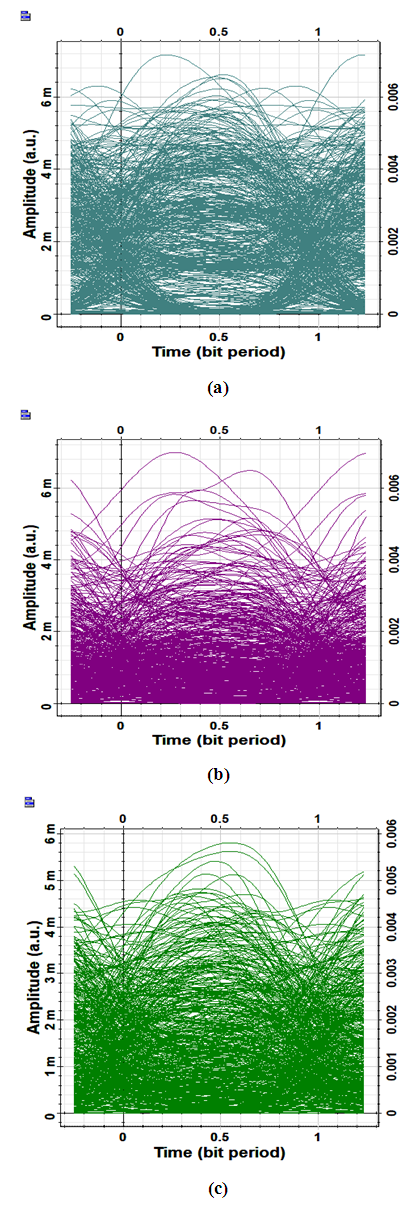
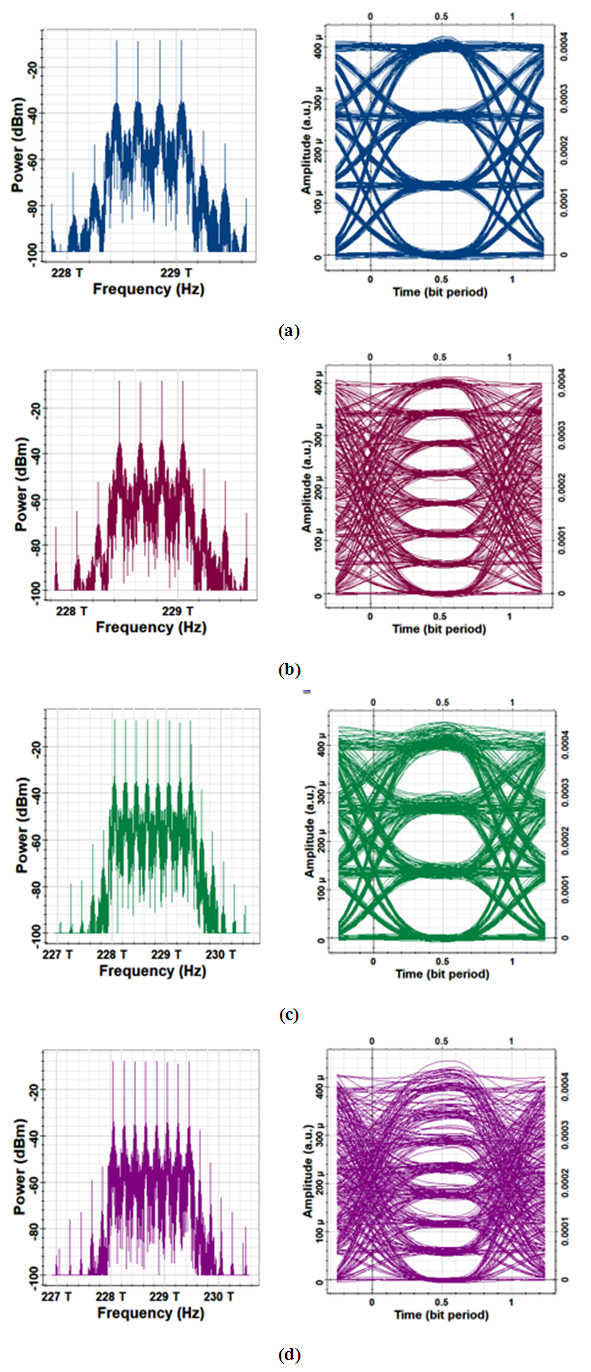 | Figure 17. Optical spectrum and central channel eye diagram for different interconnects simulated with 0 dBm channel launch power and 20 km transmission distance and using polarization interleaving (a) 4-PAM 8-WDM (b) 8-PAM 4-WDM (c) 4-PAM 8-WDM (d) 8-PAM 8-WDM. The central channels under observation are the third and fifth in 4- and 8-channel WDM link, respectively |
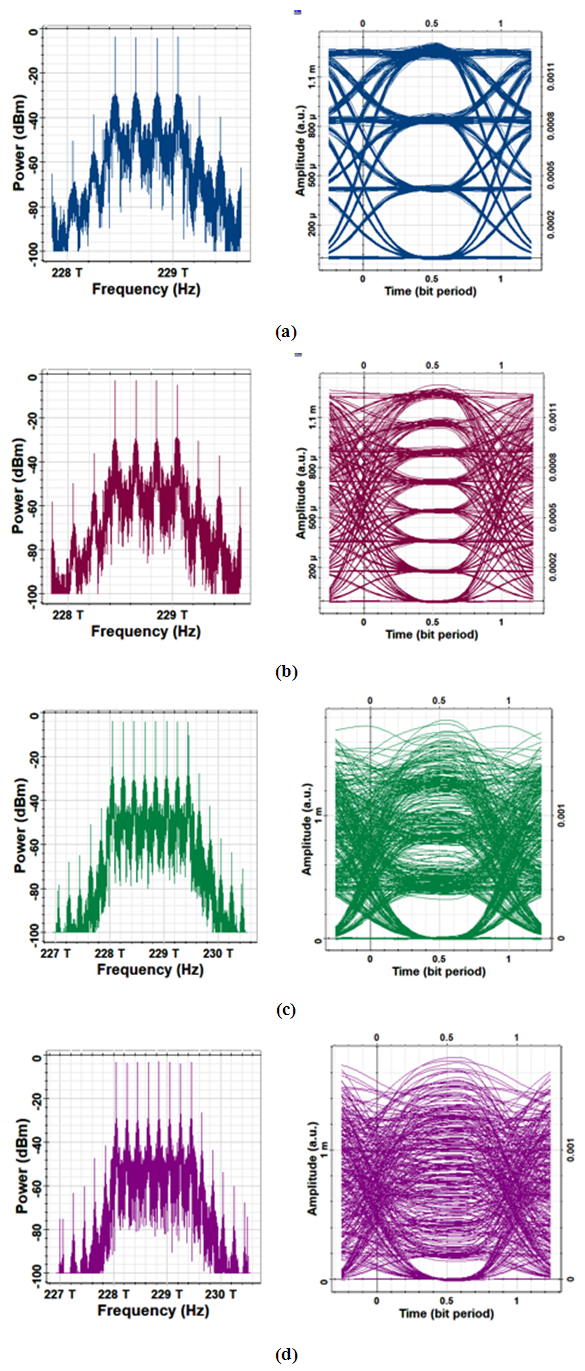 | Figure 18. Optical spectrum and central channel eye diagram for different interconnects simulated with 5 dBm channel launch power and 20 km transmission distance and using polarization interleaving (a) 4-PAM 8-WDM (b) 8-PAM 4-WDM (c) 4-PAM 8-WDM (d) 8-PAM 8-WDM. The central channels under observation are the third and fifth in 4- and 8-channel WDM link, respectively |
5. Summary of the Transmission Performance of the Designed O-Band PAM WDM Interconnects
- The simulation is carried further to deduce the variation of maximum transmission distance Lmax with channel launch power P0 for the designed WDM interconnects operating with and without polarization interleaving. The results are presented in Figs. 19a-d for the four interconnect described in group A Scenarios (namely, 4-PAM 4-WDM, 4-PAM 8-WDM, 8-PAM 4-WDM, and 8-PAM 8-WDM). Additional results corresponding to the ideal case when the effect of fiber nonlinear optics in neglected (i.e., n2 = 0) are also included in these figures for comparison purposes. Note that the transmission performance corresponding to n2 = 0 cases is independent of number of multiplexed channels and the results match that of a single-channel counterpart.
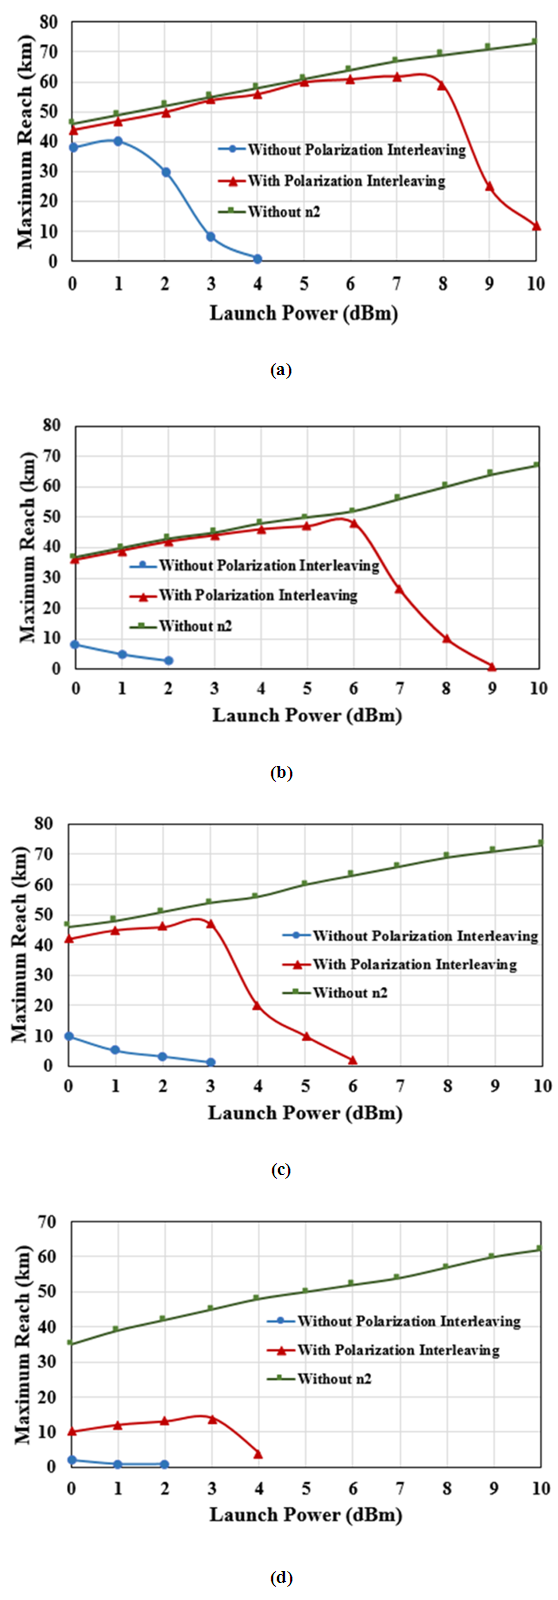 | Figure 19. Variation of maximum transmission with channel launch power for four different WDM interconnects (a) 4-PAM 4-WDM (b) 8-PAM 4-WDM (c) 4-PAM 8-WDM (d) 8-PAM 8-WDM |
|
6. Conclusions
- The transmission performance of unamplified 4×112 Gbps and 8×112 Gbps WDM-based data center interconnects has been investigated for O-band operation using 200 GHz channel spacing. The single WDM channel uses IM/DD scheme with 4- and 8-PAM modulation formats. The analytical and simulation results reveal that the effect of FWM on the performance of O-band WDM interconnect is more severe compared with C-band counterpart. The effect of FWM is more pronounced with 8-PAM 8-channel WDM interconnects compared with other PAM-WDM links. Polarization interleaving (PI) technique has been used to reduce the effect of FWM on the transmission performance of the WDM interconnects using PI with 0 dBm channel launch power increases the maximum reach Lmax to 44, 36, 42, and 10 km for 4-PAM 4-WDM, 8-PAM 4-WDM, 4-PAM 8-WDM, and 8-PAM 8-WDM interconnects, respectively. These values ate to be compared with 54, 44, 47, and 14 km, respectively, at 3 dBm launch power. The analysis and simulation results can be used as a guideline to design PAM–based O-band WDM interconnects. The work may be extended in the future to address the performance of 224 Gbps per channel PAM-WDM interconnects and to introduce 16-PAM modulation in the investigation.
Appendix
- Results related to the Scenarios A-8-4, A-4-8, A-8-8 for M-PAM WDM interconnects.
 | Figure 20. Spectra corresponding to 8-PAM 4-channel WDM link operating with 0 dBm channel launch power (a) multiplex output (b)-(d) optical spectrum at the end of 20, 40, and 60 km fiber, respectively |
 | Figure 21. Spectra corresponding to 8-PAM 4-channel WDM link operating with 10 dBm channel launch power (a) multiplex output (b)-(d) optical spectrum at the end of 20, 40, and 60 km fiber, respectively |
 | Figure 22. Spectra corresponding to 4-PAM 8-channel WDM link operating with 0 dBm channel launch power (a) multiplex output (b)-(d) optical spectrum at the end of 20, 40, and 60 km fiber, respectively |
 | Figure 23. Spectra corresponding to 4-PAM 8-channel WDM link operating with 10 dBm channel launch power (a) multiplex output (b)-(d) optical spectrum at the end of 20, 40, and 60 km fiber, respectively |
 | Figure 24. Spectra corresponding to 8-PAM 8-channel WDM link operating with 0 dBm channel launch power (a) multiplex output (b)-(d) optical spectrum at the end of 20, 40, and 60 km fiber, respectively |
 | Figure 25. Spectra corresponding to 8-PAM 8-channel WDM link operating with 10 dBm channel launch power (a) multiplex output (b)-(d) optical spectrum at the end of 20, 40, and 60 km fiber, respectively |
References
| [1] | J. Cai, H. G. Batshon, M. V. Mazurczyk, O. V. Sinkin, D. Wang, M. Paskov, W. W. Patterson, C. R. Davidson, P. C. Corbett, G. M. Wolter, T. E. Hammon, M. A. Bolshtyansky, D. G. Foursa and A. N. Pilipetskii, “70.46 Tb/s over 7,600 km and 71.65 Tb/s over 6,970 km transmission in C+L band using coded modulation with hybrid constellation shaping and non-linearity compensation,” IEEE Journal of Lightwave Technology, vol. 36, no. 1, pp. 114-121, Jan. 2018. |
| [2] | N. Suzuki, H. Miura, K. Matsuda, R. Matsumoto, and K. Motoshima, “100 Gb/s to 1 Tb/s based coherent passive optical network technology,” IEEE Journal of Lightwave Technology, vol. 36, no. 8, pp. 1485-1491, Apr. 2018. |
| [3] | K. Kimura, J. Nitta, M. Yoshida, K. Kasai, T. Hirooka, and M. Nakazawa, “Single-channel 7.68 Tbit/s, 64 QAM coherent Nyquist pulse transmission over 150 km with a spectral efficiency of 9.7 bit/s/Hz,” Optics Express, vol. 26, no. 13, pp. 17418- 17428, Jun. 2018. |
| [4] | D. Soma, Y. Wakayama, S. Beppu, S. Sumita, T. Tsuritani, T. Hayashi, T. Nagashima, M. Suzuki, M. Yoshida, K. Kasai, M. Nakazawa, H. Takahashi, K. Igarashi, I. Morita, and M. Suzuki, “10.16-Peta-B/s dense SDM/WDM transmission over 6-Mode 19-core fiber across the C+L band,” IEEE Journal of Lightwave Technology, vol. 36, no. 6, pp. 1362-1368, Mar. 2018. |
| [5] | Y. Hsu, C. Y. Chuang, X. Wu, G. H. Chen, C. W. Hsu, Y. C. Chang, C. W. Chow, J. Chen, Y. C. Lai, C. H. Yeh, and H. K. Tsang, “2.6 Tbit/s on-chip optical interconnect supporting mode-division-multiplexing and PAM-4 signal,” IEEE Photonics Technology Letters, vol. 30, no. 11, pp. 1052-1055, Jun. 2018. |
| [6] | N. Eiselt, J. Wei, H. Griesser, A. Dochhan, M. H. Eiselt, J. P. Elbers, J. J. V. Olmos, and I. T. Monroy, “Evaluation of real-time 8x56.25 Gb/s (400G) PAM-4 for inter-data center ap-plication over 80 km of SSMF at 1550 nm,” IEEE Journal of Lightwave Technology, vol. 35, no. 4, pp. 955-962, Feb. 2017. |
| [7] | C. Prodaniuc, N. Stojanovic, F. Karinou, Z. Qiang, and R. Llorente, “Performance comparison between 4D trellis coded modulation and PAM-4 for low-cost 400 Gbps WDM optical networks,” IEEE Journal of Lightwave Technology, vol. 34, no. 22, pp. 5308-5316, Nov. 2016. |
| [8] | S. Ohlendorf, S. Pachnicke, and W. Rosenkranz, “Multidimensional PAM with pseudo-gray coding for flexible data center interconnects,” IEEE Photonics Technology Letters, vol. 30, no. 12, pp. 1143-1146, Jun. 2018. |
| [9] | R. Rao, T. Fukui, R. Hirai, N. Kikuchi, “400GbE using Nyquist PAM4 for 2km and 10km PMD,” Oclaro, pp. 1-11, Sept. 2014. |
| [10] | G. Khanna, T. Rahman, E. D. Man, E. Riccardi, A. Pagano, A. C. Piat, S. Calabrò, B. Spinnler, D. Rafique, U. Feiste, H. D. Waardt, B. S. Krombholz, N. Hanik, T. Drenski, M. Bohn, and A. Napoli, “Single-carrier 400G 64QAM and 128QAM DWDM field trial transmission over metro legacy links,” IEEE Photonics Technology Letters, vol. 29, no. 2, pp. 189-192, Jan. 2017. |
| [11] | M. M. Osman, M. Chagnon, M. Poulin, S. Lessard, and D. V. Plant, “224-Gb/s 10-km transmission of PDM PAM-4 at 1.3 μm using a single intensity-modulated laser and a di-rect-detection MIMO DSP-based receiver,” IEEE Journal of Lightwave Technology, vol. 33, no. 7, pp. 1417-1424, Apr. 2015. |
| [12] | H. Mardoyan, M. A. Mestre, J. M. Estar´an, F. Jorge, F. Blache, P. Angelini, A. Konczykowska, M. Riet, V. Nodji-adjim, J. Dupuy, and S. Bigo, "84-, 100-, and 107-GBd PAM-4 intensity modulation direct-detection transceiver for datacenter interconnects", IEEE Journal of Lightwave Tech-nology, vol. 35, no. 6, pp. 1253-1259, Mar. 2017. |
| [13] | P. Dong, A. Maho, R. Brenot, Y. K. Chen, and A. Melikyan, “Directly reflectivity modulated laser,” IEEE Journal of Lightwave Technology, vol. 36, no. 5, pp. 1255-1261, Mar. 2018. |
| [14] | E. E. Fiky, M. Osman, M. Sowailem, A. Samani, D. Patel, R. Li, M. G. Saber, Y. Wang, N. Abadia, Y. D’mello, and D. V. Plant, “200 Gb/s transmission using a dual-polarization O-Band silicon photonic intensity modulator for Stokes vector direct detection applications,” Optics Express, vol. 25, no. 24, pp. 30336 - 30348, Nov. 2017. |
| [15] | F. Karinou, C. Prodaniuc, N. Stojanovic, M. Ortsiefer, A. Daly, R. Hohenleitner, B. Kögel, and C. Neumeyr “Directly PAM-4 modulated 1530-nm VCSEL enabling 56 gb/s/ λ data-center interconnects”, IEEE Photonics Technology Letters, vol. 27, no. 17, pp. 1872-1875, Sept. 2015. |
| [16] | J. C. Cartledge and A. S. Karar, “100 Gb/s intensity modulation and direct detection,” IEEE Journal of Lightwave Technology, vol. 32, no. 16, pp. 2809-2814, Aug. 2014. |
| [17] | F. Gao, S. Zhou, X. Li, S. Fu, L. Deng, M. Tang, D. Liu, and Q. Yang, “2 × 64 Gb/s PAM-4 transmission over 70 km SSMF using O-band 18G-class directly modulated lasers (DMLs),” Optics Express, vol. 25, no. 7, pp. 7230-7237, Apr. 2017. |
| [18] | Y. Wan, D. Inoue, D. Jung, J. C. Norman, C. Shang, A. C. Gossard, and J. E. Bowers, “Directly modulated quantum dot lasers on silicon with a milliampere threshold and high temperature stability,” Photonics Research, vol. 6, no. 8, pp. 776-781, Aug. 2018. |
| [19] | J. P. V. Engelen, L. Shen, G. Roelkens, Y. Jiao, M. K. Smit, and J. J. G. M. V. D. Tol, “A novel broadband elec-tro-absorption modulator based on bandfilling in n-InGaAs: design and simulations,” IEEE Journal of Selected Topics in Quantum Electronics, vol. 24, no. 1, Article no. 3300108, Jan/Feb. 2018. |
| [20] | Y. Zhu, K. Zou, Z. Chen, and F. Zhang, “224 Gb/s optical carrier-assisted Nyquist 16-QAM half-cycle single-sideband direct detection transmission over 160 km SSMF,” IEEE Journal of Lightwave Technology, vol. 35, no. 9, pp. 1557-1565, May 2017. |
| [21] | Z. Li, M. S. Erkılınc, K. Shi, E. Sillekens, L. Galdino, T. Xu, B. C. Thomsen, P. Bayvel, and R. I. Killey, “Digital linearization of direct-detection transceivers for spectrally efficient 100 Gb/s/λ WDM metro networking,” IEEE Journal of Lightwave Technology, vol. 36, no. 1, pp. 27-36, Jan. 2018. |
| [22] | K. Zou, Y. Zhu, and F. Zhang, “800 Gb/s (8×100 Gb/s) Nyquist half-cycle single-sideband modulation direct-detection transmission over 320 km SSMF at C-band,” IEEE Journal of Lightwave Technology, vol. 35, no. 10, pp. 1900-1905, May 2017. |
| [23] | E. El-Fiky, M. Chagnon, M. Sowailem, A. Samani, M. M. Osman, and D. V. Plant, “168-Gb/s single carrier PAM4 transmission for intra-data center optical interconnects,” IEEE Photonics Technology Letters, vol. 29, no. 3, pp. 314-317, Feb. 2017. |
| [24] | M. R.T. Tan, P. Rosenberg, W. V. Sorin, B. Wang, S. Mathai, G. Panotopoulos, and G. Rankin, “Universal photonic interconnect for data centers,” IEEE Journal of Lightwave Technology, vol. 36, no. 2, pp. 175-180, Aug. 2017. |
| [25] | X. Miao, M. Bi, Y. Fu, L. Li, and W. Hu, “Experimental study of NRZ, duobinary, and PAM-4 in O-band DML-based 100G-EPON,” IEEE Photonics Technology Letters, vol. 29, no. 17, pp. 1490-1493, Sept. 2017. |
| [26] | H. Y. Chen, N. Kaneda, J. Lee, J. Chen, and Y. K. Chen, “Optical filter requirements in an EML-based single-sideband PAM4 intensity-modulation and direct-detection transmission system,” Optics Express, vol. 25, no. 6, pp. 5852- 5860, May 2017. |
| [27] | X. Pang, O. Ozolins, S. Gaiarin, A. Kakkar, J. R. Navarro, M. I. Olmedo, R. Schatz, A. Udalcovs, U. Westergren, D. Zibar, S. Popov, and G. Jacobsen, “Experimental study of 1.55-μm EML-based optical IM/DD PAM-4/8 short reach systems,” IEEE Photonics Technology Letters, vol. 29, no. 6, pp. 523-526, Mar. 2017. |
| [28] | F. Li, X. Li, L. Chen, Y. Xia, C. Ge, and Y. Chen, “High-level QAM OFDM system using DML for low-cost short reach optical communications,” IEEE Photonics Technology Letters, vol. 26, no. 9, pp. 941-944, May 2014. |
| [29] | M. M. Osman, F. Fresi, E. Forestieri, M. Secondini, L. Potì, F. Cavaliere, S. Lessard, and D. V. Plant, “50 Gb/s short-reach interconnects with DSPfree direct-detection enabled by CAPS codes,” Optics Express, vol. 26, no. 14, pp. 17916 - 17926, Jul. 2018. |
| [30] | J. Tang, J. He, D. Li, M. Chen, and L. Chen, “64/128-QAM half-cycle subcarrier modulation for short-reach optical communications,” IEEE Photonics Technology Letters, vol. 27, no. 3, pp. 284-287, Feb. 2015. |
| [31] | H. Mardoyan, M. A. Mestre, R. Rios-M¨uller, A. Konczy-kowska, J. Renaudier, F. Jorge, B. Duval, J. Y. Dupuy, A. Ghazisaeidi, Ph. Jennev´e, M. Achouche, and S. Bigo, “Single carrier 168-Gb/s line-rate PAM direct detection transmission using high-speed selector power DAC for optical intercon-nects”, IEEEE Journal of Lightwave Technology, vol. 34, no. 7, pp. 1593-1598, Apr. 2016. |
| [32] | N. Stojanovic, F. Karinou, Z. Qiang, and C. Prodaniuc, “Volterra and wiener equalizers for short-reach 100G PAM-4 applications,” IEEEE Journal of Lightwave Technology, vol. 35, no. 21, pp. 4583-4594, Nov. 2017. |
| [33] | G. P. Agrawal, “Nonlinear Fiber Optics,” 5th Edition, Academic Press, New York, USA, 2013. |
| [34] | G. P. Agrawal, “Lightwave technology: Telecommunication systems,” John Wiley, New York, USA, 2005. |
| [35] | T. M. Bazan, “Impact of FWM on the performance of 2-D time-wavelength OCDMA systems,” IEEE Journal of Lightwave Technology, vol. 35, no. 14, pp. 2846-2852, Jul. 2017. |
| [36] | C. J. McKinstrie and M. Karlsson, “Effects of polarization-mode dispersion on degenerate four-wave mixing,” IEEE Journal of Lightwave Technology, vol. 35, no. 19, pp. 4210-4218, Oct. 2017. |
| [37] | J. Zyskind and A. Srivastava, “Optically amplified WDM networks,” 1st Edition, Elsevier Science, USA, 2011. |
| [38] | J. X. Cai, H. G. Batshon, M. V. Mazurczyk, O. V. Sinkin, D. Wang, M. Paskov, C. R. Davidson, W. W. Patterson, A. Turukhin, M. A. Bolshtyansky, and D. G. Foursa, “51.5 Tb/s capacity over 17,107 km in C+L bandwidth using single-mode fibers and nonlinearity compensation,” IEEE Journal of Lightwave Technology, vol. 36, no. 11, pp. 2135-2141, Jun. 2018. |
| [39] | H. J. Abd, N. M. Dinl, M. H. AI-Mansoori, F. Abdullahl and H. A. Fadhie, “Mitigation of FWM crosstalk in WDM system using polarization interleaving technique,” IEEE 4th International Conference on Photonics, pp. 117-119, Dec. 2013. |
| [40] | T. M. F. Alves and A. V. T. Cartaxo, “Analytical characterization of four wave mixing effect in direct-detection double-sideband OFDM optical transmission systems,” Optics Express, vol. 22, no. 7, pp. 8598-8616, Apr. 2014. |