-
Paper Information
- Paper Submission
-
Journal Information
- About This Journal
- Editorial Board
- Current Issue
- Archive
- Author Guidelines
- Contact Us
International Journal of Networks and Communications
p-ISSN: 2168-4936 e-ISSN: 2168-4944
2016; 6(3): 39-48
doi:10.5923/j.ijnc.20160603.01

Performance Comparison of the Standard Transmitter Energy Detector and an Enhanced Energy Detector Techniques
 Abstract
 Reference
 Full-Text PDF
 Full-text HTML
Fikreselam Gared Mengistu1, Mohammed Abd-Tuko2
1Bahir Dar Institute of Technology, Bahir Dar University, Ethiopia
2Department of Electrical and Computer Engineering, Addis Ababa Institute of Technology, Addis Ababa University, Ethiopia
Correspondence to: Mohammed Abd-Tuko, Department of Electrical and Computer Engineering, Addis Ababa Institute of Technology, Addis Ababa University, Ethiopia.
| Email: |  |
Copyright © 2016 Scientific & Academic Publishing. All Rights Reserved.
This work is licensed under the Creative Commons Attribution International License (CC BY).
http://creativecommons.org/licenses/by/4.0/

Frequency spectrum is an important natural resource that needs to be utilized efficiently. The existing static frequency allocation is not in a position to accommodate the ever increasing demand in the wireless communication and the subsequent increase in higher data rate devices. In spite of this, different researches show that most of the times the spectrum bands are not in use which seems a paradox [1], [2]. Cognitive radio (CR) is becoming the candidate technology to resolve this paradox because it provides an efficient spectrum utilization system. This is done by utilizing an efficient primary user detection that uses opportunistic spectrum sharing mechanism. To this end, different transmitter energy detection techniques have been and is being studied [3], [4]. In this work an enhanced energy detector technique is proposed and its performance is compared with the performance of standard energy detection techniques. Matlab software is used to evaluate the performances. Simulations are carried out to show the performance enhancement of the energy detector algorithm by using cross correlation of time shifted signal observations. The simulations are carried out for both AWGN and Rayleigh fading channel-using SNR of 2dB. Simulation results showed that the enhanced energy detector algorithm (technique) minimizes the probability of misdetection and improves the probability of detection under both AWGN and Rayleigh fading channels. Moreover, both receiver operating characteristics (ROC) and complementary receiver operating characteristics (CROC) plots clearly show that the performance of the standard energy detector is enhanced by this technique.
Keywords: Cognitive radio, Spectrum detection, Enhanced energy detector
Cite this paper: Fikreselam Gared Mengistu, Mohammed Abd-Tuko, Performance Comparison of the Standard Transmitter Energy Detector and an Enhanced Energy Detector Techniques, International Journal of Networks and Communications, Vol. 6 No. 3, 2016, pp. 39-48. doi: 10.5923/j.ijnc.20160603.01.
Article Outline
1. Introduction
- Spectrum detection is the art of performing measurements on a part of the spectrum and forming a decision related to spectrum usage based upon the measured data. The recent rapid growth of wireless communications has made the problem of spectrum utilization ever more critical. On one hand, the increasing diversity (voice, short message, Web, and multimedia) and demand of high quality-of-service (QoS) applications have resulted in overcrowding of the allocated spectrum bands, leading to significantly reduced levels of user satisfaction. In recent years, the service providers are faced with a situation where they require a larger amount of spectrum to satisfy the increasing quality of service (QoS) requirements of the users. This has raised the interest in unlicensed spectrum access, and spectrum detection is seen as an important enabler for this. In a scenario in which there exists a licensed user (primary user), any unlicensed (secondary users) needs to ensure that the primary user is protected, i.e., no secondary user is harmfully interfering any primary user operation. Spectrum detecting can be used to detect the presence or absence of a primary user. The Institution of Electrical and Electronics Engineering (IEEE) has formed a working group (IEEE 802.22) to develop an air interface for opportunistic secondary access to the spectrum via the cognitive radio technology [5]. The guiding philosophy of cognitive radio is to allow universal maximization of the spectrum utilization insofar as the unlicensed users do not cause degradation of service upon the original license holders. In practice, the unlicensed users, (also called the cognitive users) need to monitor the spectrum activities continuously to find a suitable spectrum band for possible utilization and to avoid possible interference to the licensed users (primary users). Since the primary users have the priority of service, the above spectrum sensing by cognitive users includes detection of possible collision when a primary user becomes active in the spectrum momentarily occupied by a cognitive user and relocation of the communication channels. Spectrum sensing is based on a well known technique called signal detection. Various researchers have studied detection mechanisms. Determination of threshold level for minimizing spectrum-sensing error in energy detection techniques has been investigated [6], [7]. E. Visotsky, et al, studied transmission in support of dynamic spectrum sharing [8]. Comparison of different transmitter detection techniques for application in cognitive radio has also been done [3], [4]. Since one of the main requirements of CR systems is the ability to reliably detect the presence of the primary transmissions, it needs special attention and further investigations. This work concentrates on the evaluation and comparison of the performance of the standard and the enhanced energy detection techniques by considering different metrics in the real time communication system model. This paper is organized as follows. Section 2 explains the theoretical background and the system model. Furthermore, the probability of detection (Pd) and probability of false alarm (Pf) are evaluated in section 2.1 and 2.2, respectively. Finally, simulation results are demonstrated in section 3 and concluding remarks are made in section 4.
2. Theoretical Background
- Energy detection is the most common way of spectrum detection because of its low computational and implementation complexities [9]. The decision is made by comparing the decision statistics, which corresponds to energy collected in the observation time, to an appropriate threshold [10-12] that is traditionally selected from the statistics of the noise to satisfy the false alarm rate specification of the detector based on constant false alarm rate (CFAR) principle.
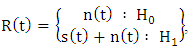
2.1. System Model of Energy Detection under Awgn Channel
- The performance of spectrum sensing can be characterized by the probability of false alarm (Pf), probability of miss detection (Pm) and the probability of detection (Pd). The term Pf is the probability that a secondary user (SU) decides the primary user (PU) is active when the PU is actually inactive. It reflects the level of missed access opportunity for the SU. The term Pd is the probability that a SU decides that the PU is active when the PU is actually active. The probability of miss detection (Pm = 1 – Pd) indicates the level of interference introduced to the PU (Primary users) by a SU (secondary users). Typically, Pm is restricted to be below an acceptable level to protect the PU.The system model for energy detection that is used to identify the presence or absence of primary signal is shown in Fig 1.
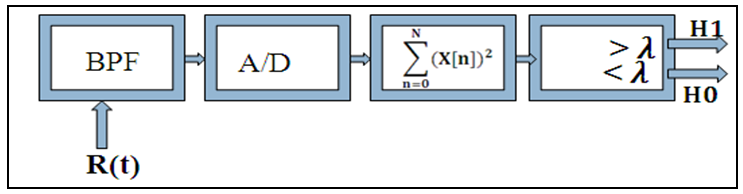 | Figure 1. Block diagram of energy detector system model |
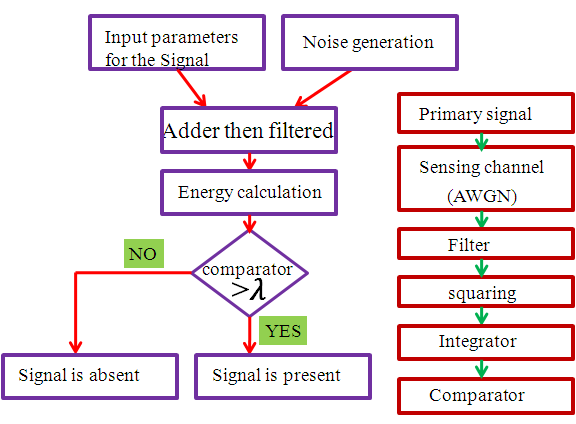 | Figure 2. Flow chart for system model of energy detector |
 | (1) |
 where
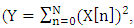
where  is the output signal of the A/D) is given as [4], [15]-[17]
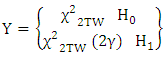 | (2) |
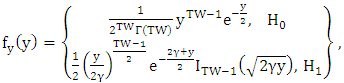 | (3) |
 is gamma function and
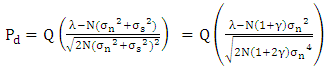
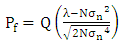
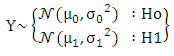
  is the xth-order modified Bessel functions of the first kind. The probability of detection (Pd) and false alarm (Pf) are respectively given as [19-21].
  | (4) |
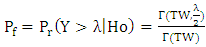 | (5) |
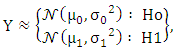 | (6) |
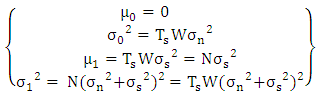
 is Gaussian distribution with mean
  and variance
  The mean and variance for both hypotheses
  are given respectively as:
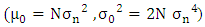 | (7) |
 | (8) |
 | (9) |
 | (10) |
2.2. Energy Detection under Rayleigh Fading Channel
- Radio wave propagation through wireless channels is a complicated phenomenon characterized by various effects, such as multipath and shadowing. A precise mathematical description of this phenomenon is either unknown or too complex for manageable communications systems analyses. However, considerable efforts have been devoted to the statistical modeling and characterization of these different effects. When fading affects systems, the received carrier amplitude is modulated by the fading amplitude
 where
where  is a random variable (RV) with mean-square value
  and probability density function (PDF)
  which is dependent on the nature of the radio propagation environment. After passing through the fading channel, the signal is perturbed at the receiver by AWGN, which is typically assumed to be statistically independent of the fading amplitude
  and which is characterized by a one-sided power spectral density N0 (W/Hz). Equivalently, the received instantaneous signal power is modulated by
  Thus we define the instantaneous SNR per symbol by
 and the average SNR per symbol by
  where Es is the energy per symbol. Our performance evaluation of digital communications over fading channels will generally be a function of the average SNR per symbol
  In addition, the PDF of
  is obtained by introducing a change of variables in the expression for the fading PDF,
  yielding [4], [12]:
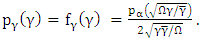 | (11) |
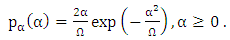 | (12) |
 | (13) |
 is the exponential distribution with parameter
 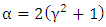 with probability density function
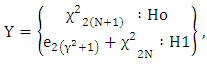
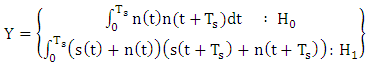
 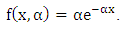 Under the hypothesis H0, the statistics are the same as for the AWGN channel case (Pf is independent of the SNR). However, H1 behaves differently and has
  given by [13], [14], [15], [18], [22]:
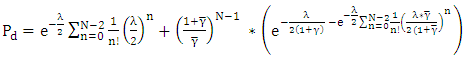 | (14) |
2.3. Enhanced Energy Detector
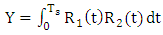
- The decision statistic in normal square law energy detection involves a noise-square term that may raise the noise floor. Therefore a conventional energy detector integrating over the entire symbol period unwittingly captures the noise-only portion of the received waveform, which causes an extra noise floor. Because the noise floor increases linearly in bandwidth-time product [23], conventional energy detection is less effective to detect wide band signal.To alleviate this problem, cross-correlation detector that correlates
 with shifted copy is adopted here. The block diagram for cross correlation energy detection system is shown below.
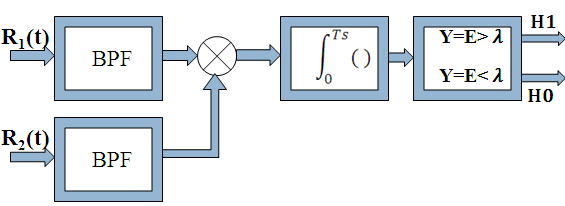 | Figure 3. Block diagram of cross correlation energy detection |
 | (15) |
 | (16) |
 | (17) |
 From equation (4), (5), and (17), one can see variances of enhanced energy detector are half of those in traditional square law energy detector. Based on the approximate pdf, one can derive the optimal decision threshold
  The figure of merit is the probability of detection Pd for a fixed probability of false alarms Pf. For a Gaussian pdf, the probability of false alarm and probability of detection can be expressed, respectively as [23]
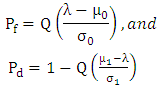 | (18) |
 is the complementary error function and the optimal threshold, λ, is by
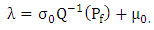 | (19) |
3. Simulation Results and Discussion
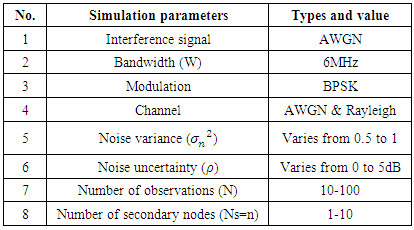
- In this section some results of our work are presented. All simulations are carried out under the consideration of required Pd of 90%, Pf of 10% and Pm of 10% within the bandwidth of 6MHz. The following table shows the simulation parameters considered in this work.
|
3.1. Simulation Results for the Standard Energy Detector
- Fig. 4 and Fig. 5 present Pd and Pm versus threshold under AWGN channel for different SNR values respectively. The threshold values are defined based on the noise variance and probability of false alarm using Constant False Alarm Rate (CFAR). As one can observe from the results, Pd is inversely proportional to the threshold whereas Pm is directly proportional to the threshold. For minimum value of threshold, it is possible to achieve better detection performance. But the performance of the energy detector deteriorates when the received signal to noise ratio decreases.
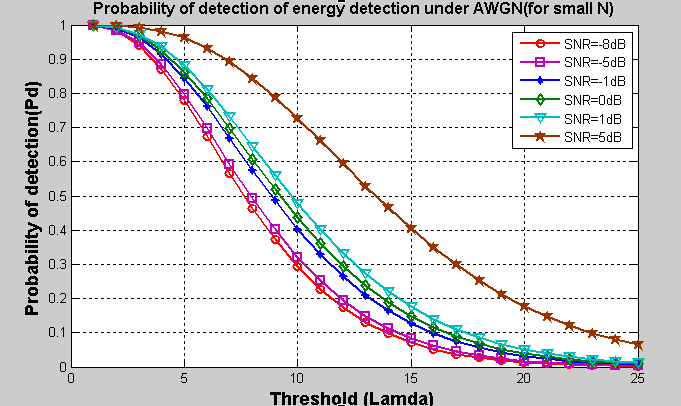 | Figure 4. Pd for energy detection under AWGN for various SNR (SNR=-8dB, -5dB, -1dB, 0dB, 1dB and 5dB) |
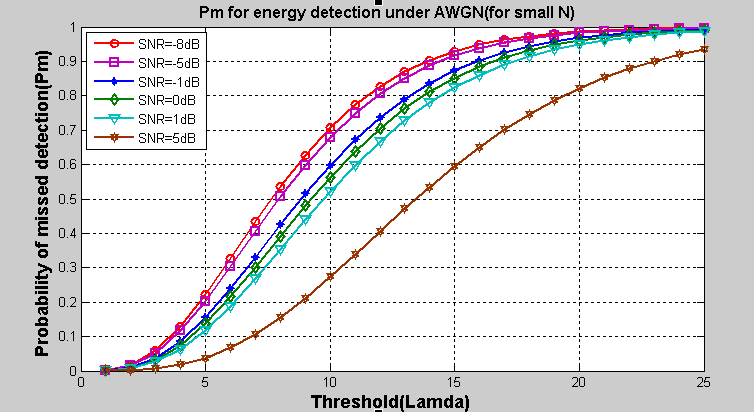 | Figure 5. Pm versus threshold for energy detector under AWGN for various SNR (SNR=-8dB, -5dB, -1dB, 0dB, 1dB and 5dB) |
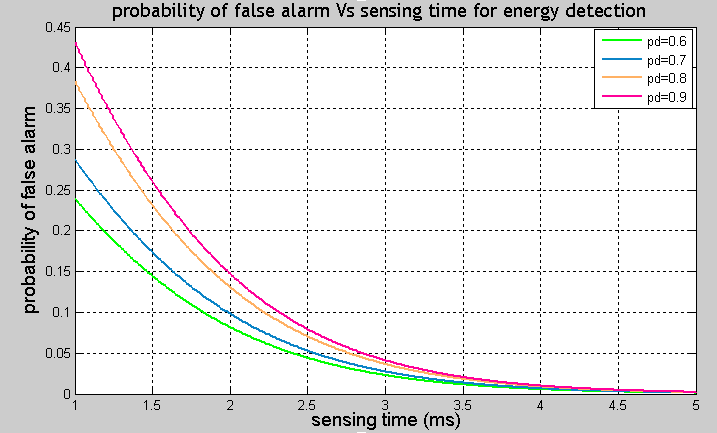 | Figure 6. Pf versus sensing time for various values of Pd (SNR=-8dB) |
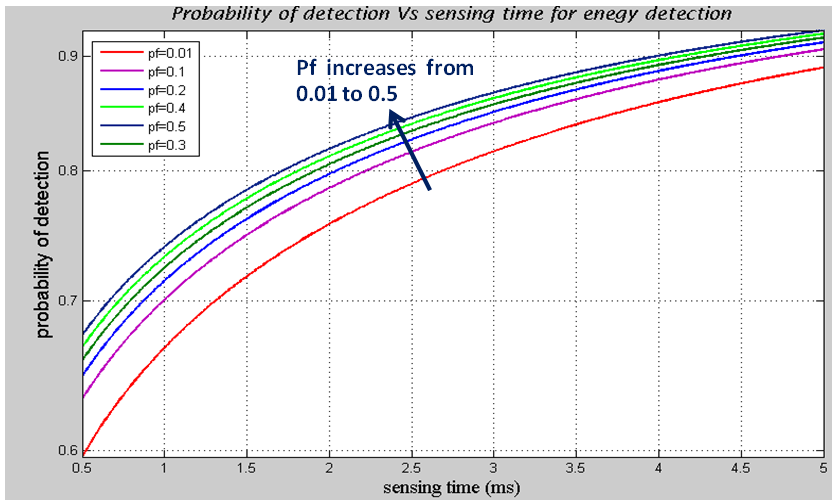 | Figure 7. Probability of detection (Pd) versus sensing time for various values of Pf |
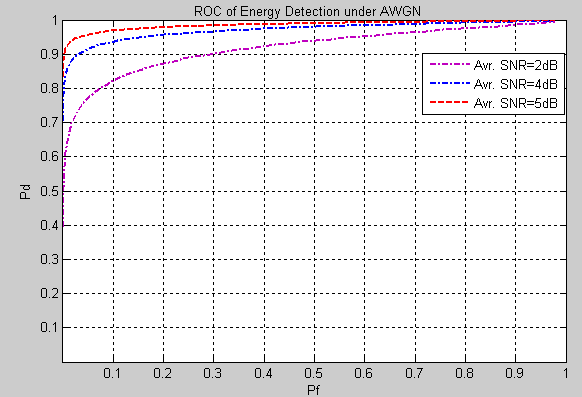 | Figure 8. ROC of energy detector under AWGN for SNR of 2dB, 4dB and 5dB |
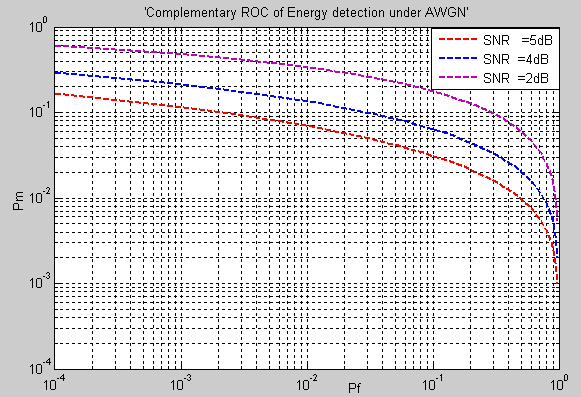 | Figure 9. CROC for energy detector under AWGN for SNR of 2dB, 4dB and 5dB |
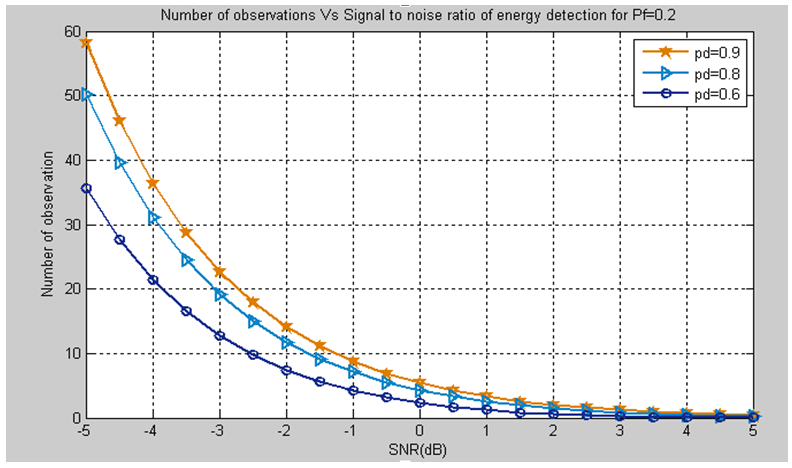 | Figure 10. Number of samples versus SNR of energy detector for different probability of detection (Pd=0.6, 0.8 and 0.9) |
3.2. Simulation Results for the Enhanced Energy Detector
- Simulations are carried out to show the performance enhancement for the energy detector algorithm by using cross correlation of time shifted signal observations. The simulations are carried out for both AWGN and Rayleigh fading channel-using SNR of 2dB. Fig. 11 indicates probability of miss detection of energy and enhanced energy detector under AWGN for probability of false alarm of 1%.
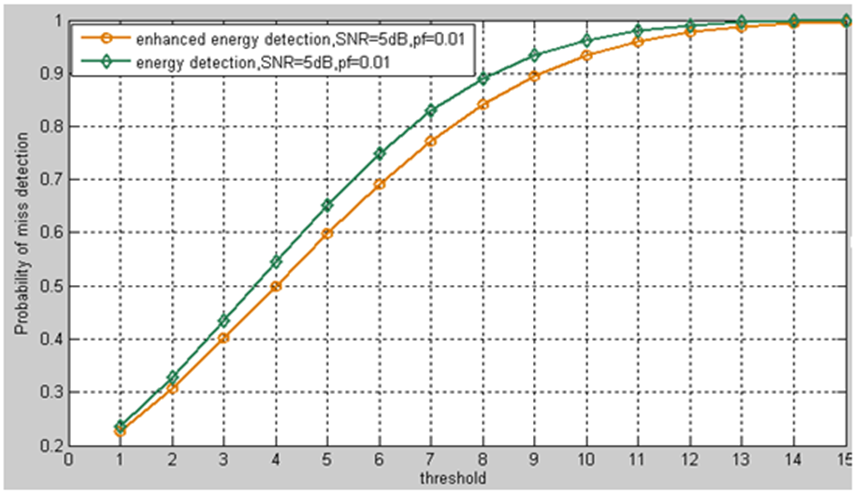 | Figure 11. Probability of miss detection versus threshold for the detectors under AWGN (SNR=5dB and Pf=1%) |
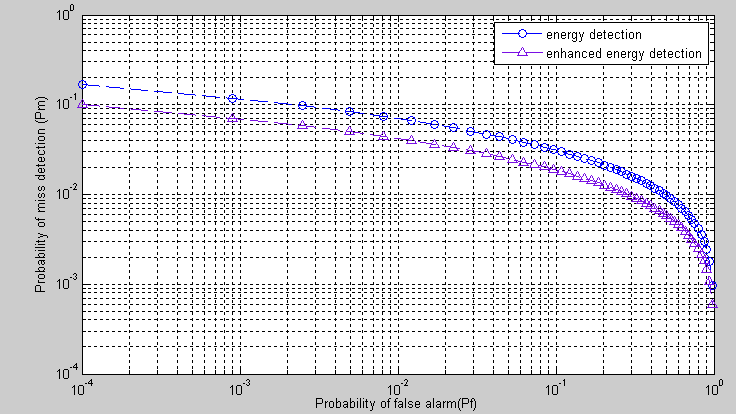 | Figure 12. CROC performance of energy and enhanced energy detector Under AWGN |
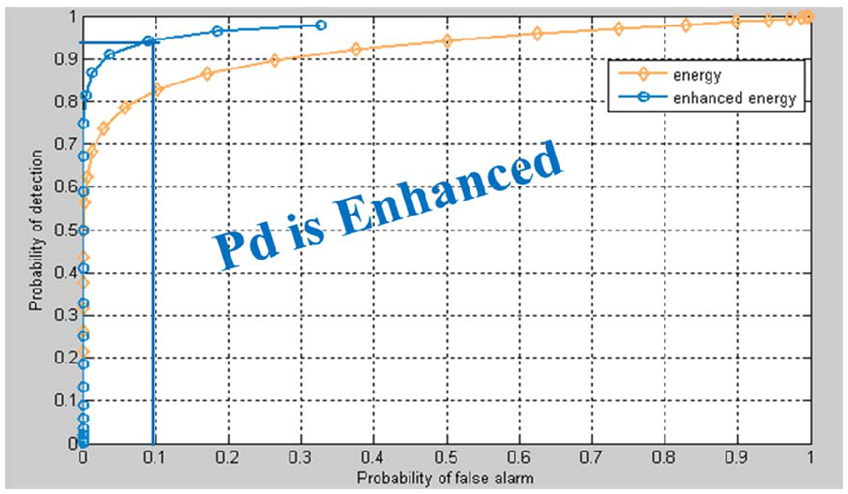 | Figure 13. ROC performance of energy and enhanced energy detection Under Rayleigh fading channel |
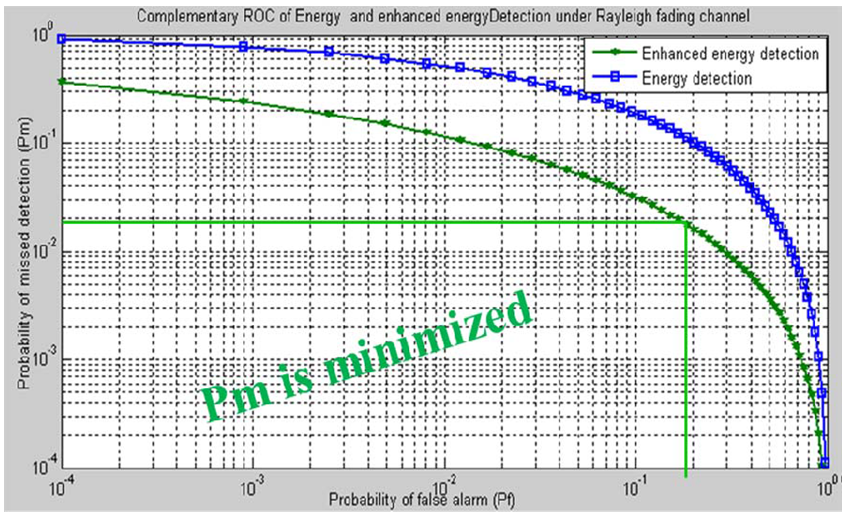 | Figure 14. CROC performance of energy and enhanced energy detection Under Rayleigh fading channel |
4. Conclusions
- In this work performance evaluation on transmitter detector techniques has been conducted using Matlab. Effective spectrum detection and performance under AWGN and Rayleigh fading channels to minimize interference between primary and secondary users in CR systems has been discussed. Based on the simulated results the following conclusions are drawn. Energy detector drops its performance for lower SNR value and this is shown by Pd, Pm and ROC. To reduce the chance of interference with the primary users, an increase in probability of detection is needed and this is done by increasing number of samples and sensing time. The simulation results showed that in order to have Pf = 0.1 and Pd = 0.7, the detector needs sensing time of 2 ms. But for Pd = 0.9, it needs sensing time of almost 2.3 ms.Finally, the performances of enhanced energy detection algorithm method are compared with the standard square law energy detection algorithm and simulation results indicate that the enhanced energy detection method has better performance than the classical energy detection algorithm. In fact the probability of detection is enhanced by as much as 0.15 when Pf is 0.1 and the probability missed detection is minimized by a factor of 5 when Pf is 0.2.