-
Paper Information
- Paper Submission
-
Journal Information
- About This Journal
- Editorial Board
- Current Issue
- Archive
- Author Guidelines
- Contact Us
International Journal of Networks and Communications
p-ISSN: 2168-4936 e-ISSN: 2168-4944
2015; 5(5): 83-96
doi:10.5923/j.ijnc.20150505.01

Performance Evaluation and Comparison of Different Transmitter Detection Techniques for Application in Cognitive Radio
 Abstract
 Reference
 Full-Text PDF
 Full-text HTML
Mohammed Abdo-Tuko
School of Electrical and Computer Engineering, Addis Ababa Institute of Technology, Addis Ababa University, Addis Ababa, Ethiopia
Correspondence to: Mohammed Abdo-Tuko, School of Electrical and Computer Engineering, Addis Ababa Institute of Technology, Addis Ababa University, Addis Ababa, Ethiopia.
| Email: |  |
Copyright © 2015 Scientific & Academic Publishing. All Rights Reserved.
This work is licensed under the Creative Commons Attribution International License (CC BY).
http://creativecommons.org/licenses/by/4.0/

Wireless communications and the utilization of the radio frequency spectrum have witnessed a tremendous boom during the past few decades. The current static frequency allocation schemes are unable to accommodate the requirements of an increasing number of higher data rate devices. Cognitive radio (CR) with effective primary user detection has become a candidate for more efficient spectrum utilization systems based on opportunistic spectrum sharing In this work, performance of energy, replica correlation, and cooperative detector have been evaluated and compared by various performance metrics. To evaluate the performance of the detection techniques MATLAB software has been used for simulation. From the simulated results the replica correlation detector is better than energy detector under both additive white Gaussian noise (AWGN) and Rayleigh fading channels. The cooperative detection helps to reduce the fading effect of single node detection. It has outperformed the performance of single user energy and replica correlation detector. Noise introduced considerable amount of degradation in the detection performance of energy and replica correlation detector and the cooperative detection helps to reduce the effect of noise uncertainty factor in the detection performance of CR.
Keywords: Cognitive radio, Hypothesis test, and spectrum detector
Cite this paper: Mohammed Abdo-Tuko, Performance Evaluation and Comparison of Different Transmitter Detection Techniques for Application in Cognitive Radio, International Journal of Networks and Communications, Vol. 5 No. 5, 2015, pp. 83-96. doi: 10.5923/j.ijnc.20150505.01.
Article Outline
1. Introduction
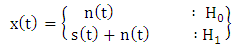
- Communication is broadly classified, as wired and wireless. It is commonly believed that there is a scarcity of spectrum availability for wireless and hence need to be economically. This misconception arises due to the intense competition for use of spectra at some selected band of frequencies. At some other frequencies there is very little usage of spectrum. This seems totally in contradiction to the concern of spectrum shortage. In fact we have abundant spectrum and the spectrum shortage is in an artificial one due to the regulatory and licensing process. In general, he spectrum usage is inconsistent with different regulatory agencies. For example, the frequency chart of the Federal Communication Commission (FCC) in the United States indicates that there are multiple allocations over all of the frequency bands [1], [2]. This discrepancy between these agencies allocations and actual usage forces to look for a new approach to spectrum licensing. What is clearly needed is an opportunistic usage of this licensed spectrum. An approach, which can meet these goals, is to develop a radio that is able to reliably sense the spectral environment over a wide bandwidth, detect the presence or absence of primary users and use the spectrum only if communication does not interfere with any primary user. These radios are lower priority secondary users, which exploit cognitive radio (CR) techniques, to ensure non-interfering co-existence with the primary users.Various researchers have studied on detection mechanisms. Determination of threshold level for minimizing spectrum-sensing error in energy detection techniques has been investigated [3], [4]. On collaborative detection of TV, E. Visotsky, et al, has studied transmission in support of dynamic spectrum sharing [5]. Since one of the main requirements of CR systems is the ability to reliably detect the presence of the primary transmissions, it needs special attention and further investigations. Therefore, this work principally focuses on reducing interference between primary and secondary (cognitive) users by comparing the performance of various spectrum detection techniques under both AWGN and Rayleigh fading channel. Considering different metrics that should be considered in the real time communication system model, this work concentrates on the evaluation and comparison of the performance of the different detection techniques.
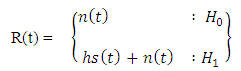
2. Theoretical Background
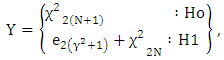
- Spectrum sensing is based on a well known technique called signal detection. In a nutshell, signal detection can be described as a method for identifying the presence of a signal in a noisy environment. Analytically, signal detection can be reduced to a simple identification problem, formalized as a hypothesis test [7], [24], [25] which can be described as shown in Fig.4.1.
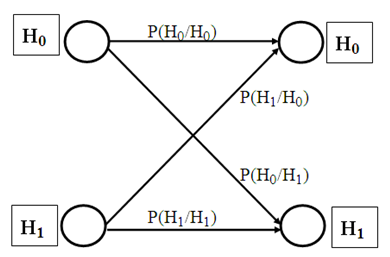 | Figure 1. Hypothesis test and possible outcomes with their corresponding probabilities |
 | (1) |
2.1. The Energy Detector Algorithm
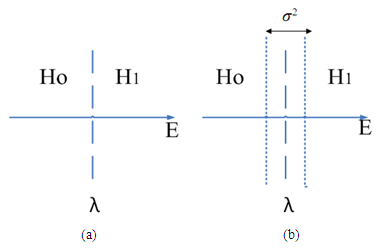
- Energy detection is the most common way of spectrum detection because of its low computational and implementation complexities [6]. The decision is made by comparing the decision statistics, which corresponds to energy collected in the observation time, to an appropriate threshold [7-9]. This threshold (λ) is traditionally selected from the statistics of the noise in such a way as to satisfy the false alarm rate specification of the detector based on constant false alarm rate (CFAR) principle.The energy detector relies completely on the variance of the noise, which is taken as a fixed value. This is generally not true in practice, where the noise floor varies and we have considered the effect of noise uncertainty as will be discussed in the next section. Essentially this means that the energy detector will generate errors during those variations (especially when the signal to noise ratio is very low) where we see an area of uncertainty surrounding the threshold, σ2, as shown in Fig. 2(b). This is in contrast with the case portrayed in Fig 2(a) in which perfect noise knowledge is considered.
 | Figure 2. Ideal (a) and actual (b) energy detection schemes |
2.1.1. System Model of Energy Detection under Awgn Channel
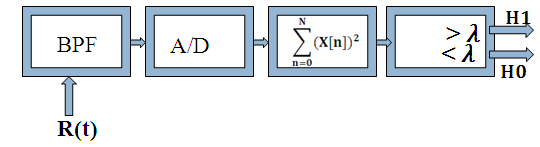
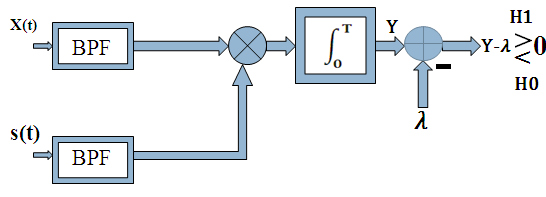
- The system model for energy detection that is used to identify the presence or absence of primary signal is shown in Fig 3. In order to measure the energy of the received signal, the output signal of band pass filter with bandwidth W, (used to limit the noise power and to normalize the noise variance), is squared and integrated over the observation interval T. Finally, the output of the summation (integration for continuous signal) is compared with a threshold, λ, to decide whether a licensed user is present or not [10].
 | Figure 3. Block diagram of energy detector system model |
 follows a non-central chi-squared distribution with 2TW degrees of freedom and non-centrality parameters
  (where γ is the mean SNR in the linear scale). Thus, the observation decision statistics (
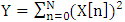 , where x [n] is the output signal of the A/D) and is given as [10, 12-14]
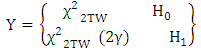 | (2) |
 is the central Chi-square distribution with 2TW degrees of freedom and
  is the non-centrality parameter. The Probability density function (PDF) of test statistic Y of (2) can then be expressed as [10], [12], [12], [15]
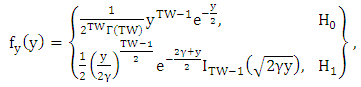 | (3) |
 is gamma function and
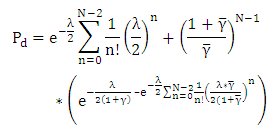
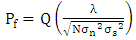
  is the xth-order modified Bessel functions of the first kind. The probability of detection (Pd) and false alarm (Pf) are respectively given as [16]-[19].
  | (4) |
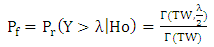 | (5) |
 | (6) |
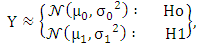
 is the Gaussian distribution with mean
  and variance
  . The mean and variance for both hypotheses
  are given respectively as:
 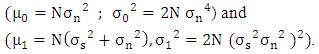 With these substitutions Pd and Pf for sufficiently large value of N can be expressed as [9], [10]
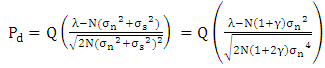 | (7) |
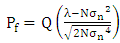 | (8) |
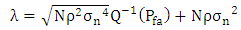
2.1.2. Noise Uncertainty Model of Energy Detector under Awgn Channel
- Although it is generally assumed for simplicity that the variance of the receiver noise is known, in reality noise variance is not exactly known of any system inspite of the system calibration a priori. There are several factors that contribute for the existence of noise uncertainty. For example, thermal noise due to change in temperature, change in amplifier gain due to change in temperature, calibration error etc. As noise uncertainty in the receiver is unavoidable, it is very important to analyse its effect on the detection performance.Let us model the noise process w[n] to have any distribution
 from a set of possible distributions,
  . This set is called the noise uncertainty set. Although the actual noise variance might vary over distributions set w, let us assume that there is a single nominal noise variance
  associated with the noise uncertainty set
  . As energy detector evaluates the detection performance based on the incoming signal, the distributional uncertainty of noise can be summarized in a single interval
 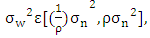 where
where  is the nominal noise power and
  is the parameter that quantifies the size of the noise uncertainty.
 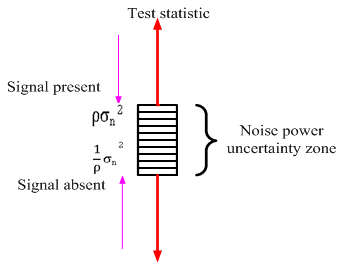 | Figure 4. Noise uncertainty regions |
 | (9) |
 | (10) |
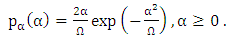
2.1.3. Energy Detection under Rayleigh Fading Channel
- Radio wave propagation through wireless channels is a complicated phenomenon characterized by various effects, such as multipath and shadowing. A precise mathematical description of this phenomenon is either unknown or too complex for manageable communications systems analyses. However, considerable efforts have been devoted to the statistical modeling and characterization of these different effects. When fading affects systems, the received carrier amplitude is modulated by the fading amplitude α, where α is a random variable (RV) with mean-square value
 and probability density function (PDF),
  , which is dependent on the nature of the radio propagation environment. After passing through the fading channel, the signal is perturbed at the receiver by AWGN, which is typically assumed to be statistically independent of the fading amplitude α, and which is characterized by a one-sided power spectral density, N0 (W/Hz). Equivalently, the received instantaneous signal power is modulated by
  . We define the instantaneous SNR per symbol by
  =α2Es/N0 and the average SNR per symbol by
  =ΩEs/N0, where Es is the energy per symbol. Our performance evaluation of digital communications over fading channels will generally be a function of the average SNR per symbol
  . In addition, the PDF of
  is obtained by introducing a change of variables in the expression for the fading PDF,
  of
of  yielding [9]
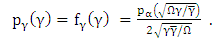 | (11) |
 | (12) |
 | (13) |
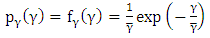
 | (14) |
 is the exponential distribution with parameter
  with probability density function
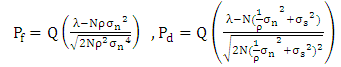
  . Under the hypothesis H0, the statistics are the same as for the AWGN channel case (Pf is independent of the SNR). However, H1 behaves differently and has
  given by [11], [14], [17], [18]
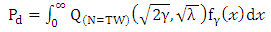 | (15) |
 | (16) |
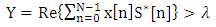
2.2. Replica Correlation Detector (RCD) Algorithm
2.2.1. RCD under Awgn Channel
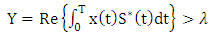
- A replica-correlation detector is performed based on the correlation between the received signal X(t) and the replica known primary signal s(t) (signal transmitted by the licensed transmitter). The block diagram of system model is shown in Fig.5.
 | Figure 5. Block diagram of replica correlation detector system for continuous time case |
 | (17) |
 | (18) |
 | (19) |
 or
or  is a sequence of independent identically distributed (i.i.d) random variables with zero mean and variance of
  for hypothesis H0, and mean of
  and variance of
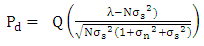
 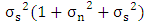 for hypothesis H1. Using central limit theorem to the decision static of the replica correlation detector Y for large sample index value N, the distribution of the test statistic can be approximated as Gaussian and statistically expressed as [9], [10]
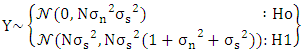 | (20) |
 | (21) |
 | (22) |
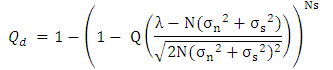
2.3. Cooperative Detector Algorithm
- Among many other challenges one of the most important challenge for the implementation of CR network is the hidden node problem, when a CR is shadowed or in a deep fade [20], [21]. Cooperative systems such as wireless sensor networks exploit the benefits of spatial diversity that geographically dispersed sensors provide. In the case of cooperative detection multiple CR’s can collaborate with each other in order to make a global decision about the existence of the PU as shown in the scenario of Fig.6. Therefore cooperative detection refers to spectrum sensing methods where information from multiple secondary users is incorporated for primary user detection.
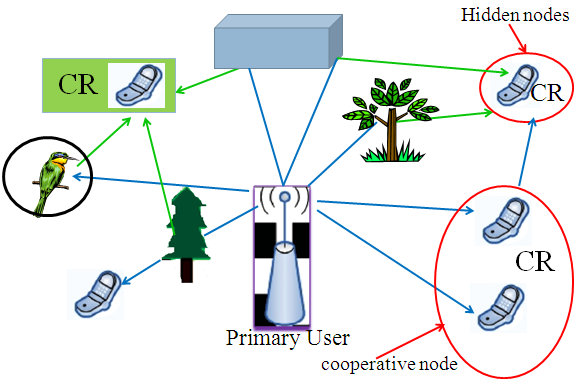 | Figure 6. Scenario of cooperative signal detection for cognitive radio |
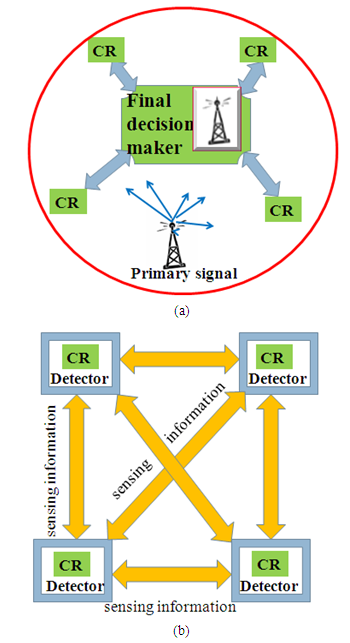 | Figure 7. Fusion center of cooperative detection (a) centralized (b) distributed |
 | (23) |
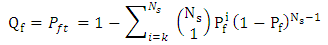 | (24) |
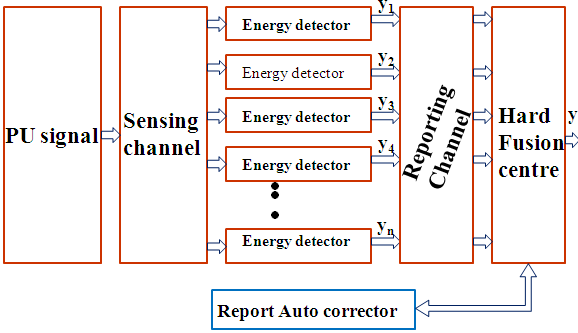 | Figure 8. Sytem model for energy detector based cooperative detector algorithm |

 and
and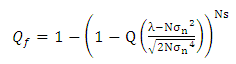 | (25) |
 | (26) |
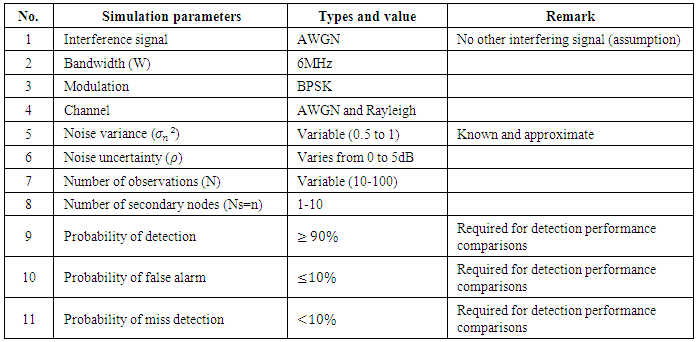
3. Simulation Results and Discussion
- In this section some results of the work are presented. All simulations are carried out under the consideration of required Pd of 90%, Pf of 10% and Pm of 10% within the bandwidth of 6 MHz. All the performance evaluations are carried out for the simulation parameters shown in appendix Table 1.Simulation results for the performance evaluation of energy and replica correlation detector algorithm under AWGN and Rayleigh fading channels are presented. Figure 8 and Fig. 9 are carried out to show Pd and Pm of both energy and replica correlation detector algorithm under AWGN for SNR=5dB. As can be seen from the results, replica correlation detector got better performance. This is because the known signal is correlated with the received signal at the receiver in the case of replica correlation detector.
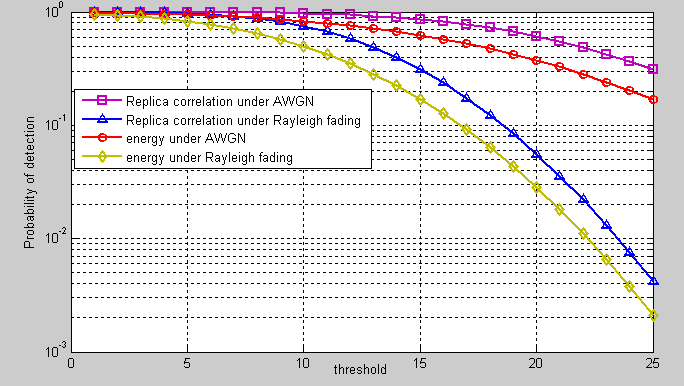 | Figure 8. Performance of energy and replica correlation detector using Pd under both AWGN and Rayleigh fading channel (SNR=5dB) |
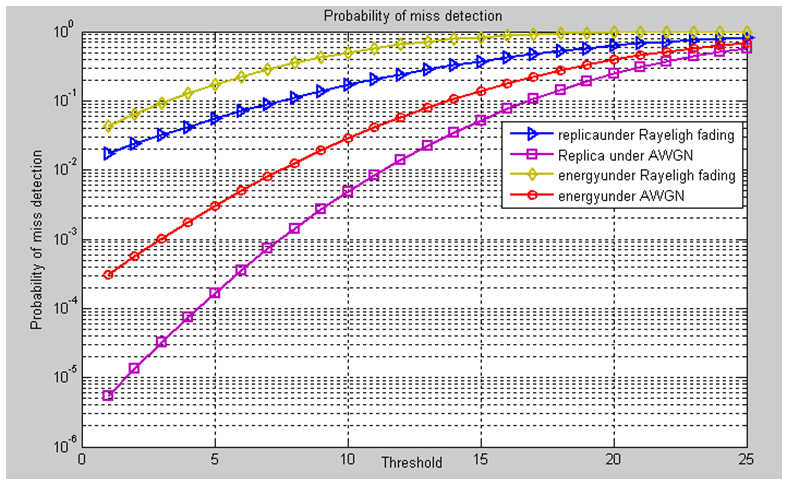 | Figure 9. Performance of energy and replica correlation detector using probability of miss detection under both AWGN and Rayleigh fading channel (SNR=5dB) |
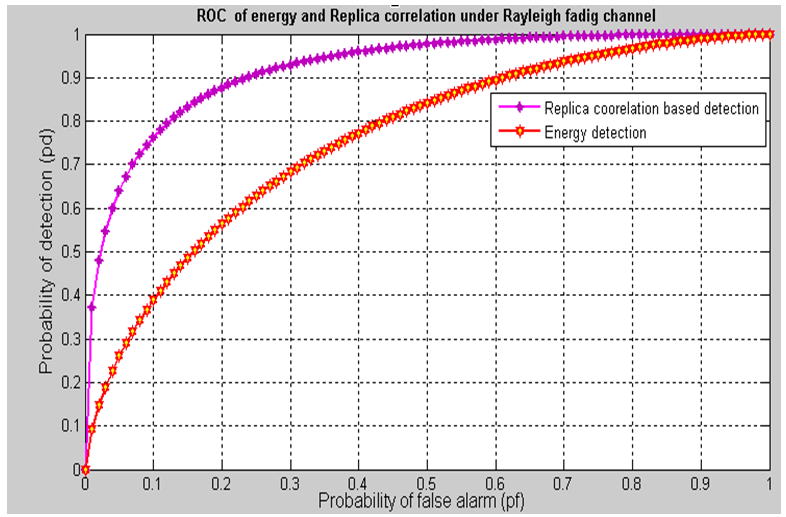 | Figure 10. ROC of single node energy and replica correlation based detection under Rayleigh fading channel for SNR=2dB |
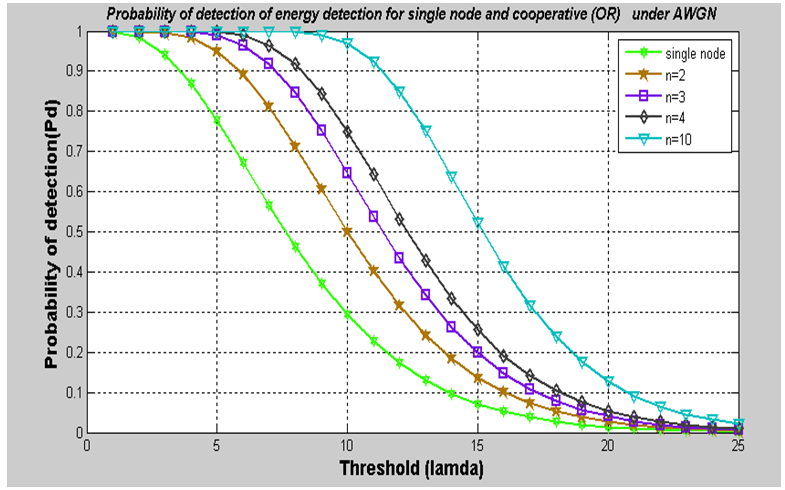 | Figure 11. Performance of energy and its cooperative detection for different number of secondary users (nodes) using “OR” rule fusion scheme |
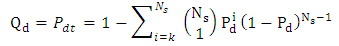
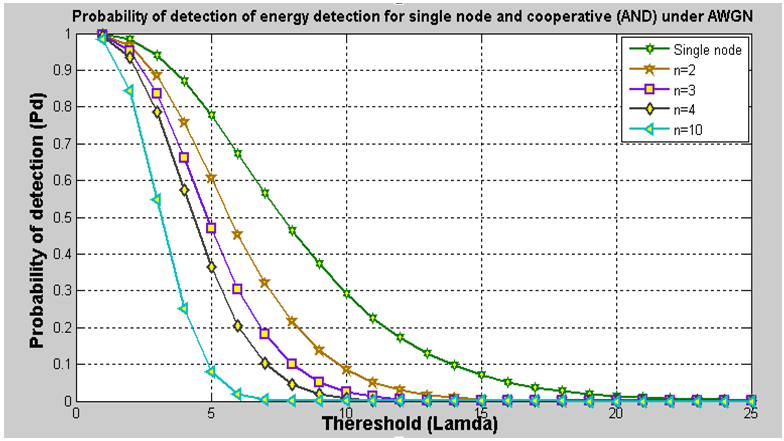 | Figure 12. Performances of energy and its cooperative detection for different number of secondary users (Ns=n=1, 2, 3, 4 and 10) using “AND” rule fusion scheme |
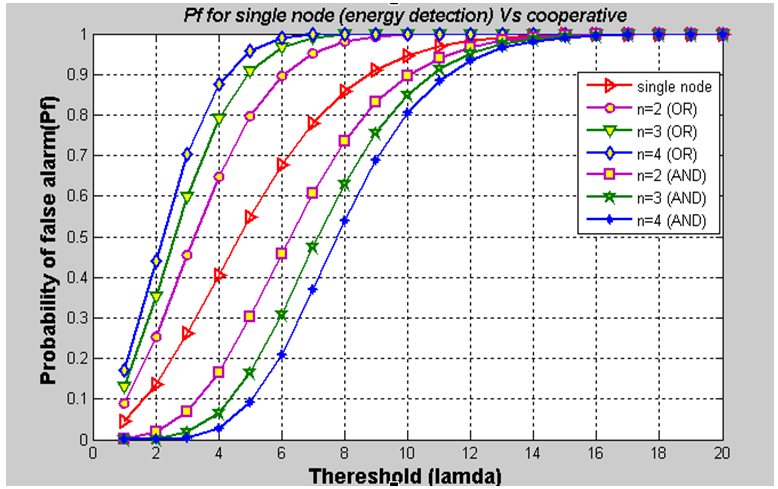 | Figure 13. Performance of energy and its cooperative detection for different secondary users for both “OR” and “AND” rule fusion scheme |
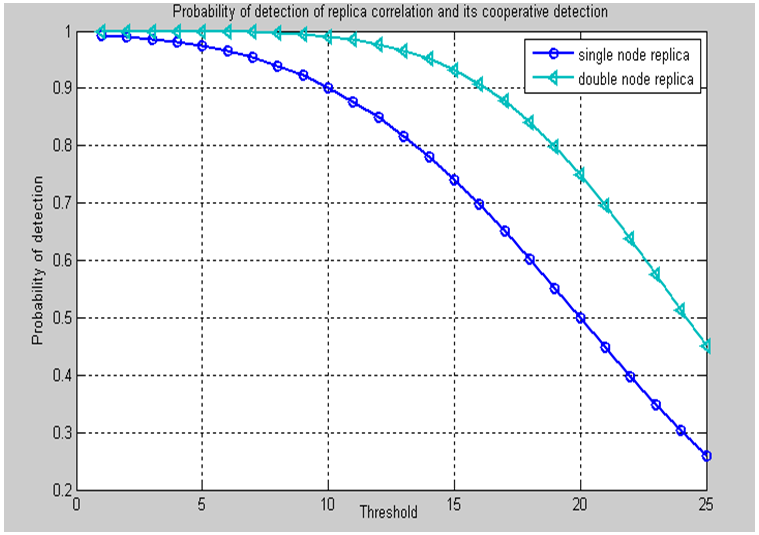 | Figure 14. Pd of replica correlation and its cooperative under fading channel (SNR=-10dB) |
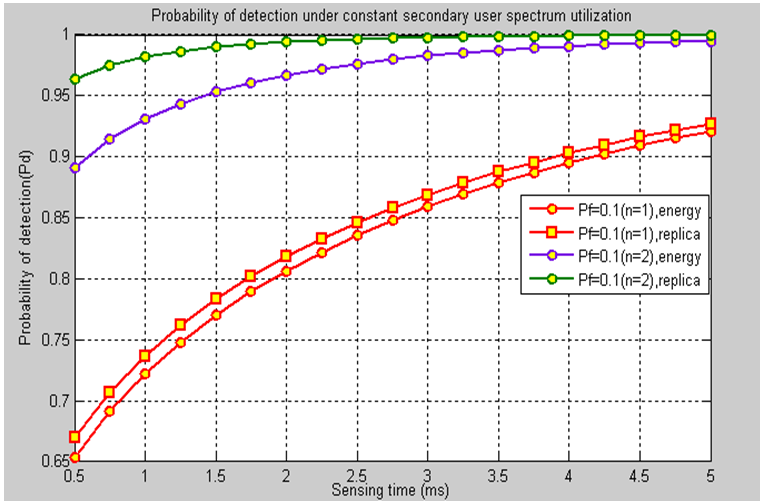 | Figure 15. Plot of probability of detection versus sensing time for the three detector algorithms (“OR” rule fusion scheme, Ns=2) |
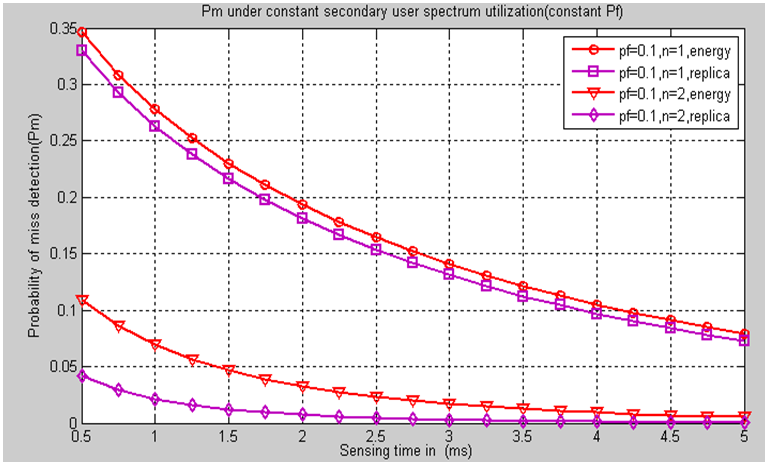 | Figure 16. Plot of probability of miss detection versus sensing time for the three detector algorithms (“OR” rule fusion scheme, Ns=2) |
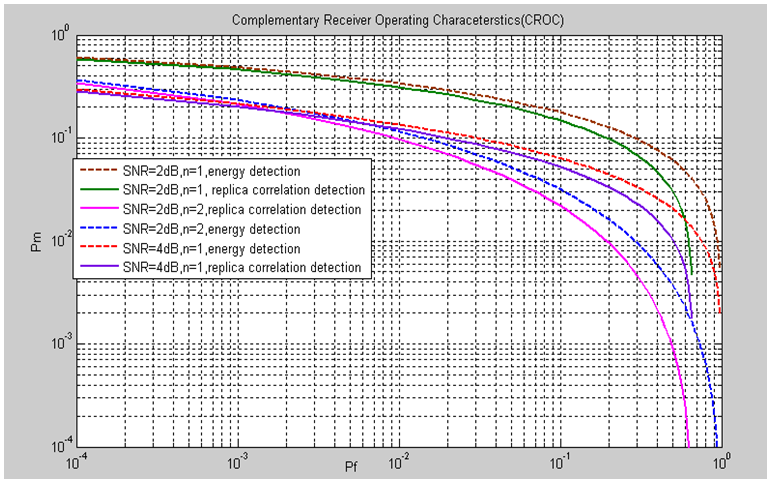 | Figure 17. Complementary ROC performance comparison detector algorithms (Ns=n=1, 2 and SNR=2dB and 4dB) |
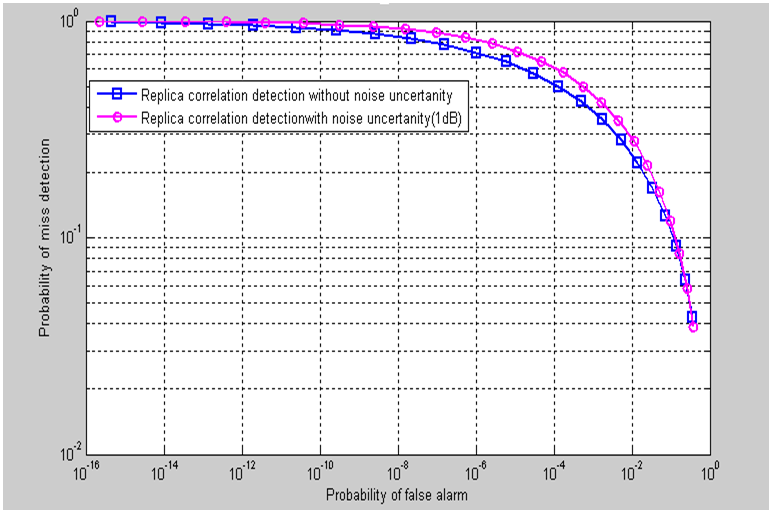 | Figure 18. Plot of complementary receiver operating characteristics energy detector under consideration of noise uncertainty factor (Rho=1dB) |
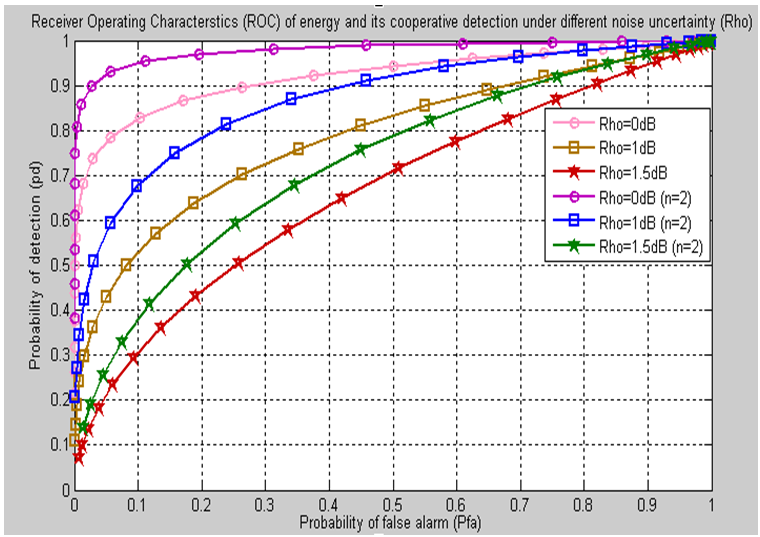 | Figure 19. ROC of energy detector and its cooperative detector with noise uncertainty factor |
4. Conclusions
- Based on the obtained results the following conclusions are drawn from this work. Energy detector drops its performance for lower SNR value and this performance are shown by Pd, Pm and ROC. But to reduce the chance of interference with the primary users, an increase in probability of detection is needed and this is performed by increasing number of samples, increasing sensing time and by incorporating more secondary users, where replica correlation detector needs a sensing time lower than energy detector. Rayleigh fading degrades the performance of single node energy and replica correlation detector so that cooperative detection is the best option for spectrum detection in faded environments by introducing additional communications overhead of decision fusion. To introduce considerable amount of degradation in the detection performance of energy and replica correlation, noise uncertainty has been considered and the cooperative detection helps to reduce the effect of noise uncertainty factor in the overall detection performance of cognitive radio. Moreover, it was shown that the OR rule outperforms the AND rule in lower detection threshold.