-
Paper Information
- Previous Paper
- Paper Submission
-
Journal Information
- About This Journal
- Editorial Board
- Current Issue
- Archive
- Author Guidelines
- Contact Us
International Journal of Networks and Communications
p-ISSN: 2168-4936 e-ISSN: 2168-4944
2013; 3(5): 118-129
doi:10.5923/j.ijnc.20130305.02
The Improved Feedback Model for Reducing Congestion in Packet Switched Wide Area Networks
 Abstract
 Reference
 Full-Text PDF
 Full-text HTML
E. F. Ogbimi, A. O. Oluwatope, G. A. Aderounmu
Department of Computer Science and Engineering, Obafemi Awolowo University Ile-Ife, Osun State, Nigeria
Correspondence to: E. F. Ogbimi, Department of Computer Science and Engineering, Obafemi Awolowo University Ile-Ife, Osun State, Nigeria.
| Email: |  |
Copyright © 2012 Scientific & Academic Publishing. All Rights Reserved.
Congestion in computer networking occurs by these characteristics. The characteristics exhibited are multiple packet losses, low link utilization, high queuing delay and congestion collapse. A scheme for congestion control was proposed in packet switched wide area networks. The scheme used feedback from destinations of the network to the source. The scheme used a minimal amount of feedback (bits in each packet) from the network to adjust the flow of packet into the network. The routers in the network detect congestion and set the congestion indication bits on packets flowing in the forward direction. The congestion indication is communicated back to the destinations through transport level acknowledgement. The scheme is distributed, adapted to any state of the network, converged to fairness, minimized packet loss and amplitude of oscillation. The results of the paper showed that flow of bandwidth was stable with gradual increase in simulation time. This shows that the scheme reduced congestion by minimal packet drops, balanced flow of bandwidth, converges to fairness and minimized amplitude of oscillation.
Keywords: Congestion, Feedback, Bandwidth, Packet Switched, Wide Area Networks
Cite this paper: E. F. Ogbimi, A. O. Oluwatope, G. A. Aderounmu, The Improved Feedback Model for Reducing Congestion in Packet Switched Wide Area Networks, International Journal of Networks and Communications, Vol. 3 No. 5, 2013, pp. 118-129. doi: 10.5923/j.ijnc.20130305.02.
Article Outline
1. Introduction
- Wide Area Networks (WAN) is a network whose communication links cross metropolitan, regional, or national boundaries or less formally a network that uses routers and public communication links. The largest and well known example is the internet. One type of WAN is packet switched WAN. Packet switched WAN is a digital communication WAN that groups all transmitted data irrespective of the content, type of structure into suitable sizes called packets. Packets are transmitted in a shared network which routes independently from all others and allocates transmission resources as needed. During the expansion of the internet in the 1990s, the data communication industry created an infrastructure that is capable of delivering cheap bandwidth in high volumes. Bandwidth became surplus to the extent that even the effect of Meltcalfe’s law (the growth of the network is inversely proportional to the squares of the number of users in a given area) were insufficient to consume the available bandwidth for years[1]. The result of bandwidth rapid development was the commercialisation of bandwidth with decrease in prices and an environment that actively promoted the myth that high bandwidth can address almost any performance problem. However, application performance in networks is affected by many factors associated with both network and application logic that must be addressed in order to achieve satisfactory application performance. At the network level, it is limited by high latency (the effect of physical distance between networks), jitter, packet loss, and congestion[2]. At the application level, performance is further limited by natural behaviour of application protocols especially with latency, packet loss and congestion at the network level.The rapid growth of WAN in recent years is part of the struggle for network administrators to monitor the network for demand resources such as voice, video and data. Most users continue to add more networking devices of higher capacities to satisfy the needs of network users. Yet, network remains congested and application software continue to run slowly and experience poor performance of networks. New breeds of software applications and information technology drivers like academics, industrialists, and business tycoons contribute to this problem by installing new software which may not be favourable to the networking environment[3]. Technology drivers, demand for bandwidth at the same time leads to the flow of bandwidth instability, where bandwidth demand for resources is higher than the capacity of the network. In view of the various efforts of network providers to sustain network performance, congestion and poor performance are still common features of networks. Hence, there is need to continue to conduct research on how to improve the performance of computer networks.Congestion is a fundamental communication problem that occurs in shared networks. In typical packet switched networks, this occurs quite easily when the output links are slower than the input and multiple traffic sources competing for same output link at the same time. Some of the features of congestion are packet loss resulting from overflow of packets from the buffer, faulty hardware devices which may dissatisfy the user and slow down the network; mismatching of different speeds clogging the path with higher and lower speeds of network links and feedback delay in transmitting packets from source to destination. When message is transmitted through a link and passed through the feedback controlled loop, the network is said to be experiencing positive feedback. The output of the positive feedback fails when the input packet transmits faster than the system can handle. The packets eventually get lost due to overcrowding and packet delay. This affects flow of bandwidth stability and have negative implications for routing.The objective of the paper is to develop a TCP control theoretic model for reducing congestion in packet switched wide area networks.
2. Literature Review
2.1. Existing Schemes for Congestion Control in Packet Switched WAN
- Several schemes of managing congestion have been used in the past. Among these are three prominent feedback schemes, which are active networking also called active congestion control technique, convention feedback technique and explicit feedback scheme. Active congestion control scheme makes the feedback congestion control more responsive to the network. Active congestion control scheme is done by reprogramming with routers with data packets[4]. Conventional feedback schemes detect congestion when they receive notification from the congested router or when they deduce the existence of congestion due to packet loss or excessive delays. The congestion relief starts from the sender and moves to the congestion node as the sender’s rate is reduced[5]. In explicit Binary feedback scheme, a router that is congested sets a congestion indication bit in the network layer header of a data packet that is flowing in a forward direction. When the data reach the head of the acknowledgement packet, the acknowledgement packet is then transmitted from the destination to the source. In this case, users are expected to adjust the window size[6].
2.2. Drawbacks in the Existing Schemes
- The drawbacks of Binary Feedback scheme were: the protocol TCP/IP is not efficient enough to transmit data of higher data rate between nodes and propagation delay of the network is very large due to indicated congested data by a bit. The current protocol which is TCP was not effective to handle high sophisticated bandwidth transmission[7]. The current protocol which is TCP was not effective to handle high sophisticated bandwidth transmission[7]. TCP used a binary congestion signal. Oscillation occurred always at the packet level. The dynamics of the network were unstable leading to severe oscillation can only be reduced by accurate estimation of packet loss probability and a stable design of flow dynamics. The drawback of conventional feedback model is large propagation delay in sending packets therefore congestion sets in and increases. The drawback for active congestion control was that it was limited to service-time distribution. The model also could not be expanded and as a result was not robust. The drawback of explicit scheme was that it lacked scalability with respect to network bandwidth and there must always be signals of congestion before the scheme is adopted. It is not flexible to all kinds of traffic conditions. Delay increased in quantity along the congestion site and endpoints. The larger the delay goes from one endpoint to another, the longer it took the packets to be transmitted. Congestion then sets in. The higher the bandwidth, the larger the amount of data, the more congested is the endpoints. In this paper, a method called Dynamic Explicit Feedback Scheme was adopted to reduce congestion in packet switched WAN.
2.3. The Improved Feedback Scheme
- The improved feedback scheme being proposed was called dynamic explicit feedback model which kept the bandwidth stable. It reduced packet drops to its barest minimum. It reduced bandwidth delay in packet switched WAN. It balanced the flow of transmission through paths. A feedback mechanism was added to monitor the acknowledgement of packets from receiver to sender.
3. Model Conceptualization
- The main concepts adopted in the research were packet switching, feedback mechanism and dynamic systems.Packet switching is a communication technique where messages are broken down into packets that include the packet information and sent through the fastest available route to destination.Figure 1 shows a typical packet switched WAN. The message is transmitted from source(s) to destination(s). The message goes into the first router which acts as a buffer. A buffer acts as a temporary flow controller. The buffer keeps the message for a while until it sees an available router to deliver its message. The message is broken into packets by a multiplexer through a process of packetization. The packets go into different routers which deliver them finally to their destinations. When the message in the router is too many to be handled, congestion sets in and packets drops from the router. A communication cycle usually involves a source which sends signal (message) to a destination, the destination receives the message and sends a reverse message (feedback) to the source and completes the cycle. The feedback mechanism assesses the behaviour of the network and sends a message to the feedback controller about the behaviour of the network as to whether it is congested or not. Transmission Control Protocol (feedback controller) probes the network’s state with the data it sends.Figure 2 shows the application of a feedback control mechanism in a packet switched WAN. The time taken to receive its acknowledgement is the round trip time (RTT). The RTT is an important state variable in the system. The RTT is also the delay time around the feedback loop. The RTT varies primarily as a function of the buffer-filled levels in the network path which data travels. The longer the packets wait in the buffer, the longer it takes to transverse through the path. A significant increase in RTT is an indication of network congestion.
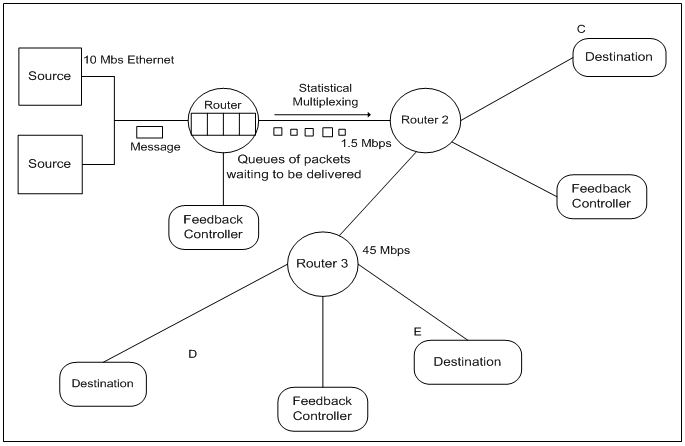 | Figure 1. A Typical Diagram for Packet Switched Wide Area networks |
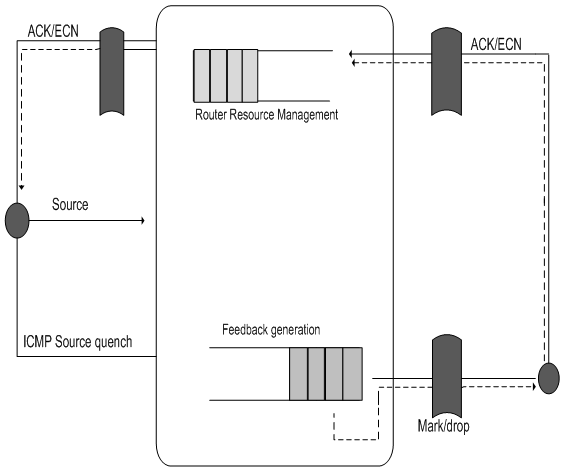 | Figure 2. Feedback flow control model Source:Gevros et al., (2005) |
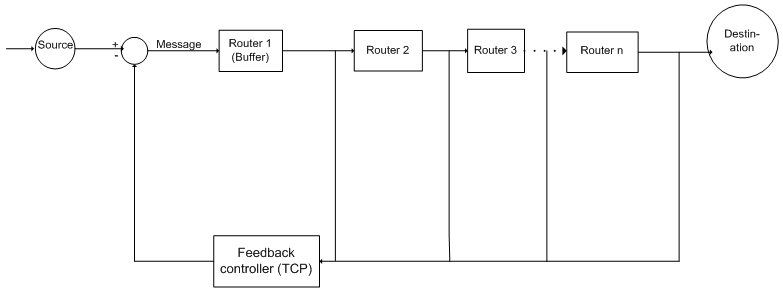 | Figure 3. Improved feedback model for managing congestion in packet switched WAN |
3.1. Model Development
- Figure 3 shows the block diagram of the improved feedback model. The message is broken into packets by means of packetization. Packets are transmitted from source(s) to destination(s). A message is transmitted to the first router which acted as a buffer. The message remains in the buffer for a while until there is an available router that packets can be routed on the way to their destinations. The packets are then distributed to the second, third and many other routers. A feedback indicates that the packet had been sent to the receiver. If some of the packets were lost or delayed in the queuing system, the feedback controller passes a feedback message to any of the routers that there was congestion somewhere along the link. The router therefore adjusts the speed of transmitting packets. The stability of flow of packets is then regulated.
3.2. Model Construction
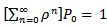
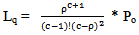
- Queuing theory is applicable to the situation of packet switched WAN[8]. The parameters of the queuing model were modified and applied to the situation of packet switched WAN. The queuing model for packet flow in packet switched WAN was then modelled by the following modified parameters:
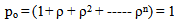
 = rate of arrival of packetsµ = service rate (rate of transmitting packets)Ls = Average number of users on the networkLq = Average number of users requesting for web resources from a router in the network (in the queue).c = number of routersρ = network utilizationPo = Probability of routers that do not accept packets
 | (1) |
 user per unit time. Under these conditions,
  If arrival rate is higher than the service rate, then the geometric series will not converge and the steady-state probability will not exist. The queue length will continually increase and no steady state will be reached in the network. Letting
  the expression for pn in the generalised model then reduced to
 | (2) |
 | (3) |
 the Sum to infinity of a series
  where a = 1 and r = ρ
  | (4) |

 | (5) |
 | (6) |
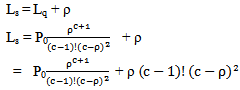
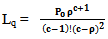
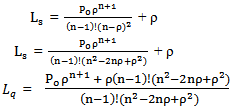
 and the service rate per server is µ. There is no limit on the number of routers in the network. With Kendall’s notation (K∣M∣C) : (GD∣∞∣∞), K is the arrival distribution, M is the service distribution and C is the number of servers in the network. The queue discipline is a generalized distribution that satisfies all conditions. The parameters considered were arrival rate (
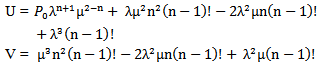
 ), service rate (µ), number of servers (c), probability of number of routers not accepting packets (Po). Ls and Lq are computed as: If
 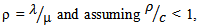 the value determined from
 | (7) |
 (n = 0, 1, 2....., n)Then
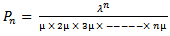 | (8) |
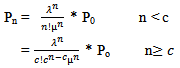
 | (9) |
 | (10) |
 | (9) |
 Which on further substitution
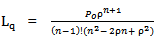 | (11) |
 in equation (11)
 | (12) |
 and
and 
 For the equation of the number of users in the network
 | (10) |
 | (13) |
 in equation (13) gives
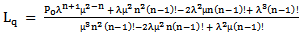 | (14) |
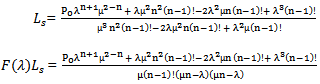
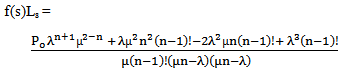
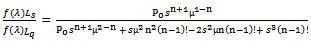
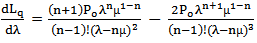
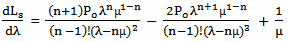
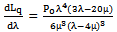
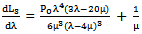
 The equations of both the number of network users requesting for web resources (Lq) and number of network users in the system (Ls) were differentiated with respect to the arrival rate of packets (
 ). Using the quotient rule of differentiation.
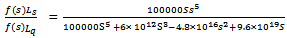
 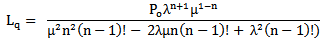 Find the frequency domain of Lq
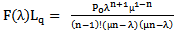 | (15) |
 | (16) |
 | (17) |
 | (18) |
 | (19) |
 | (20) |
 | (21) |
 | (22) |
 | (23) |
 | (24) |
 | (25) |
 | (26) |

 | (27) |
 | (26) |
 | (27) |
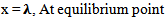
 which implies that x = λ at equilibrium point
 | (26) |
 | (28) |
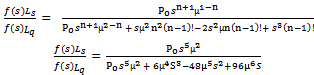
 for n = 4
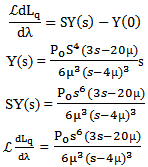 | (29) |
 for n = 4
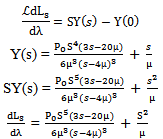 | (30) |
 | (31) |
 | (32) |
3.3. Analytical Validation of Bode Plots and Impulse Responses Using Simulink
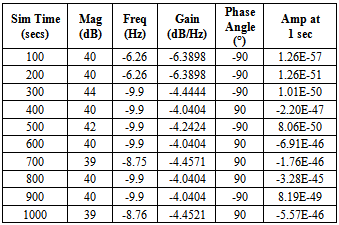
- Simulink was used to analyse the flow of bandwidth stability further with the systemic time expressed in seconds for different number of routers. Each bandwidth scenario was simulated at time interval of the negative feedback model for congestion in packet switched WAN. Different simulation times in seconds were assigned to the model. The model was linearized by selecting two options of displaying linearization results such as Bode plots and impulse responses for different simulation snapshot times. The linearized models were computed and LTI (Linear Time-Invariant) viewers were displayed for each time period of 100 to 1000 seconds. Both scenarios were compared using the following parameters like magnitude, phase angle, frequency, gain and amplitude.
4. Results and Discussions
- This part presents the findings consequent to the investigations carried out in attempt to achieve the objectives of the paper. The order of presentation is the experiment, data, graphical analysis and discussion of the results. The simulating software was Simulink. Simulink computed the discrete transfer functions of both the number of users assessing the web and number of network users in the system and also computes the bode plots and impulse responses using the Linear-time invariant viewer of the simulink. Simulink examined the behaviour of the graphs of bode plots and impulse responses in terms of time in seconds.
|

|
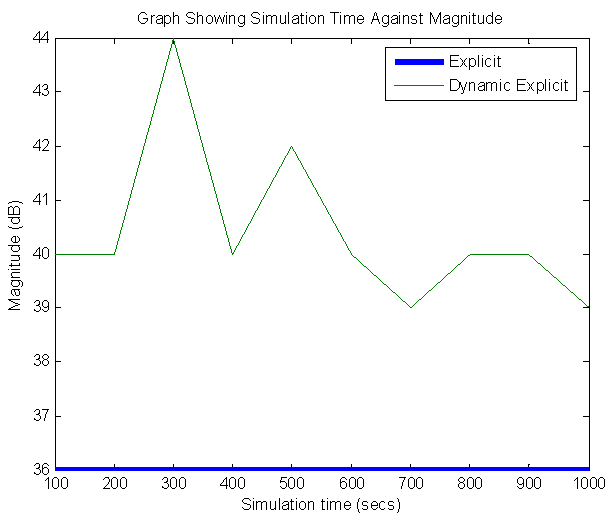 | Figure 4. Graph showing simulation time against magnitude for 4 servers |
 | Figure 5. Graph showing simulation time against frequency for 4 servers |
 and rose to
  fell to
  and finally to
 It shows that the steeper the amplitude of oscillation, the higher the stability of flow of bandwidth. When the flow of bandwidth becomes stable and feedback becomes responsive to the network. The amplitude for explicit feedback is
  while for table II is
  This illustrated that the network is more stable with dynamic Explicit feedback model by 100%. The network is more stable with a smaller amplitude.
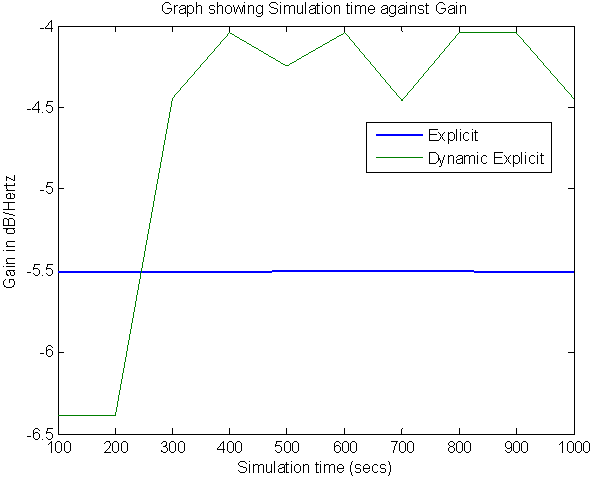 | Figure 6. Simulation time against gain for 4 servers |
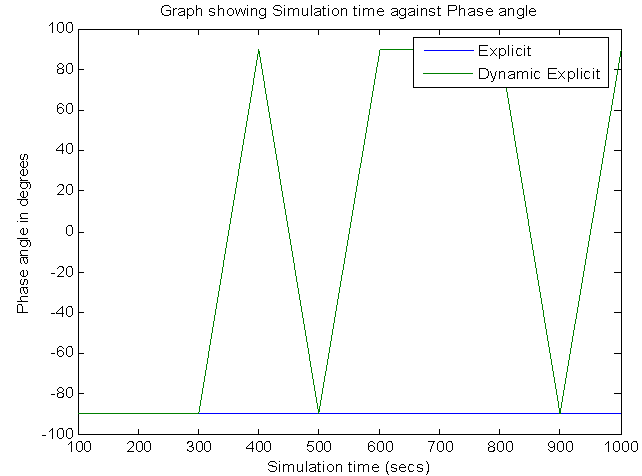 | Figure 7. Simulation time against phase angle for 4 servers |
 | Figure 8. Simulation time against amplitude at 1 sec for 4 servers |
5. Conclusions
- In this paper, a scheme was proposed for improved feedback model for reducing congestion using TCP protocols at the network layer. The scheme used variable amount of feedback from the network, with a router to indicate congestion. Each network server that is congested sets the router and sends message to the source by the user. The message goes back to the source from the destination which receives packets. The network was modelled as a negative feedback control system and identified various component in the scheme in the model. The policies that needed to be used in each of these components were studied through analysis and simulation.The network servers detect their state as being congested and sets the congestion indication router when the time to deliver packets the receiver is longer than expected. The arrival rates and service rate of packets were described. The users receive their packets and determine the flow of bandwidth stability. The probability of routers accepting packets too also determine the stability of flow of bandwidth and it is between 0 and 1.It was also demonstrated that the scheme is distributed, adapts to any state of the network, converges to fairness, minimizes packet loss and amplitude of oscillation. The performance of the scheme was addressed under transient changes in the network. The scheme operates the network at a stable point when the network is overloaded even, when the users try to cause bottleneck in the path.The improved feedback model will also be extended to other types of networks such as Local Area Networks, Metropolitan Area Networks and Personal Area Networks. Alternative model disciplines like First In First Served, and Last In First served.Other areas of simulation like throughput, packet dropping and link utilization and different TCP traffics will be simulated. Another set of networking problems as error control, flow control and load scheduling problems will be considered using Hidden Markov Models and Stochastic models.
ACKNOWLEDGEMENTS
- My first and utmost appreciation goes to my parents, Professor and Dr. (Mrs). F.E. Ogbimi for giving me the parental and financial support towards this paper.