Zaid Matloub, Ivica Kostanic
Electrical and Computer Engineering, Florida Institute of Technology
Correspondence to: Zaid Matloub, Electrical and Computer Engineering, Florida Institute of Technology.
| Email: |  |
Copyright © 2012 Scientific & Academic Publishing. All Rights Reserved.
Abstract
A methodology has been developed for an efficient PCI planning of an LTE network. The methodology considers the correlation properties of the physical layer synchronization signal sequences and their effects on the cell ID assignment process. This approach leads to optimized PCI assignments with the least interference possible. Minimizing the interference across PCIs improves the accessibility of the LTE network. It also leads to a more efficient way for utilizing the total number of PCIs in LTE networks. This methodology was tested on a simulated network of 39 cell sites. The procedure determined that with just 35 PCIs, the same performance can be achieved as of assigning all 504 PCIs to the same network. This will spare PCIs for future network expansion and can be used by other network providers.
Keywords:
PSS, SSS, Zadoff-Chu, LTE, RF Planning, Coverage Planning, Correlation Matrix, Cellular Planning
Cite this paper: Zaid Matloub, Ivica Kostanic, Methodology for the Physical Cell Identity Assignment in LTE Networks, International Journal of Networks and Communications, Vol. 3 No. 5, 2013, pp. 111-117. doi: 10.5923/j.ijnc.20130305.01.
1. Introduction
A demand for high speed broadband services has increased enormously for the last few years especially when people started using their mobile devices for Internet access and data services. Mobile communications standards (e.g. GSM, UMTS, and HSPA) are continuously developing to meet this growing need. The Long Term Evolution (LTE) is a 4G wireless broadband technology developed by the Third Generation Partnership Project (3GPP) and first published in March of 2008. LTE is considered to be the successor of the popular UMTS and HSPA standards. The main goals of LTE are to provide higher speeds and improved coverage range using the latest achievements in wireless communication technology.The efficiency of the LTE systems depends on the range of the cell radius. For maximum performance benefits, the cell radius should not exceed 5 km (3.1 miles). For reasonable performance with slight degradation in spectrum efficiency and throughput, the cell radius should be no more than 30 km (18.64 miles). Increasing of the cell radius beyond 30 km results in a significant performance degradation[1].In wireless communication standards like GSM, UMTS and LTE, several procedures are performed to enable the User Equipment (UE) to connect to the network and start communicating.Once the UE is turned on, the initial procedure of connecting to the network and getting an ID assigned can be summarized in three general steps:1. The UE performs frequency scanning to identify the strongest signal in the radio spectrum.2. The UE performs the cell search procedure that is specific to the standard being used. This is done in order to get frame synchronization and cell ID information.3. After obtaining the cell information, the network registration and data transfer process begins.The LTE cell search and ID assignment procedure consists of four major steps[2]:1. Detection of the Primary Synchronization Signal (P-SS). 2. Detection of the Secondary Synchronization Signal (S-SS). 3. Detection of downlink reference signal used for channel estimation in coherent detection at the UE[3]. 4. Extraction of Physical Broadcast Channel (PBCH) carrying the Primary Broadcast Transport Channel and the Master Information Block that includes the overall downlink transmission bandwidth[4].The P-SS and S-SS use Zadoff-Chu and M-Sequences respectively where these sequences should have good correlation properties. The cross correlation properties are important since they determine the level of interference between two different synchronization signals sequences. Studies conducted so far on the importance of cross correlation properties in Cell ID assignment procedure solely led to the conclusion that the cross correlation properties in these sequences should be low in order to have minimal noise/interference levels between the cell IDs. If that is the case, a highly efficient way for discriminating multiple users within the LTE network coverage is provided. However, most of the research papers analyze only the correlation properties in P-SS sequences but completely ignored the analysis of correlation properties in S-SS although both of these signals are consecutively used in cell ID assignment process and their respective correlation properties are equally important[5,6,7].The main focus of this paper is on the cross-correlation properties between the synchronization signals sequences and their effect on the Cell-ID assignment process.
2. PCI Planning Methodology
There are 504 Physical layer Cell Identities (PCIs) in the LTE system[8]. The PCIs are combined into 168 unique groups. Each group contains 3 unique cell identities[9]. The combination is such that each PCI is a member of only one PCI group[8, 9, 10]. The 168 cell groups are distinguished by 168 different sequences. Each PCI in a cell group has a unique P-SS making a total of 504 cell IDs[9, 11].The goal of the PCI planning is the development of the best possible ID assignment given the fact that certain PCI assignments result in interference. PCIs are assigned to cells such that the interference is minimized. This objective can be attained by following a particular workflow. Workflow proves that the correlation properties of the synchronization signals sequences have a major impact on the Cell ID assignment process. The methodology can be divided into the following steps as shown in Figure 1.1. Developing Cost Matrices of PCIs2. Propose and evaluate the PCI assignment by:a. Assigning PCIs randomly to all cells within the planned coverage areab. Determining the collective cost for the PCI assignments c. Repeating steps a and b for N-trials to identify which ID assignment has the smallest cost. | Figure 1. Workflow Methodology |
2.1. Developing PCIs Cost Matrices
The main objective of developing cost matrices is to determine the effect of the PCI assignment process on the self-induced interference. This is done by evaluating the penalty associated with each PCI assignment in the PCI assignment process. There are two important components that are considered in penalty calculation:• Cross correlation values between all possible PCIs • Signal to noise ratio among the cell sites. The penalty associated with PCI assignment is considered to be the ratio of the cross correlation values between the PCIs and their SNR values as given in equation 1. | (1) |
Where: :Scaling factor
 : Correlation values between the PCIs
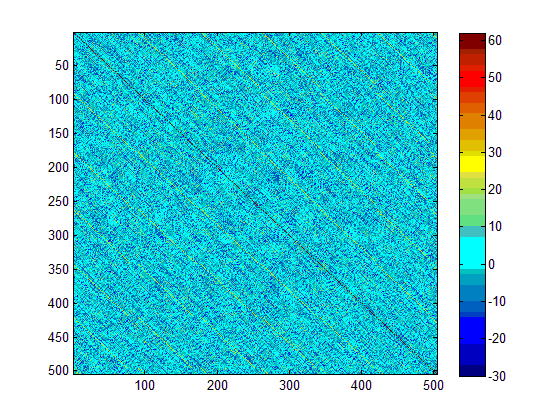
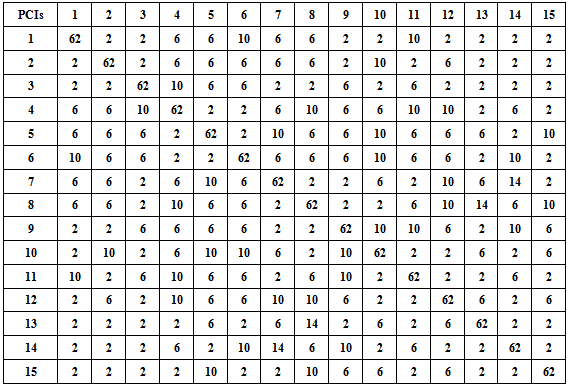
 : The signal to noise ratio threshold level where 95% of the SNR values between the PCIs are above this level.For the generation of the correlation matrices, the synchronization signals sequences should be generated first with respect to the 3rd Generation Partnership Project Technical Specification (3GPP-TS 36.211 v8.7.0)[9].Hence, the correlation penalty is determined by taking the dot product of these sequences. Table 1 illustrates the correlation values of the first 15 SSS. An example of the cross correlation matrix of SSS is shown in Figure 2.
 | Figure 2. Cross-correlation Matrix |
Table 1 shows that the main diagonal of the matrix has the highest correlation since the synchronization signals sequences length is 62. This represents the auto correlation of these sequences. It may be observed that some pairs of PCIs have higher cross correlation than others. For example the cross correlation between PCI (7) and (14) is 14/62 which is higher than the cross correlation between PCI (7) and (15) which come out to be only 2/62. This imply that assigning PCI (7) and (14) in the same area will result in an increased level of interference. This can be avoided by carefully assignment of PCIs that have least correlation in the specified area.The process of finding the Signal to Noise ratio is done by following two steps:• Calculating the signal level in each location of the specified area.• Recognizing the strongest server in the area where the strongest server will be considered as the preferred signal and other signals will be considered as interferers.
2.1.1. Signal Level Calculations
For network coverage simulation, the first step is to select a suitable path loss model for estimation of the received signal level in each location of the coverage area. In this work, Log-distance path loss model is being used for the network coverage simulation. The path loss model does not take into account the shadowing component (as stated in equation 2). As a result, the accuracy of the model is decreased. However this has negligible impact on the conclusions in this work. This path loss model has been chosen due to its simplicity and its linear properties corresponding to signal power along with the distance after neglecting the log-normal shadowing factor[12]. | (2) |
2.1.2. Strongest Server Calculations
The second step in the signal to noise ratio calculation process is the recognition of the strongest server at each location of the specified area. This is done by analyzing the signal levels in each and every location received from different servers. The received signals at each location should be arranged according to their signal levels and are classified in three categories[13]. The highest signal level received at a certain location is called the strongest server. The signal levels that are above a certain threshold but they are still not the strongest, are called the potential servers. The signals level that are below the threshold level (i.e. they cannot be either strongest servers or potential servers) but they are still above the noise floor, are considered to be the interferers. At the end of this step, the SNR will be calculated as the ratio between the strongest server and the other received signal levels in a particular location. For each cell these SNRs will be expressed by a threshold level where 95% of these values are above this level. The resultant matrix is called the interference matrix IM matrix.
2.2. Best PCI Assignment Selection Process
Once the calculations of the signal to noise ratio is done and cross correlation values between all possible PCIs are found, then finding the penalty that affects the cell ID assignment process becomes straightforward.As mentioned earlier, the number of PCIs is limited to 504. Due to this limitation these PCIs should be assigned in a way that avoids the same PCI assignment to the neighboring sites to prevent conflicts and undesirable interference. In this methodology, the network coverage is assumed to be planned and random assignment method was used to assign PCIs to the serving cells with respect to equation (3). | (3) |
At the end of the random assignment process, penalty associated with each assignment should be calculated in order to determine the best possible assignment.Table 1. Cross correlation values among Ids
 |
| |
|
To test the methodology, 39 PCIs are assigned randomly to the cell sites for N number of times. After the assignment process, the penalty calculations were carried out in the following manner:a. Extraction of the correlation value with the respect to the PCI assigned from the correlation matrix. The resultant matrix is a 39×39 matrix.b. The resultant matrix is then divided by the interference matrix (IM matrix) to form the penalty matrix.c. The total penalty per assignment is calculated by summing the elements of the penalty matrix.d. This process repeated for N trials, the assignment with the least penalty is considered to be the best assignment.The reason behind doing different number of trials is to identify the minimum number of trials required to obtain the lowest possible penalty and therefore the best possible assignment. Testing different number of random assignments and analyzes how this affects the penalty in the process of scoring the best assignment has been conducted. Figure 3 describes the process of selecting the best cell ID assignment.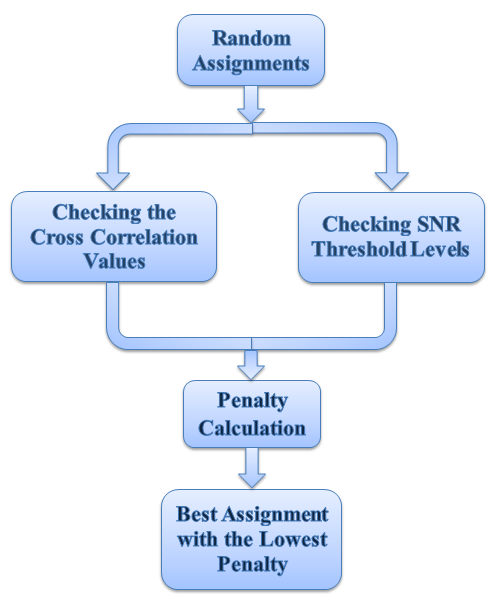 | Figure 3. Best ID assignment selection process |
3. Penalty Analysis of the ID Assignment Process
All 504 IDs were assigned randomly with different number of trials. In each trial penalty was calculated and the IDs reuse frequency was determined. This procedure was repeated three times, the minimum penalty obtained was 190.89 with 5000 trials in the second run and the average penalty of the three runs was 192.39. The maximum IDs reuse frequency came out to be 2. Figure 4 shows penalty versus number of trials. It can be observed from the figure that after 2000 random trials, the value of the penalty got saturated.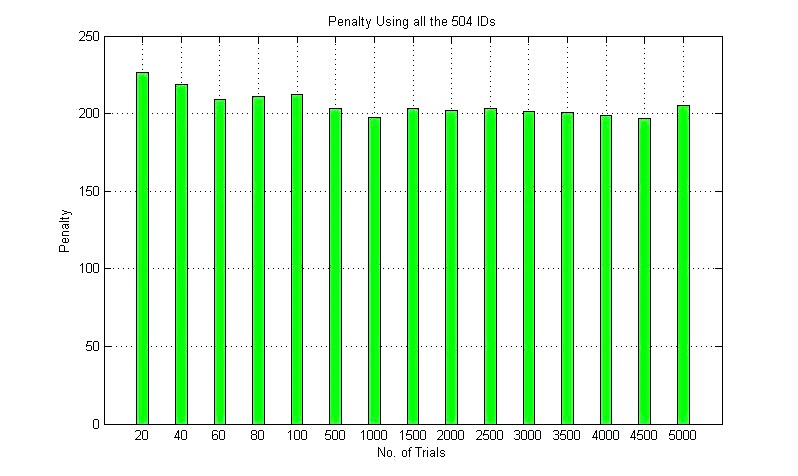 | Figure 4. Penalty calculation using all 504 IDs |
After finding the lowest penalty, the assignment with the minimum penalty was chosen and is shown in Figure 5.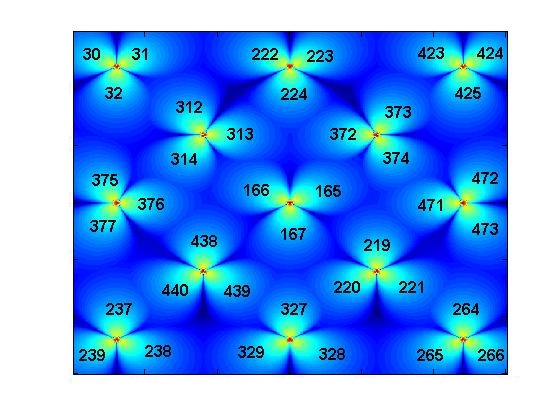 | Figure 5. Best assignment using all 504 IDs |
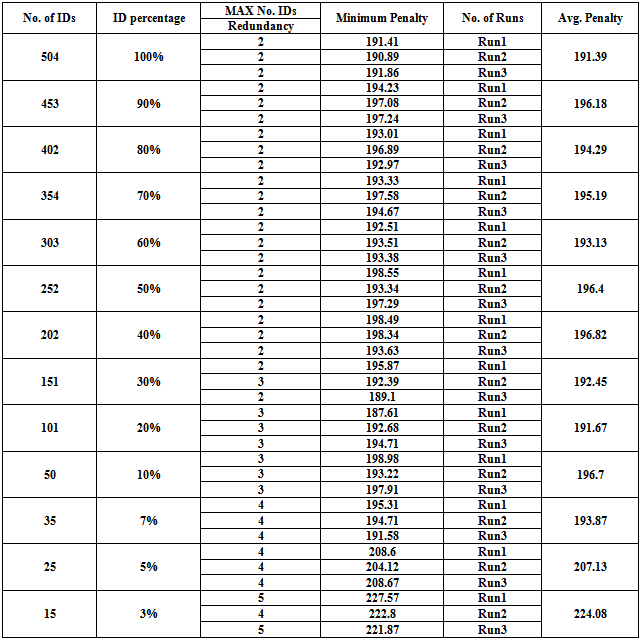
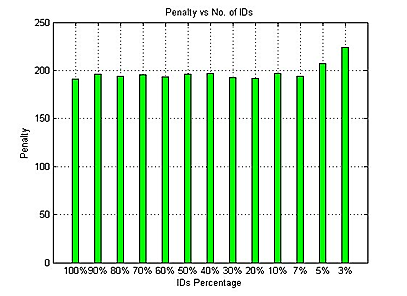
The next aim was to determine the minimum number of IDs that can be assigned having similar or comparable penalty value as when using all 504 IDs. This result is very important because it maintains the minimum interference level without consuming all the 504 IDs. This spares IDs that are different from the current assigned IDs for future network expansion or can be used by other network providers.The approach was tested by decreasing the percentage of the number of IDs by 10% consecutively and finding the penalty in each case. Table 2 illustrates the results of all the trials performed.Table 2. Penalty calculations
 |
| |
|
 | Figure 6. Penalty calculation using 90% of the 504 IDs |
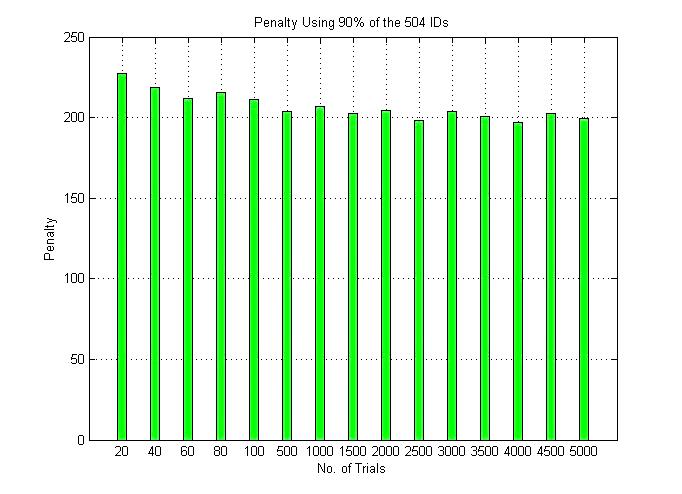
When 453 IDs were assigned randomly (90% of the total IDs) with different number of trials, the minimum penalty obtained was 194.23 with 2500 trials in the first run and the average penalty of the three runs was 196.18. The maximum IDs reuse ratio came out to be 2. These results are almost the same as compared of using all the 504 IDs since we have only 39 cells. Figure 6 show the results of penalty calculations using 90% of the IDs.It can also be observed from the figure that after 2500 random trials, the value of the penalty got saturated which is very close to the previous result.As illustrated in Table 2, the average penalty remained almost the same while assigning 7% to 100% of the 504 IDs. The penalty started to increase when less than 7% of the IDs were assigned.This can be easily explained since 7% of 504 IDs is around 35 IDs and these IDs were assigned to only 39 cells distributed in a uniform manner. Figure 7 shows the results of penalty calculations when 7% of the IDs were assigned.It may be observed from Figure 7 that the minimum penalty obtained was 191.58 and the average penalty of the three runs was 193.87 which is very close to the previous results. The maximum IDs reuse ratio increased to be 4 in this case. However, it did not have noticeable impact on the penalty.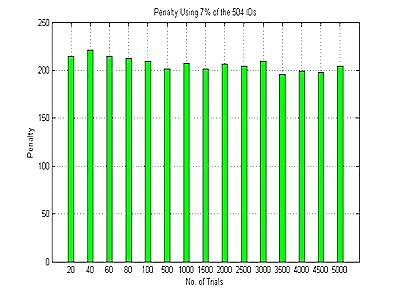 | Figure 7. Penalty calculation using 7% of the 504 IDs |
When only 25 of the IDs were assigned randomly (5% of the total IDs) with different number of trials, the minimum penalty obtained was 204.12 and the average penalty of the three runs was 207.13. The maximum IDs reuse ratio came out to be 5. Figure 8 shows the results of penalty calculations when 5% of the IDs were assigned.It is noticeable that there is an increase in the penalty when the number of the assigned IDs was decreased. This increase in penalty is due to the correlation among the assigned IDs sequences. Figure 9 illustrates the penalty versus the Number of IDs.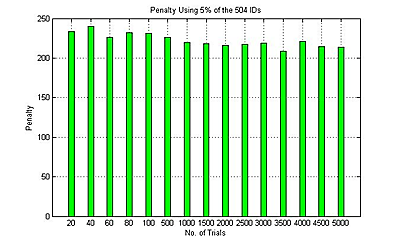 | Figure 8. Penalty calculation using 5% of the 504 IDs |
 | Figure 9. penalty versus the Number of IDs |
4. Conclusions
This paper presented an efficient methodology for PCI assignment in LTE networks. This approach leads to optimized PCI assignments with the least interference possible. Minimizing the interference across PCIs improves the accessibility of the LTE network. It also leads to a more efficient way for utilizing the total number of PCIs in LTE networks.The methodology considers the correlation properties of the physical layer synchronization signal sequences and their effects on the cell ID assignment process. This is done by developing cost matrices of PCIs and evaluating the PCI assignment which is performed by randomly assigns PCIs to all cells within the planned coverage area. The next step involves the calculation of the collective cost for the PCI assignments. This process was repeated for number of trials to identify the ID assignment that has the smallest cost. This methodology was tested on a simulated network of 39 cell sites. The procedure determined that the minimum number of PCIs required for having the same performance as of assigning all 504 IDs to the same network. The tests performed on the simulated network illustrated that utilizing only 7% of the total IDs can be as efficient as utilizing the entire 504 IDs.This leads to the conclusion that the 504 IDs are adequate for future network expansion or efficiently shared by different network providers in a specified area with the minimum ID reuse. This ensures the minimum interference between different networks and promotes the efficiency of PCI planning.
5. Future Work
In this paper the step for PCI assignment utilized random assignment scheme. This type of search through sample space is known to be inefficient and it is used here for the sake of simplicity. Also, since the problem of PCI assignment is mildly constraint, use of the random search was appropriate. Future work may include introduction of some systematic methodology for search through sample space. Approaches based on Simulated Annealing, Graph coloring, Neural Networks, Linear programming and some others may be considered.
References
| [1] | Zyren, J. (2007, July). Overview of the 3GPP Long Term-Overview of the 3GPP Long Term. (D. W. McCoy, Ed.) |
| [2] | HendraSetiawan, H. O. (2009). Common Wireless Communication Services Recognition for GSM, UMTS and LTE via Synchronization Channels Detection. IEEE. |
| [3] | Roessler, A., & Gessner, C. (2009, April). LTE technology and LTE test;a deskside chat. Rohde & Schwarz. |
| [4] | Qualcomm (2010) LTE: Overview and Deployment Considerations 80-W2691-1 Rev A Spring 2010. |
| [5] | Liu, Y., Li, W., Zhang, H., & Lu, W. (2010). Graph based automatic centralized PCI assignment in LTE. IEEE, 919-921. |
| [6] | J. Salo, M. N.-A., & Chang, K. (2010, November). Practical Introduction to LTE Radio Planning. |
| [7] | Lee, P., Jeong, J., Saxena, N., & Shin, J. (December 2009). Dynamic Reservation Scheme of Physical Cell Identity for 3GPP LTE Femtocell Systems. Journal of Information Processing Systems, Vol.5, No.4, 207-220. |
| [8] | Holma, H., & Toskala, A. (2009). LTE for UMTS – OFDMA and SC-FDMA Based Radio Access. Nokia Siemens Networks, Finland: John Wiley & Sons. |
| [9] | 3GPP Technical Specifications. (2009, May). 3rd Generation Partnership Project;Technical Specification Group Radio Access Network;Evolved Universal Terrestrial Radio Access (E-UTRA);Physical Channels and Modulation (Release 8). |
| [10] | Samavedam, N. P. (2011). Mobile Cell Search and Synchronization in LTE. San- Diego State University, California, USA. |
| [11] | Kim, I., Han, Y., & Chung, H. K. (January 2010). An Efficient Synchronization Signal Structure for OFDM-Based Cellular Systems. IEEE Transactions on Wireless Communications, Vol. 9, No. 1, 99-105. |
| [12] | Stine, J. A. (2007, January). A Location-Based Method for Specifying RF Spectrum Rights. IEEE. |
| [13] | Korowajczuk, L. (2011). LTE, WIMAX and WLAN Network Design,Optimization and Performance Analysis. CelPlan Technologies, Inc., Reston, VA, USA: Wiley. |


 :Scaling factor
 : Correlation values between the PCIs
 : The signal to noise ratio threshold level where 95% of the SNR values between the PCIs are above this level.For the generation of the correlation matrices, the synchronization signals sequences should be generated first with respect to the 3rd Generation Partnership Project Technical Specification (3GPP-TS 36.211 v8.7.0)[9].Hence, the correlation penalty is determined by taking the dot product of these sequences. Table 1 illustrates the correlation values of the first 15 SSS. An example of the cross correlation matrix of SSS is shown in Figure 2.


 Abstract
 Reference
 Full-Text PDF
 Full-text HTML
