-
Paper Information
- Paper Submission
-
Journal Information
- About This Journal
- Editorial Board
- Current Issue
- Archive
- Author Guidelines
- Contact Us
International Journal of Networks and Communications
p-ISSN: 2168-4936 e-ISSN: 2168-4944
2013; 3(4): 99-109
doi:10.5923/j.ijnc.20130304.01
Comparative Analysis of Bright Band Data from TRMM and Ground Radar Data in Malaysia
 Abstract
 Reference
 Full-Text PDF
 Full-text HTML
Abayomi Isiaka O. Yussuff1, 2, Nor Hisham Haji Khamis2
1Department of Electronic & Computer Engineering, Lagos State University, Lagos, Nigeria
2Department of Communications Engineering, Universiti Teknologi Malaysia, Skudai, Malaysia
Correspondence to: Abayomi Isiaka O. Yussuff, Department of Electronic & Computer Engineering, Lagos State University, Lagos, Nigeria.
| Email: |  |
Copyright © 2012 Scientific & Academic Publishing. All Rights Reserved.
Good knowledge of the formation and recognition of the bright band is necessary to determine the location of the melting layer. This is partly because the melting layer is one of the major hydrometeors (others include as rain, hail, and cloud) responsible for signal degradations along the slant-path, in the tropical regions of the world. These may result in signal fading, amongst others, which may lead to errors in slant-path attenuation predictions. This paper involves the comparative analysis of radar data sourced from both ground 3D RAPIC bistatic radar and space-borne precipitation radar above the Malaysian air space. For this research work, the terrestrial meteorological radar data were sourced from the Meteorological Department of Malaysia, while the satellite radar data were obtained from the near-real-time TRMM Multi-Satellite Precipitation Analysis (TMPA-RT) version 7 products. Frozen hydrometeors are observed to exhibit peculiar characteristics in terms of increased radar reflectivity as they fall from the sky, transiting from solid to liquid, and manifesting in the popular bright band signature. The melting layer is the region where melting occur, just below the 0℃ isotherm height. It is a major factor responsible for the problems being encountered in characterization and modelling of microwave signal propagation along the earth-space link.
Keywords: Bright Band, TRMM, VRP, Radar, 0℃ isotherm, Stratiform rain, Rain height
Cite this paper: Abayomi Isiaka O. Yussuff, Nor Hisham Haji Khamis, Comparative Analysis of Bright Band Data from TRMM and Ground Radar Data in Malaysia, International Journal of Networks and Communications, Vol. 3 No. 4, 2013, pp. 99-109. doi: 10.5923/j.ijnc.20130304.01.
1. Introduction
- Tropical Rain Measurement Mission (TRMM) was a joint project between the US National Aeronautics and Space Administration (NASA), and Japan National Space Development Agency of Japan (NASDA) and Communication Research Laboratory (CRL). It was launched on November 27,1997 into a near circular orbit of approximately 350 Km altitude with an inclination angle of 35 degrees and a period of 91.5 minutes (that is, 15.7 orbits per day). Japan developed the world's first space-borne precipitation radar, and provided an H-II rocket to launch the TRMM satellite into orbit. The US provided the observatory, four other sensors (visible infrared scanner (VIRS), TRMM microwave imager (TMI), lighting imaging sensor (LIS), and cloud and earth’s radiant energy system (CERES)), and the satellite operation systems. TRMM observation data are processed in both countries and distributed among users. The satellite altitude was boosted in August 2001 to approximately 402.5 Km with a period of 92.5 minutes (15.6 orbits per day) to extend the lifetime by reducing atmospheric drag.The Precipitation Processing System (PPS) is the data processing and science information system for TRMM and GPM (Global Precipitation Measurement). The GPM is the planned global successor to the TRMM, and was scheduled to be launched into space in mid-2014. The Earth Observing System Data and Information System (EOSDIS) is the long-term archive for all TRMM data products. TRMM PR is used to estimate monthly mean rainfall with a resolution of 5 degree-by-5 degree latitude–longitude over the tropical regions’ precipitation, over both land and ocean. Sampling errors and related biases, such as beam filling errors[1] are reduced by its low altitude (350 Km) and low inclination (350). The non-sun-synchronous orbit makes it possible to sample virtually all local times over the course within a few weeks while at the same time reducing the diurnal bias drastically[2]. It also provides 3-dimensional radar reflectivity data. The frequency of the TRMM PR is 13.8 GHz at an approximate wavelength of 2.2 centimeters, and with a spatial resolution of approximately 4.5 Km (footprint). The vertical resolution is 250 metres, while its nominal sensitivity is approximately 17 dBZ[3]. It has a surface clutter-limited swath of about 220 Km[4-5].Rain height is highly correlated with signal attenuation and co-channel interference resulting from scattering. The rain height distribution can be used to investigate the mechanisms responsible for variations in the attenuation distributions at any location. Rain height is one the prediction methods being used to estimate the degree of signal attenuations. The rain height (
 ) is also directly related to the 0℃ isotherm height (
 ). Rain height information can be obtained indirectly by studying the melting layer height in stratiform rain type. One major source of attenuation prediction errors along the slant-path is the complex nature of the rainfall structure along this path. Equally is the uncertainty in the estimation of attenuation due to the melting layer. Additionally, difficulties encountered in relating
  to
to  , particularly in the tropical regions is attributable to insufficient database as well as the peculiarity of the rainfall types existing in such regions[6]. The rain height is the boundary between the rain region and the snow region and often corresponds to the 0℃ isotherm height. In the vertical dimension, the rainfall rate is assumed to be constant up to the point that represents the top of the rain height. Attenuation beyond the rain height is generally considered insignificant, and thus neglected[7].However, recent research has shown that the effect of melting layer on signal attenuation may not be negligible as popularly believed, especially for weaker rain rates[8]. Good understanding of the Bright band layer can provide information about the microphysical processes involved in the precipitation (Table I). The reflectivity factor of a radar is given as:
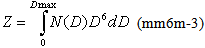 | (1) |
 | (2) |
 | (3) |
 | (4) |
 | (5) |
 , hydrometeors changes from solid to liquid in the melting layer, leading to increase in their reflectivity; manifesting in the bright band signature seen in radar measurements. This band identification is made possible because of its sharp peak of reflectivity in high frequency domain[10-12]. Furthermore, if the bright-band was not recognized, it can result in serious over-estimation of precipitation reaching the ground by a factor as high as five[13].The melting layer is a major factor responsible for the problems being encountered in characterization and modelling of microwave signal propagation. It the region where melting occurs; lying just below the 0℃ isotherm height. The importance of system modelling in link budget analysis and equipment designs cannot be over- emphasized [14]. The 0℃ isotherm is that height at which the ice-to-water transition begins. The variances in the propagation characteristics of ice and water presents an effective boundary referred to as the bright band. The height of the bright band is close to that 0℃ isotherm, depending on the season and location of the station of interest[15-19]. The 0℃ isotherm, rain and bright band heights are most often observed to lie close to each other (Figure 1), even though they technically represent different meteorological parameters. The difference between the effective rain height and the freezing height is taking to be 360 meters according to[15], and it is expressed as:
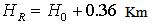 | (6) |
 represents the mean rain height above mean sea level and
  is the mean 0℃ isotherm height above mean sea level. Frozen hydrometeors shows a typical enhancement of radar bistatic reflectivity (dBZ) as they fall through the melting layer, followed by a sharper decrease in reflectivity during the following stages of the melting process[17], as shown in Figure 1. As a result, a handful of models have been developed and proposed by several researchers for predicting attenuation in the melting layer[8, 20-23].
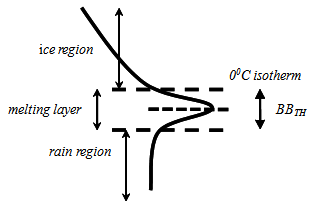 | Figure 1. Bright Band Conceptual Model |
2. Methodology
- The meteorological radar data employed in this analysis were obtained from versions 6 standard products of the TRMM precipitation radar (PR) and the near-real-time TMPA-RT version 7 products. The TRMM PR is one of the five instruments that are on-board the TRMM satellite. It measures the returned power at 13.8 GHz at 2.17 cm wavelength. The PR scans across the ground track of the satellite once every 0.6 seconds, and with a 350 scan angle, which corresponds to a swath width of 220 Km. The vertical resolution is 250 metres, and nominal sensitivity of approximately 17 dBZ. The TRMM PR 3A25 data product computes the monthly statistics of the PR measurements at both a low horizontal resolution of 50 x 50 latitude-longitude and a high horizontal resolution of 0.50 x 0.50 latitude-longitude. The low resolution grids are in the Planetary Grid 1 structure and include mean and standard deviation of the rain rate, reflectivity, path-integrated attenuation (PIA), storm height, Xi, bright band height and the NUBF (Non-Uniform Beam Filling) correction, rain fractions and histograms of the storm height, bright-band height, etc. The high resolution grids in the Planetary Grid 2 structure are used to compute mean rain rate, standard deviation and rain fractions[24]. The low resolution grids which are in the Planetary Grid 1 structure were used in this work. This is because the Grid 2 structure is replete with large numbers of missing data; thus impinging on its data reliability and integrity.The data used in these analyses spans thirteen months (November 2006 to November 2007) for the ground radar, while that of the TRMM is from January 2001 to May 2013 (twenty-two months). The wider data capture window of the TRMM is to statistically make up for some of the missing or compromised data due to the inherent susceptibility of the source to error, resulting from the relative remote proximity of the space-borne PR instrument. Johor is a tropical station with geographical longitude and latitude of 103.750E and 1.450N, respectively.
3. Results and Discussions
- The TRMM vertical reflectivity profiles are displayed in Figures 1-6, while that of the ground radar are shown in Figures 7-10. The VRP plots in Figure 2 are obtained from the version 6 standard products of the TRMM precipitation radar data. It is observed from the Figure that the bright band is not clearly defined; hence underscoring the need for a better standard algorithm as evidenced in the other improved plots (Figures 3-7), with more visibly defined bright band signatures. These plots are representatives of the TRMM’s version 7 standard products, underpinning the better quality derivable from this improved standard. Consequently, data from version 6 products shall be neglected in further analysis.Figures 7-10 are the results of the extension of the analysis of the work reported in[14]. The month-to-month variations for
 ,
,  ,
,  , and
, and  for 2007 is shown in Figure 14. The mean values for these parameters for the thirteen months under investigation are 6.6 Km, 4.71 Km, 3.03 Km and 1.68 Km respectively.The TRMM PR month-to-month variations for
  ,
,  ,
,  , and
, and  for some months in 2011, 2012 and 2013 are shown in Figures 11-13. Both sets of data (TRMM PR and ground radar) are observed to show similar patterns in month-to-month variations as can be observed in Figures 11-14.
 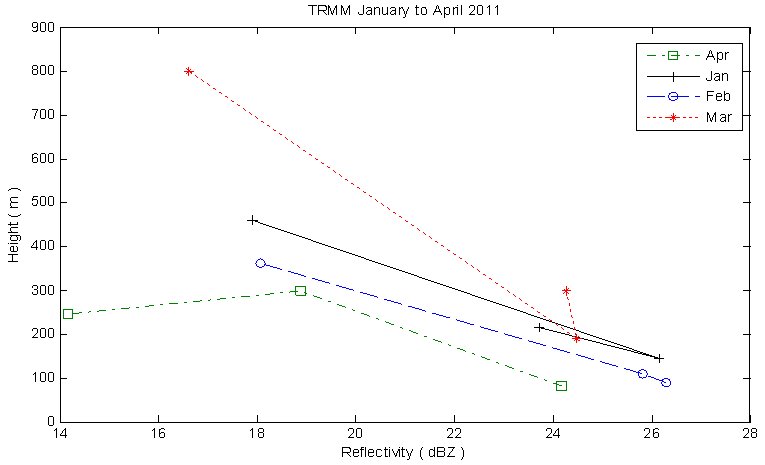 | Figure 2. TRMM VRP plot for the months of January-April 2011 for Johor, Malaysia |
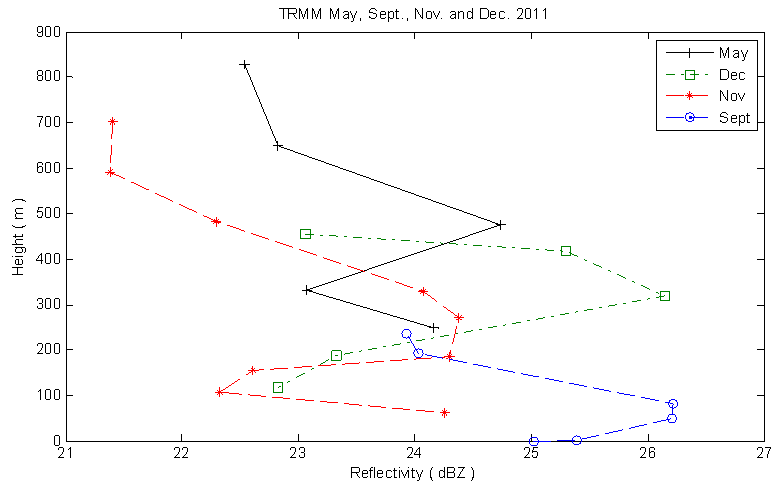 | Figure 3. TRMM VRP plot for the months of May, September, November and December 2011 for Johor, Malaysia |
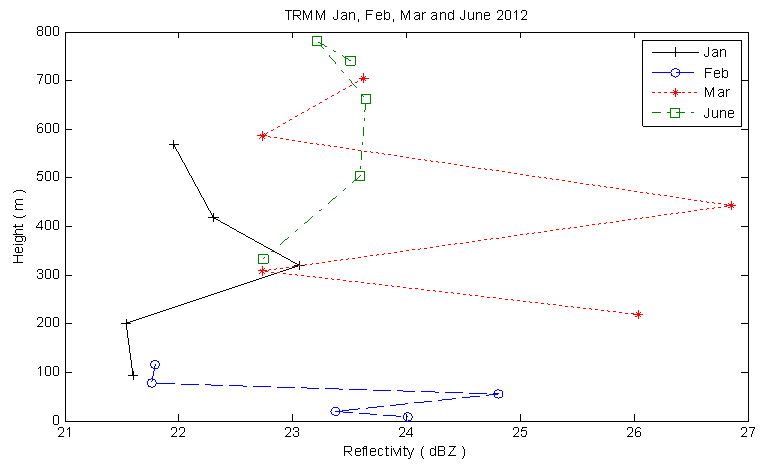 | Figure 4. TRMM VRP plot for the months of January, February, March and June 2012 for Johor, Malaysia |
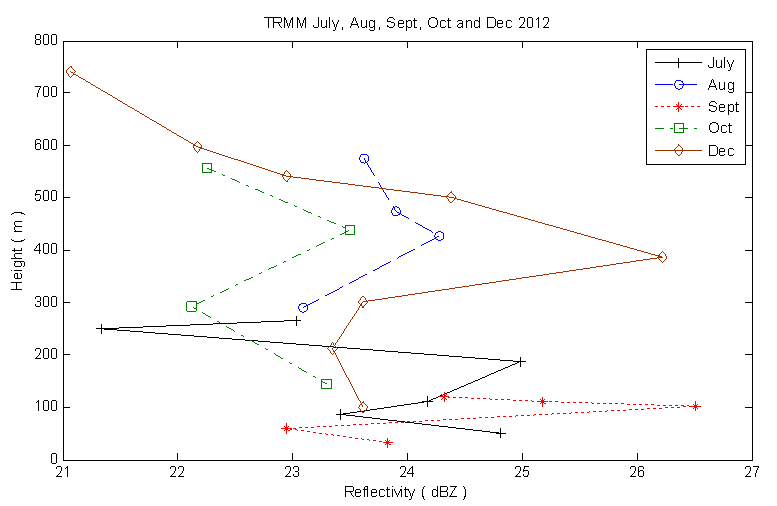 | Figure 5. TRMM VRP plot for the months of July, August, September, October and December 2012 for Johor, Malaysia |
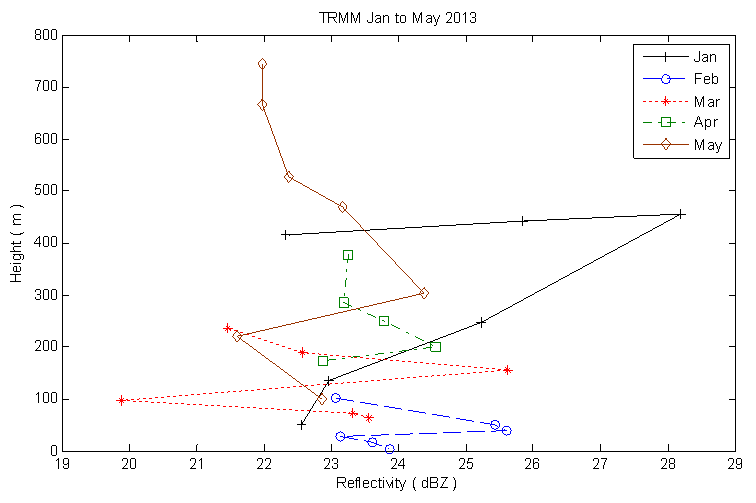 | Figure 6. TRMM VRP plot for the months of January-May 2013 for Johor, Malaysia |
 ,
,  ,
,  , and
, and  respectively). This may as a result of some of the missing or compromised data due to the relative remote location of the TRMM PR instrument.
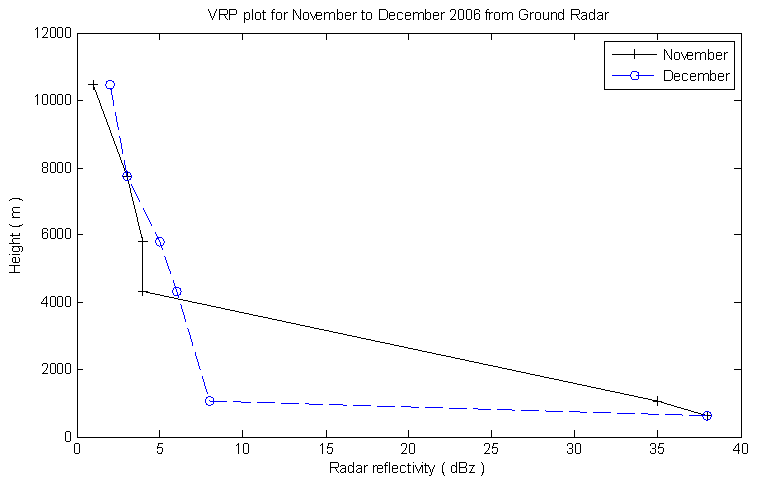 | Figure 7. Ground Radar VRP plot for the months of November-December 2006 for Johor, Malaysia |
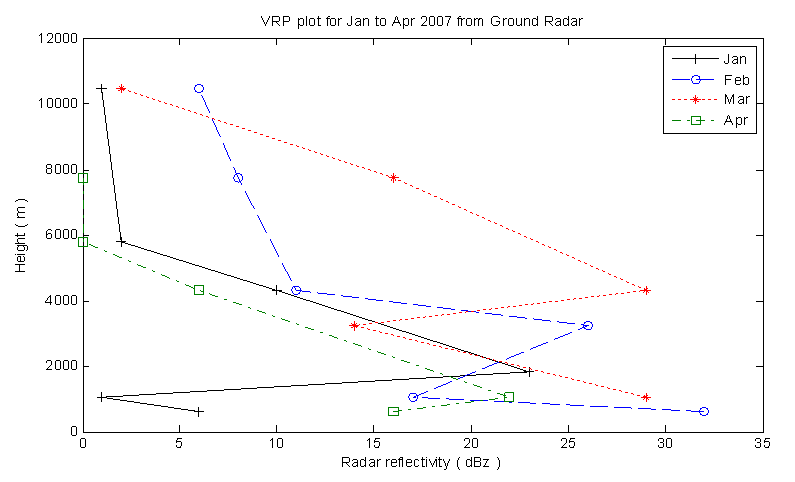 | Figure 8. Ground Radar VRP plot for the months of January-April 2007 for Johor, Malaysia |
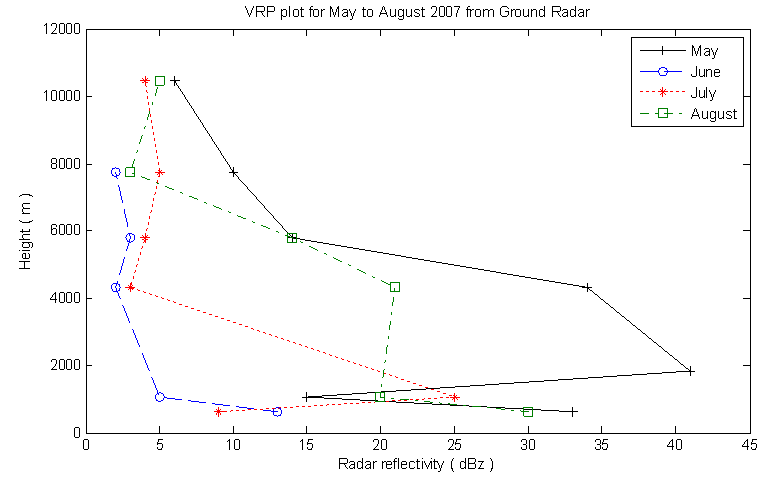 | Figure 9. Ground Radar VRP plot for the months of May-August 2007 for Johor, Malaysia |
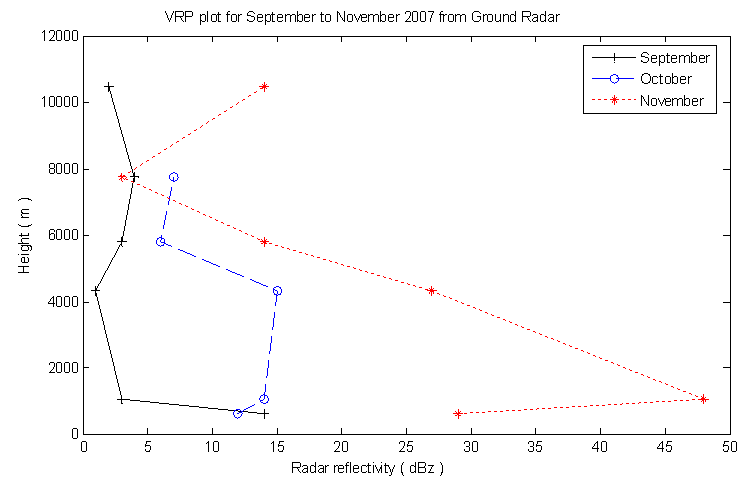 | Figure 10. Ground Radar VRP plot for the months of September-November 2007 for Johor, Malaysia |
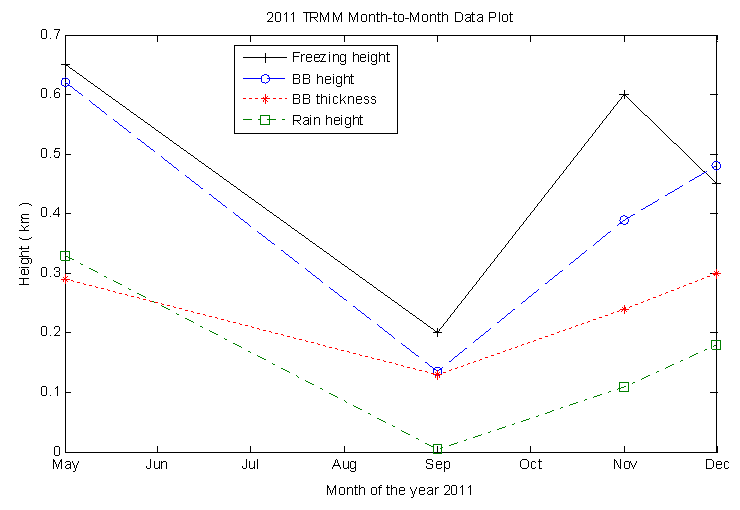 | Figure 11. TRMM Month-to-month variation for  , ,  , ,  , and , and  for 2011 for 2011 |
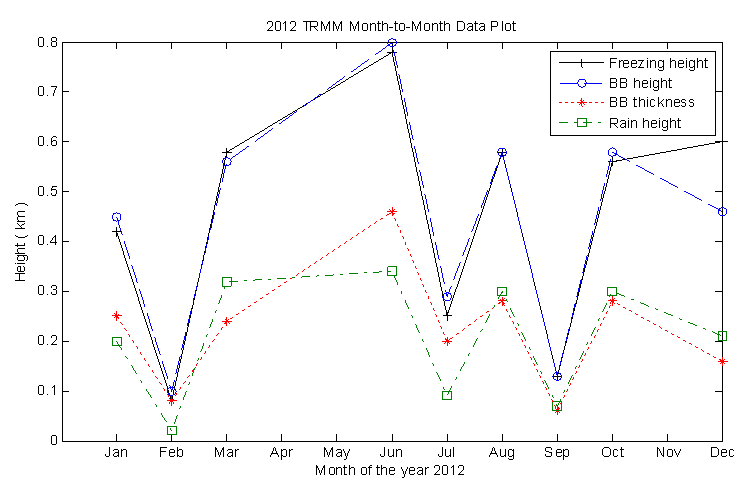 | Figure 12. TRMM Month-to-month variation for  , ,  , ,  , and , and  for 2012 for 2012 |
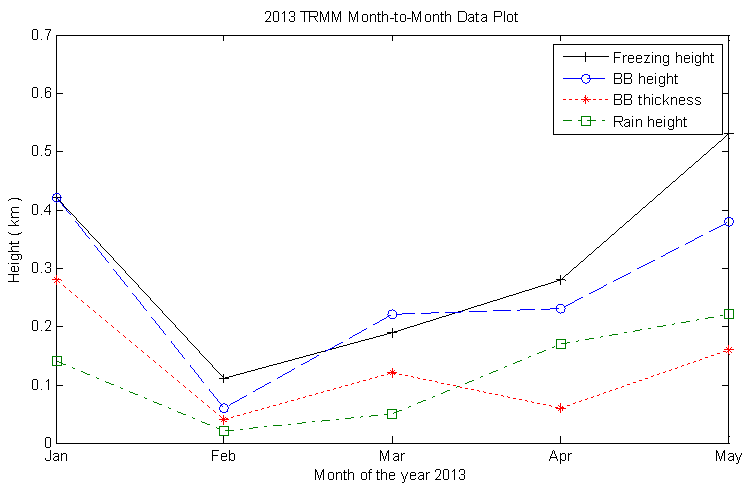 | Figure 13. TRMM Month-to-month variation for  , ,  , ,  , and , and  for 2013 for 2013 |
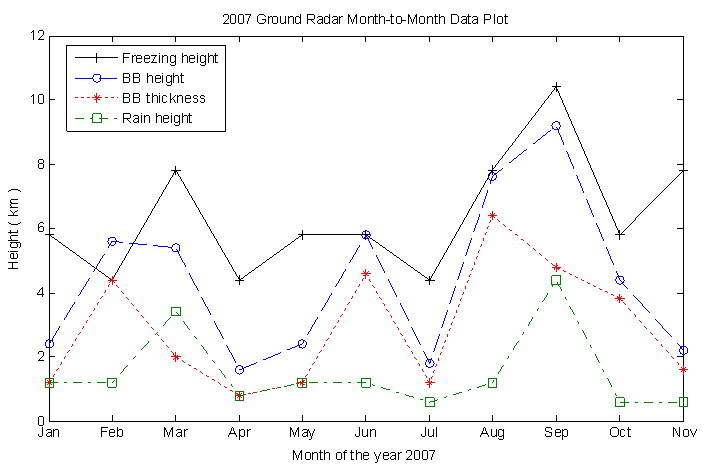 | Figure 14. Ground Radar Month-to-month variation for  , ,  , ,  , and , and  for 2007 for 2007 |
4. Conclusions
- The results of the comparative analysis of the processed ground radar data with the TMPA-RT PR derived data showed a good degree of agreement in terms of pattern variations of the measured parameters. The 0℃ isotherm and rain heights experiences peak and low values in the months of March and September; and February and July respectively for both TMPA-RT PR and ground radar data. More research work need to be carried out in this area to further augment the current lean database ultimately for more effective research results in the tropical stations of the world.
References
| [1] | Chiu, Long S., Gerald R. North, David A. Short, and Alan McConnell. "Rain estimation from satellites: Effect of finite field of view." Journal of Geophysical Research: Atmospheres (1984–2012), vol. 95, no. D3, pp. 2177-2185, 1990. |
| [2] | D. B. Shin, and Gerald R. North, “Errors incurred in sampling a cyclostationary field,” Journal of Atmospheric and Oceanic Technology, vol. 17, no. 5, pp. 656-664, 2000. |
| [3] | E. N. Anagnostou and C. A. Morales, “The use of TRMM Precipitation Radar Observations in Determining Ground radar Calibration Biases”, Journal of Atmospheric and Oceanic Technology, vol.18, Pg. 618, 2001. |
| [4] | Ziad S. Haddad and Kyung-Won Park, “Vertical Profiling of Tropical Precipitation using Passive Microwave Observations and its Implications regarding the crash of AF447”, Journal of Geophysical Research, 115(D12), D12129, 2010. |
| [5] | J. Simpson J. et al, “On the Tropical Rain Measuring Mission (TRMM)”, Meteorological Atmospheric Physics, Vol. 60, p. 19-36, 1996. |
| [6] | G. O. Ajayi and P. A. Odunewu, “Some Characteristics of the Rain Height in a Tropical Environment,” IEEE Transactions on Antennas and Propagation, pp. 80-82, 1984. |
| [7] | E. S. M Thurai, K Okamoto, “Rain Height Variability in the Tropics and Implications for Rain Scatter Interference,” IEEE Transactions on Antennas and Propagation, pp. 997-1001, 2005. |
| [8] | N. Takahashi, and J. Awaka, “Introduction of a melting layer model to a rain retrieval algorithm for microwave radiometers,” Geoscience and Remote Sensing Symposium, IGARSS'05 Proceedings, vol. 5, pp. 3404-3409, 2005. |
| [9] | J. S. Marshall and, W. M. K. Palmer, “The distribution of raindrops with size”, Journal of meteorology, vol. 5, no. 4, pp. 165-166, 1948. |
| [10] | L. Raymond et al , “Improved Modelling of Propagation and Backscattering of Millimeter waves in the Melting Layer”, IEEE National Conference on Antennae and Propagation, no. 461, pp. 160-163, 1999. |
| [11] | S. Das and A. Maitra, "Some melting layer characteristics at two tropical locations in Indian region." General Assembly and Scientific Symposium, 2011 XXXth URSI. IEEE, 2011. |
| [12] | K. Pipis, M. Ioannidou, and D. Chrissoulidis, “Comparison of radar reflectivity calculations to satellite measurements across the melting layer of precipitation”, General Assembly and Scientific Symposium, 2011 XXXth URSI IEEE, pp. 1-4, 2011. |
| [13] | J. Tan and J. W. F. Goddard, “The use of dual-polarisation techniques for bright-band detection with PPI-based radars”, In Radar Meteorology, IEE Colloquium, IET (11), pp. 1-6, 1995. |
| [14] | A. I. O. Yussuff and N. N. H. Khamis, “Determination of Bright Band in Malaysia through Radar Data Analysis,” International Journal of Research in Engineering and Science (IJRES), vol. 1, no. 3, pp. 334-39, July, 2013. |
| [15] | E. S. M Thurai, K Okamoto, “Rain Height Variability in the Tropics and Implications for Rain Scatter Interference,” IEEE Transactions on Antennas and Propagation, pp. 997-1001, 2005. |
| [16] | Khalid Mubara, Ali Dawood and Abdulaziz Al Dosary, “Global Mapping of Height of Bright-band”, IEEE, 2007. |
| [17] | Merhala Thurai, Eri Deguchi, Toshio Iguchi and Ken’ichi Okamoto, “Freezing height distribution in the tropics”, International Journal of Satellite Communications and Networking. Vol. 21, pp. 533-545, 2003. |
| [18] | N. H. H. Khamis, O. A. R. Sharif, Z Hanzaz., and A. Baharom, “Month-to-Month variability of the Melting Layer Boundaries”, Asia pacific Conference on Applied Electromagnetics Proceedings, Malaysia, 2007. |
| [19] | J. S. Mandeep, “Rain height statistics for satellite communication in Malaysia," Journal of Atmospheric and Solar-Terrestrial Physics, vol.70, pp.1617-1620, 2008. |
| [20] | W. Klaassen, “Radar observations and simulation of the melting layer of precipitation,” Journal of the atmospheric sciences, vol. 45, no.24, pp. 3741-3753, 1988. |
| [21] | Frederic Fabry and Wanda Szyrmer, “Modeling of the Melting Layer. Part II: Electromagnetic”, American Meteorological Society, pp. 3593-3600, 1999. |
| [22] | William Olson et al, “A Melting-Layer Model for Passive/ Active Microwave Remote Sensing Applications. Part I: Model Formulation and Comparison with Observations,” Journal of Applied Meteorology, vol. 40, no. 7, pp. 1145-1163, 2001. |
| [23] | M. Thurai, and H. Hanado, “Melting layer model evaluation using fall velocity spectra at Ku-band,” Microwaves”, Antennas and Propagation, IEE Proceedings, vol. 151, no. 5, pp. 465-472, 2004. |
| [24] | NASA, “Precipitation Processing System TRMM File Specification for TRMM Products”, version 7.001, pg. 205, 2011.http://disc.sci.gsfc.nasa.gov/gesNews/version_7_tmpa-rt_release |