-
Paper Information
- Paper Submission
-
Journal Information
- About This Journal
- Editorial Board
- Current Issue
- Archive
- Author Guidelines
- Contact Us
International Journal of Networks and Communications
p-ISSN: 2168-4936 e-ISSN: 2168-4944
2013; 3(3): 63-80
doi:10.5923/j.ijnc.20130303.01
On the Interactions between Mobility Models and Metrics in Mobile ad hoc Networks
 Abstract
 Reference
 Full-Text PDF
 Full-text HTML
Elmano Ramalho Cavalcanti1, Marco Aurélio Spohn2
1Department of Systems and Computing, Federal University of Campina Grande, Campina Grande, 58.429-140, Brazil
2Federal University of FronteiraSul, Chapecó, 89812-000, Brazil
Correspondence to: Elmano Ramalho Cavalcanti, Department of Systems and Computing, Federal University of Campina Grande, Campina Grande, 58.429-140, Brazil.
| Email: |  |
Copyright © 2012 Scientific & Academic Publishing. All Rights Reserved.
In this paper we investigate several gaps on the study of mobility models in Mobile ad hoc Networks (MANETs). We present a survey of taxonomies for mobility models, and introduce a novel taxonomy for mobility metrics, which is then employed for classifying the surveyed metrics. It is performed a comprehensive experimental study taking into account an heterogeneous set of mobility models and seven representative mobility metrics. As a first result, we show how effective metrics are on distinguishing among models. Additionally, our simulation findings reveal that, independently of the movement pattern of mobile nodes, there are similar relationships among node speed and several mobility metrics. Furthermore, we estimate the impact of each mobility model’ parameter on the evaluated mobility metrics, revealing the variables that most impact the metrics. Lastly, through stepwise multiple linear regression analysis we created accurate models for predicting the value of link duration, node degree and network partitioning metrics from a proposed set of novel predictors. The results presented in this work provide significant insights on the comprehension of mobility models and metrics and the interactions between them in MANETs.
Keywords: Mobility Model, Mobility Metric, Simulation, Regression Analysis, Mobile ad hoc network
Cite this paper: Elmano Ramalho Cavalcanti, Marco Aurélio Spohn, On the Interactions between Mobility Models and Metrics in Mobile ad hoc Networks, International Journal of Networks and Communications, Vol. 3 No. 3, 2013, pp. 63-80. doi: 10.5923/j.ijnc.20130303.01.
Article Outline
1. Introduction
- To support the growth and development of mobile ad hoc networks (MANETs), researchers from industry and academia have designed a variety of protocols, spanning the physical to the application layer. When it comes to evaluating such protocols, analytic modeling and simulation are amongst the most used methods. The former has limitations due to the lack of generalization, and the intrinsic high level of complexity[15]. The latter is by far the most used method for designing and evaluating MANET protocols[37].A mobility model is one of the most important components in the simulation of MANETs. This component describes the movement pattern of mobile nodes (e.g., people, vehicles) and it has many impact factors such as: protocol performance[7, 12, 40, 55]; topology and network connectivity[10, 26, 59]; data replication[31]; and security [18]. Regarding the first factor, Bai et al.[7] demonstrated that the performance of a protocol can vary dramatically depending on the adopted mobility model.A drawback on the current analysis of mobility models is that just a few variables (i.e., input parameters) are covered. Among the analyzed parameters, the majority of studies just assess the impact of maximum speed[3, 7, 24, 31, 32, 39, 57, 63, 67, 77] for mobility and protocol performance metrics. Other studies also evaluate the impact caused by changing the values of radio communication range[24, 57], number of nodes[32, 63, 67], and node pause time[56]. Thus, there is plenty of space for analyzing the impact of other parameters, such as number of city blocks and number of mobile groups (when applicable).After several mobility models had been proposed, there was a need for better analyzing and comparing them. For this reason, mobility metrics were introduced for classifying and measuring, quantitatively and qualitatively, any mobility model. However, there are disagreements over the quality of some mobility metrics. For instance, several authors[30, 52] argue that the number of link changes[30] is a good metric because it is able to differentiate among mobility models, while other authors[7, 64] disagree with that statement.Some mobility metrics are directly related to the performance of routing protocols. Sadagopan et al.[57] demonstrated that there exists a linear relationship between the mobility metrics of link and path duration and the protocol performance in terms of throughput and routing overhead.Considering that mobility models’ input parameters have a direct impact on mobility metrics, it seems suitable to estimate the relationship between metrics and parameters. Understanding relationships among them allow developing accurate metrics’ prediction models, while also guiding on the design of mobility aware protocols. Besides that, other works[35, 47] have shown that mobility metric predictive models may also be used for allowing researchers specifying rigorous MANET simulation scenarios for protocol evaluation.From the points raised so far, we list the following Research Questions (RQ) regarding mobility aspects in mobile networks:RQ1: How effective are the metrics on distinguishing models?RQ2: Can mobility models from different classes exhibit similar behavior for the same metrics?RQ3: Can mobility models belonging to the same class behave differently for the same metrics?RQ4: What are the mobility variables that most impact on the metrics?To investigate the aforementioned questions, we performed a comprehensive experimental study (Section 4) using six mobility models (Section 2) and seven well-known mobility metrics (Section 3). In section 2 we show a survey of taxonomies for mobility models, and in section 3 we introduce a novel taxonomy for mobility metrics, using it to classify the surveyed metrics. Results from related work are compared with ours in Section 5. Finally, the conclusions of this work are pointed out in Section 6.
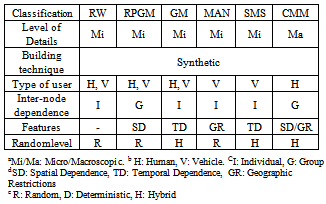
2. Mobility Models
- A mobility model can be defined as a mathematical model that describes the movement pattern of mobile nodes (e.g., people, vehicles). It determines how the movement components (e.g., speed) of nodes change over time, aiming at modeling the real behavior of mobile nodes. Mobility models can be classified in different ways (Figure 1): the level of mobility description[11]; the model building technique[17]; the type of mobility entity (user)[50]; the interdependence of nodes' movement[17]; the model internal characteristics[6]; and the degree of randomness in mobility pattern[79][62]. Some representative mobility models are described below.Mainly due to its simple implementation, Random Waypoint (RW)[16] became the most widely employed model in the evaluation of MANET protocols[36]. The RW algorithm randomly chooses a destination point and a constant speed at which a node moves until it reaches that destination. Then the node may stay still for some time (in case a pause time is defined) before starting a new movement (Figure 2(a)). The RW model has onlythree input parameters: minimum speed, maximum speed, and maximum pause time. Node speed and pause time follows a uniform probability distribution.Although it is one of the simplest mobility models, the RW model has at least two well-known drawbacks. The first is the non-uniform node distribution resulting from the edge effect[11]. The other is the average node speed decay during the simulation[73]. Yoon et al.[73] estimated an approximation equation for the minimum speed in order to work around this problem.
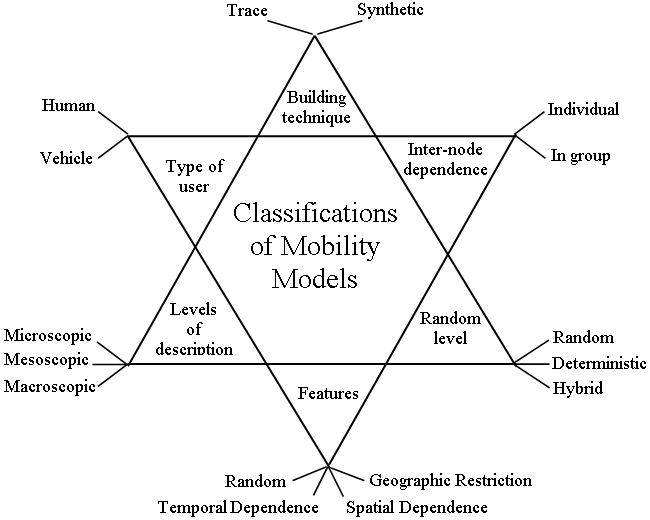 | Figure 1. Classifications of mobility models |
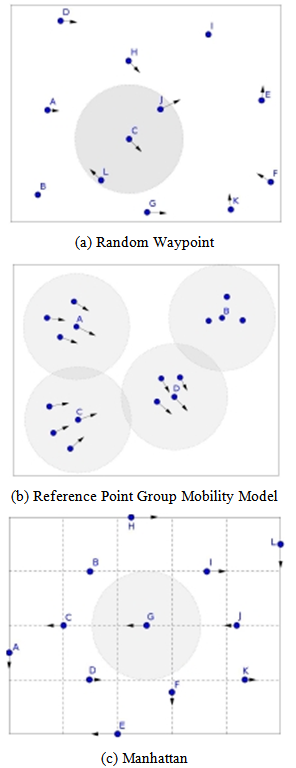 | Figure 2. Visualization of RWP, RPGM and Manhattan mobility models in action |
3. Mobility Metrics
- Each affiliation must include, at the very least, the name of the company and the name of the country where the author is based (e.g. Causal Productions Pty Ltd, Australia).Email address is compulsory for the corresponding author.A mobility model can be seen as a simple input output process (Figure 3). The inputconsistsofthe mobility model’s parameters. The output consists of mobility trace files each containing details about the movements of all nodes during the simulation. From these files one can compute the mobility metrics.
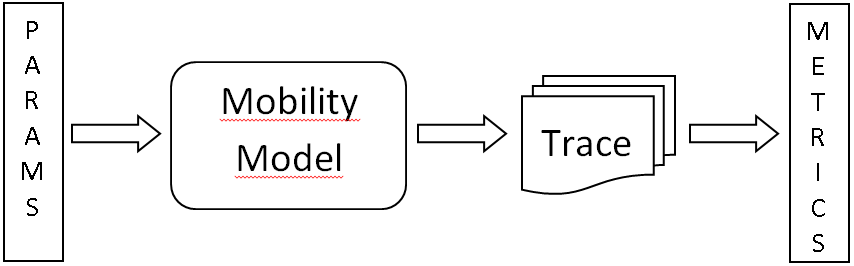 | Figure 3. Mobility model seen as an input output process |
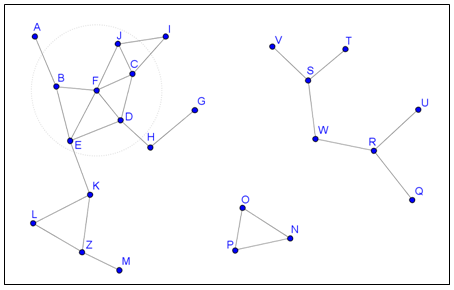 | Figure 4. An illustration of a mobile ad hoc network |
 ). However, RS is computed only for those nodes that are apart from each other at most 2R units. Bai et al.[8] demonstrate the effect of RS on the probability distribution functionofpath duration for RW, RPGM, Manhattan, and Freeway mobility models. This metric has been mainly used for mobility model designing [76], validation[65], and evaluation[44, 68], though there are other applications for this metric like routing protocol designing[74].Since a mobile node may move according to other node's movement, no matter if they are pedestrians or vehicles; it is opportune thinking about mobility metrics that measure this relationship. Related to this statement, Bai et al.[7] proposed the degree of spatial dependence (DSD), which indicates the similarity between the velocities of two nodes that are not too far apart (less than 2R). DSD is high when the velocities (magnitude and direction) of two nodes are similar, what normally occurs when the movement of a node depends on the other’s. Thus, when applied to the whole wireless network, this metric reveals when nodes move in a group manner. Figure 5 (left side) shows an illustration for this spatial metric. DSD is computed based on nodes’ speed and the angle between them. For this example,
  . DSD values range from 1 to 1, where 1 means maximum negative movement correlation (dependence), 0 means absence of spatial dependence, and 1 means maximum dependence (correlation).A negative DSD occurs, for example, when a node is moving to North while other is moving to South. On the other hand, whenever a node is moving at close direction and velocity of another, then a positive DSD occurs.Several works were based on DSD for a wide range of purposes, including geographic routing evaluation[61], mobility model design[44], validation[65] and evaluation [68, 72], performance analysis of routing protocols[7, 43], mobility-aware routing protocol analysis[25], and design of clustering algorithms[75].Bai et al.[7] also proposed another velocity-based mobility metric, called degree of temporal dependence (DTD). It is similar to DSD, but considers the similarity between a node's velocity at time t and the same velocity at time t’ (where
  ). An illustration for DTD is shown in Figure 5 (right side), where three consecutive time steps of the position and velocity vector of a node is shown. The more similar are the vectors the higher is DTD, in the same way as for DSD. By definition, this metric can differentiate temporal models from others, and it has already been used for mobility model design[44] and evaluation[72].
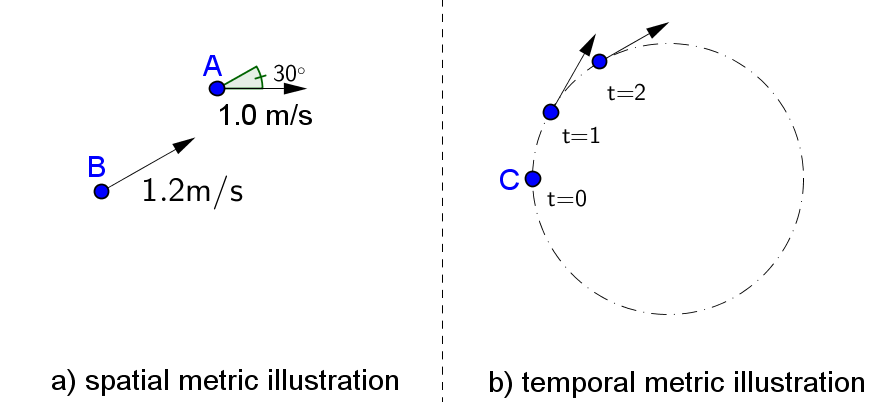 | Figure 5. An illustration of spatial and temporal mobility metrics |
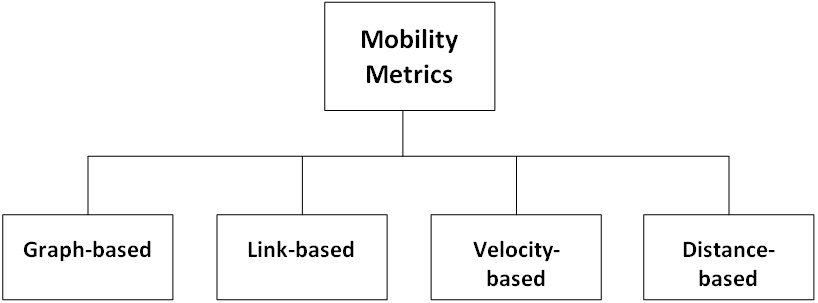 | Figure 6. Classification of mobility metrics |
4. Experimental Study
- After introducing examples and taxonomies for mobility models and metrics, we focus on answering the four research questions introduced in Section 1.
|
4.1. Configuration
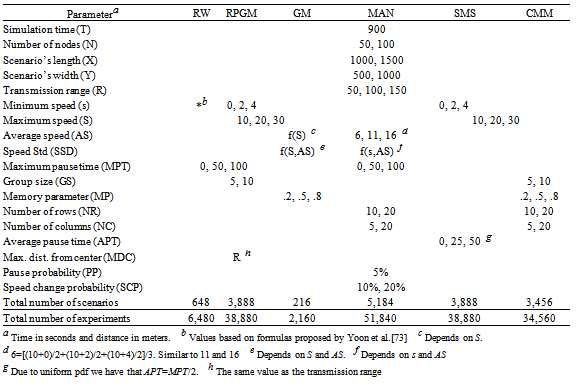
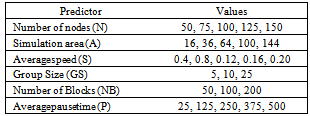
- When comparing models that belong to a same class, it is paramount to ensure a fair scenario configuration. A special case for reaching this requirement is setting a correct speed configuration, since there are four parameters related to velocity: minimum speed (s), average speed (AS), maximum speed (S), and the speed standard deviation (SSD). Usually the speed probability distribution function (pdf) of any mobility model is uniform (i.e., X∼U(s,S)) or normal (i.e., X∼N(AS,SSD)). Thus, we ensured an equivalence of speed when using mobility models that have different speed pdfs.Table 2 presents the configuration for all mobility models' input parameters considered in this work. The simulation time was set to 900 s, after disregarding the first 3600 s to avoid the statistics variations due to the simulation transient phase[51]. A total of 172.800 experiments were created, and each of them was repeated 10 times, changing the pseudo-random number generator (PRNG) seed.
|
4.2. Analysis
- For a better presentation, we divided this Section accordingto the four research questions pointed out in the Introduction.
4.2.1. First Research Question
- In order to answer the first research question - How e effective are the metrics on distinguishing mobility models? - we randomly1 selected a sample of thirty mobility simulation scenarios from a universe composed by all the combinations of the following parameters’ values: number of nodes (2), simulation area (4), transmission range (3), minimum speed (3), maximum speed (3), and maximum pause time (3), which results in a total of 2x4x3x3x3x3 648 scenarios (see Table 2). The chosen scenarios are described in Table 3. Following the guidelines described by Kurkowski[36] on specifying rigorous scenarios for simulation of MANETs, node speed is expressed in terms of transmission range per second (R/s) whereas the simulation area in R2 units.The effectiveness of how the graph-based mobility metrics are on distinguishing among mobility models is shown in Figure 7(a). The node degree was able to clearly distinguish group-based models (i.e., RPGM and CMM) from others. However, in most scenarios this metric could not differentiate random from temporal and grid-based models. RW presented slightly higher values than GM, Manhattan, and SMS models for scenarios 14 to 23, corresponding to scenarios with higher node density (see Table 3). A somewhat similar result occurred for the other graph-based metric, network partitioning (Figure 7(b)). Group-based models presented the lowest values, while random, temporal, and grid models presented the highest scores. Again, the difference among the models is not perceptible in higher node density scenarios (i.e.,
 Table 3).The effectiveness that link-based mobility metrics have on distinguishing mobility models is illustrated in Figure 8. Except for the CMM model, there is a negligible difference on the number of link changes (LC) values in all scenarios with 50 nodes (1 to 13, Table 3), Figure 8(a). On the other hand, an opposite behavior is shown for the 100-nodes scenarios, where the results show a higher performance divergence between the models In general, group-based models had higher number of link changes whereas random models the lowest. These results corroborate LC low ability on differentiating among mobility models[7, 30, 52, 64]. Differently from LC, the average link duration showed to be a better metric for distinguishing models (see Figure 8(b)). In 87% (26 out of 30) of the scenarios,the group-based model was set apart from the others with the highest LD value. Besides that, Manhattan and RW presented higher values than temporal models (SMS and Gauss-Markov), the ones with the lowest LD scores.
|

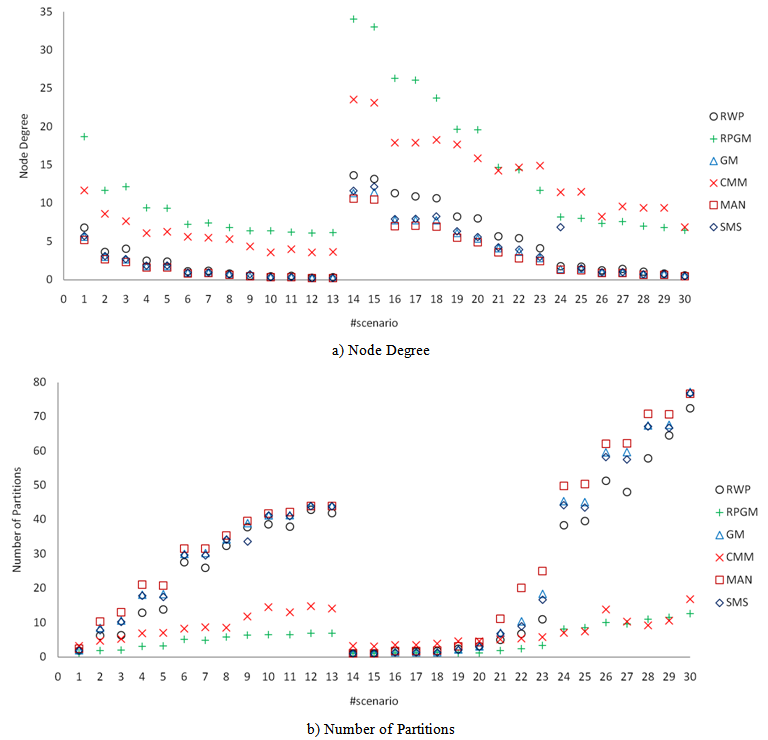 | Figure 7. Effectiveness of graph-based metrics for distinguishing mobility models |
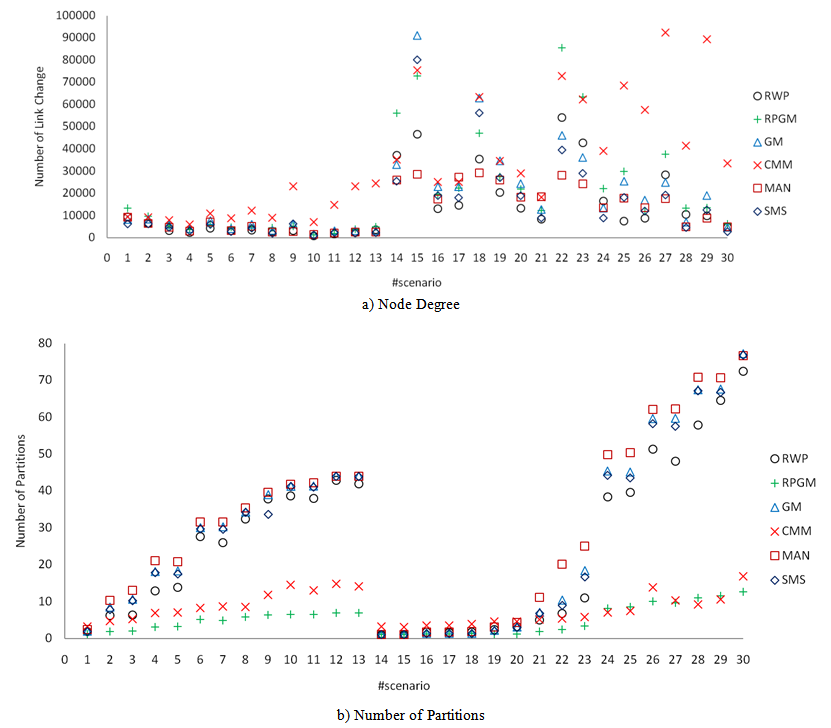 | Figure 8. Effectiveness of link-based metrics for distinguishing mobility models |
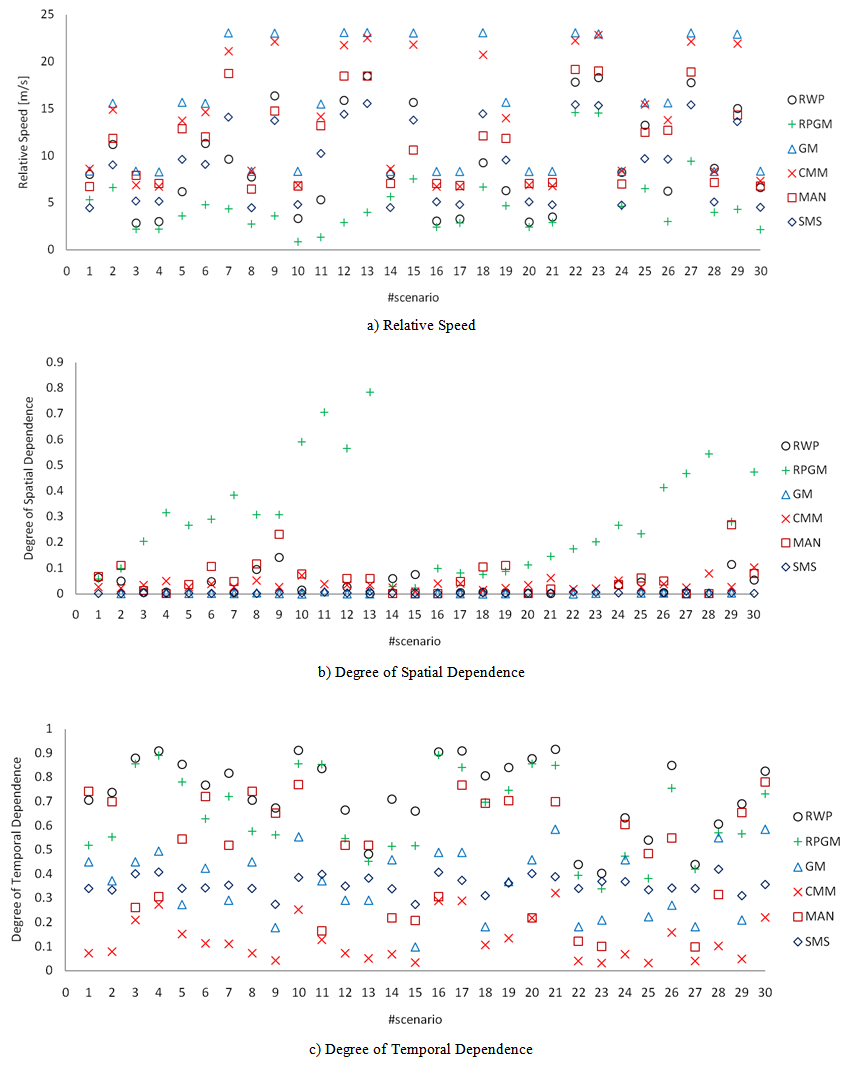 | Figure 9. Effectiveness of velocity-based metrics for distinguishing mobility models |
4.2.2. Second and Third Research Questions
- To answer the second research question we searched for similarities in the performance of mobility metrics for all mobility models under consideration. From now on, all graphs present results with a confidence level of 99%. In many situations, the interval length is smaller than the symbol used in the legend, making it barely visible.
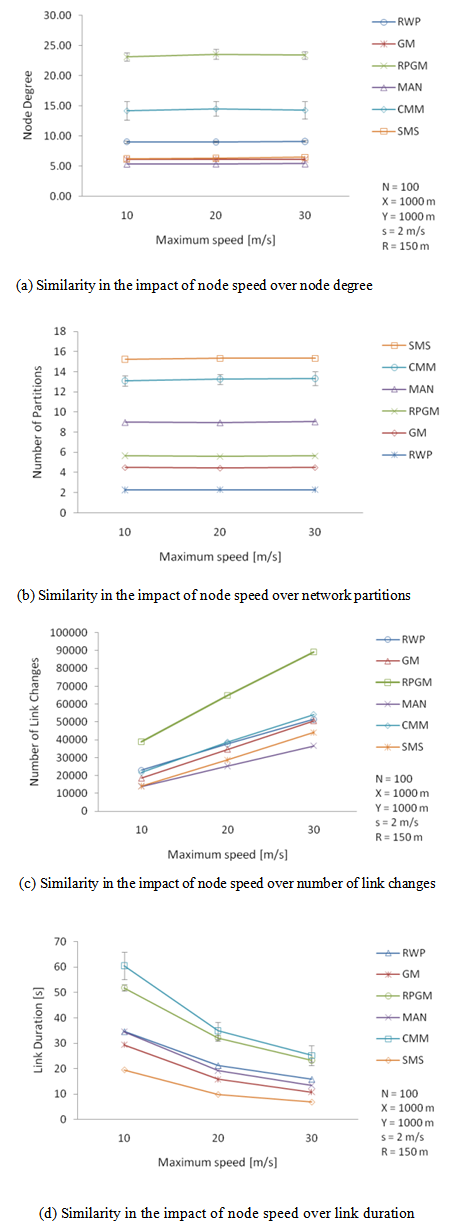 | Figure 10. Similarities in the performance of link-based and graph-based mobility metrics for different mobility models |
 and
and  , were close to zero for all mobility models (Table 5).Regarding the link-based metrics, link duration and number of link changes, there are also similar behaviors for the models. First, a linear positive relationship exists between node speed and link changes (Figure 10(c)), and an exponential-like decreasing pattern between node speed and link duration.We also look for differences in the performance of mobility metrics for random, group, and grid-based mobility models, in order to answer RQ3. The RW and SMS models were selected for the comparison of random models2. We observed that increasing node pause time rather affected the number of link changes in the SMS model, but it provoked a significant reduction on this metric in the RW model (Figure 11(a)). This result is corroborated by the correlation level between pause time and number of link changes for RWP and SMS, respectively 0.263 and 0.043.The temporal models, GM and SMS, were compared concerning the effect that memory parameter causes on the degree of temporal dependence (DTD). GM showed a positive linear relation between these variables, differently from SMS performance (Figure 11(b)).We also compared the joint impact that the number of groups (NG) and the group size (GS) caused on link duration (LD) and node degree (ND) for the RPGM and CMM group-based models3. Considering LD as the performance criteria, Figure 11(c) shows that RPGM presented better performance when you have few large groups, while CMM surpasses when there are many small groups. Furthermore, we also observed a divergence regarding these parameters and node degree (Figure 12(a)). This result may be related to the fact that CMM poses geographical restrictions to node movement.The last comparison was for the grid-based models (i.e., Manhattan and CMM). It was observed an opposite behavior concerning the degree of spatial dependence variation due toincreasing node speed. When node speed is increased from 10 m/s to 30 m/s DSD increased linearly from 0.04 to 0.14 for Manhattan, and it dropped from 0.06 to 0.02 in the CMM model (Figure 12(b)). This result is also corroborated by the correlation level between node speed and DSD for these models,
 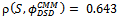 and
and 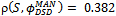 .Additionally, we also noticed a different performance when varying the number of rows (NR) and columns (NC) (which may represent streets in a city) over link duration (Figure 12(c)). Clearly, for higher NC and NR values, lower is the size of each city block, and hence higher is the amount of blocks within the communication range (R) of nodes4. As there are fewer rows and columns in the scenario, there are fewer larger blocks. In this situation, the link duration decreases in CMM, while increasing in Manhattan.
 | Figure 11. Differences in the performance of mobility metrics for random, group, and grid-based mobility models (1/2) |
 | Figure 12. Differences in the performance of mobility metrics for random, group, and grid-based mobility models (2/2) |
4.2.3. Fourth Research Question
- As already used before, let
 indicates the correlation between the p-th parameter of mobility model
  and metric
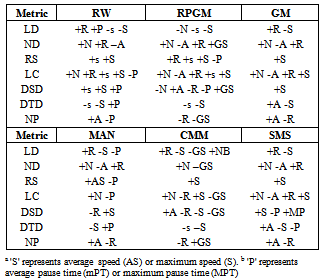
  . To discover which mobility parameters most impact the mobility metrics we measured the correlation level between each mobility model’s input parameter and every mobility metric under consideration, what is called correlation matrix. This information is shown in Table 5.From the correlation matrix we highlighted the most impacting parameters of each mobility model, summarizing them at Table 4, by including only variables that showed reasonable correlation
 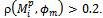 The ‘+’ and ‘-’ signals means the correlation is either positive or negative.Since the variables that have a direct effect on mobility metrics are the mobility models’ parameters, it seems opportune thinking on the development of models for predicting the metrics from the parameters. For this reason, as an addition to the last research question, in the next section we provide models for predicting some mobility metrics from the aforementioned list of variables that most impact the metrics.
|
|
4.3. Analysis
- According to Montgomery and Runger[46], multiple linear regression is one of the most used techniques to predict the value of one dependent variable (i.e., response variable) from a set of independent variables (i.e., predictors). This technique has already been used for predicting mobility metrics from mobility model’s input parameters[20, 35, 47]. There are at least two main purposes for this approach. First, for allowing researchers specifying rigorous and standard MANET simulation scenarios for protocol evaluation[35, 47].Second, for supporting designing mobility-adaptive protocols[20].Let
 represent theestimated value (by multiple regression) of mobility metric
  for the mobility model
  . Parameters
  should be mutually independent.We applied stepwise regression, for which the first step is to choose the predictor that produces the best-fitting linear regression model with the response variable. In each succeeding step, the predictor that most improves the fit of the linear model is added to the model, in case the improvement exceeds a predetermined threshold. Then, any predictor in the model that can be dropped without reducing the fit by more than a predetermined amount is removed. This process is iterated until no variable that is not in the model may improve the fit by an amount exceeding the threshold, and no predictor that is in the model can be removed without reducing the fit by more than the predetermined threshold.
4.3.1. Response and Predictor Variables
- We selected three mobility metrics as response variables for the regression analysis: average link duration, average node degree, and average network partitioning. Boleng et al.[12] demonstrate that link duration is an indicator of protocol performance and effectively enables adaptive MANET protocols. Node degree is a quantity of interest due to its implication on the success rate of various tasks in mobile ad hoc networks[34]. Lastly, Kurkowski et al.[35] argue that network partitioning is an essential metric for designing MANET standard simulation scenarios.We considered two possible sets of predictor variables: input and derived parameters. The first contains the mobility models' input parameters (the same as factors), as detailed in Table 2. A derived parameter is a combination of two or more input parameters. We tried various possible subsets of the predictor variables to find a subset that gives significant parameters and explains a high percentage of the observed metric value variation.The following derived parameters are proposed as candidates for predictor variables. Each one of them was applied in an attempt to achieve a better prediction model.i. Speed(S): for mobility models that have uniform speed probability distribution function (i.e., X∼U(s,S)), where X is the speed random variable, then we call speed as the derived parameter which value is the arithmetic mean between the minimum (s) and maximum speed (S). Logically, both speed and the input parameter AS means the average node speed. S is expressed in units of transmission range by seconds, R/s.ii. Area (A): is the simulation area, given by the product of width (X) and length (Y) of the scenario, and expressed in terms of the square of transmission range, R2.iii. Density (D): is the average amount of nodes per area unit (i.e., nodes R2).iv. Node coverage (NC): is the area covered by a node's transmission range. NC of node P is
 (see Figure 13).v. Pause (P): for mobility models that have uniform node pause time probability distribution function (i.e., X∼U(mPT, MPT)), where X is the pause random variable, then we call pause as the derived parameter which value is the arithmetic mean between the minimum (mPT) and maximum node pause time (MPT). Logically, both pause and the input parameter APT means the average node speed.vi. Number of Groups (NG): is defined as the ratio between the number of nodes (N) and the group size (GS) (i.e., NG=N/GS). It is applicable for group-based mobility models.vii. Number of Blocks (NB): is the product of the number of rows minus one and the number of columns minus one
  This derived parameter is suitable for grid-based models (e.g., Manhattan). For instance, Figure 13 shows a grid-based simulation scenario with three horizontal streets and four vertical streets (i.e., NR=5, NC=6). In this example we have that NB= (5-1) x (6-1)=20.viii. Percentage Block Area (PBA): is the percentage of the simulation area covered by a block. In Figure 13, the area of the block B (BA) is R2, where R is the radio transmission range of node P. Thus, the percentage block area is given by PBA = BA/area = R2/ 20R2= 5 %. It is also true that PBA = 1/NB.ix.
  : for group-base mobility models we have found that the logarithm of N to the base GS may be satisfactorily used for predicting some mobility metrics.Values for the predictor variables used in the regression analysis are shown in Table 5. Simulation time was set to 1000 seconds and the node’s radio transmission range to 250 meters. A wide range of values for the proposed predictors are used in order to accurately detect their relationship (e.g., logarithmic, quadratic) to the response variables through scatter plots analysis.
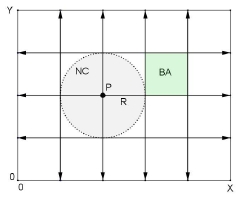 | Figure 13. Node coverage and percentage block area derived parameters in a grid-based mobility scenario |
4.3.2. Assumptions
- A predictive model obtained by multiple linear regression is valid only if the following assumptions are met[33, 46]:i. Linearity between predictors and response variables. To ensure this assumption we made nonlinear transformations in several predictor variables. ii. Normality of residuals (i.e., the residuals are normally distributed). Residual is calculated as the difference between the observed value of the variable and the value suggested by the regression model. The normality of residuals assumption is checked through the Normal Q-Q plot, and the measures of skewness and kurtosis of the residual distributioniii. Absence of multicollinearity5 between selected predictor variables. We set the variance inflation factor (VIF=5) as the threshold for disregarding a predictor from the regression model.iv. Homoscedasticity (i.e., the variance of the residuals is homogeneous). We ensure this property through visual check of the residual plots.v. Treatment of outliers. We use Mahalanobis and Cook's distance for detecting outliers[13].We have also applied BoxCox transformation (i.e., power transformation) on the majority of dependent variables in order to make them more Normal distribution-like[58]. Though it is not an assumption for regression validation, in some cases it helped us achieving normality of residuals. The formula applied for transformation was

 , where Y is the dependent variable (i.e., the mobility metric). The values used for the parameter
  are detailed in Table 6.
|
4.3.3. Metric Prediction
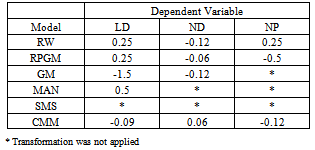
- Recalling that
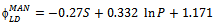
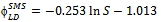
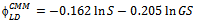
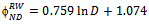
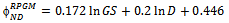
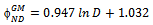
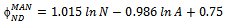
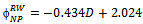
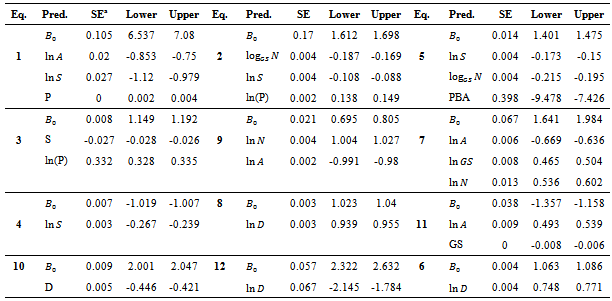
 represents the estimated link duration for the Random Waypoint model, we can predict it from the following parameters: area, speed and pause time (Eq. 1). However, for better predicting this metric for RPGM (Equation 2, it is also necessary to know some group information (i.e., GS). The link duration prediction formulas for the other mobility models are show in Equations 3 to 5. The proposed derived parameters, percentage block area (PBA), is useful for predicting LD for CMM. For all models, the speed predictor contributes negatively on the metric value, which is in accordance to previous analysis (Figure 10(d)).The node density (D) is the only predictor necessary to estimate the average node degree (ND) in the model RWP and GM, as stated in Equations 6 and 8. Besides node density, the group size information is again crucial for accurately predicting node degree for RPGM model 7.Node density and group size are also the derived parameters approved for predicting network partitioning (NP) for RW, GM and RPGM models. Unfortunately, we could not obtain validated regression models for predicting ND and NP for SMS and CMM since they failed in one or more assumptions.
 | (1) |
 | (2) |
 | (3) |
 | (4) |
 | (5) |
 | (6) |
 | (7) |
 | (8) |
 | (9) |
 | (10) |
 | (11) |
 | (12) |
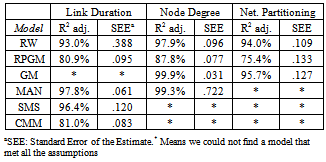
 and the standard error of the estimate for all the predictive models are shown in Table 9. R2
  states the amount of variability in the data explained or accounted for by the regression model.These results show that, as it could be expected, it is easier to build predictive models for simpler mobility models (e.g., Random Waypoint or Manhattan) than for more complex synthetic models like SMS and CMM. Additionally, according to R2 statistical measure (goodness of fit), the accuracy for predicting mobility metrics for random and temporal models is higher than for group-based models, even when specific predictors are taken into account (e.g., group size).Information about the standard errors and confidence interval for the predictor's coefficients are detailed in Table 8.
5. Related Works
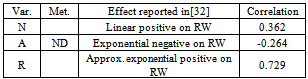
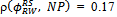
- Bai et al.[7] reported results showing the effects that maximum speed causes on metrics relative speed, degree of spatial dependence, and degree of temporal dependence for the models RW, RPGM, and Manhattan. Table 10 shows a comparison between theirs and ours results. The values found in the matrix correlation (Table 7) are in consonance with the results presented by Bai et al.Ishibashi and Boutaba[32] show the effects that number of nodes, the length and width of the simulation area, and transmission range cause on node degree. They considered only scenarios with square geometry (i.e., X=Y), and used only the Random Waypoint model. Table 11 presents a comparative of the authors’ results against ours. They found that an increase in the number of nodes causes a linear increase in node degree. This result is consistent with ours as the value of the correlation between N and ND is moderate,
 (Table 5).
|
|
|
|
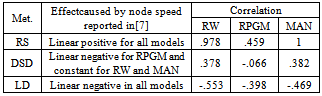
 is negative. Finally, the authors found that transmission range caused an almost exponential growth in ND. This growth is justified due to the high correlation value between the input parameter R and the metric ND for the RW model, which is
 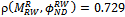 .The effect that the number of nodes causes on link duration in several mobility models is presented by Theoleyre et al.[63]. In almost all models, N does not affect LD. The only exception occurred in the group-based model Nomadic Community (similar to RPGM), where LD decays with the increase of N. These results are also consistent with the correlations presented in Table 7: in RW and Gauss-Markov the correlation is practically zero, while it is
  for RPGM.
|
 and
and 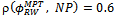 (Table 7). However, one limitation of their work is that only two metrics were considered, and only for the Random Waypoint model.
6. Conclusions
- In this paper we investigated several gaps on the study of mobility in MANETs, by taking into account six representative mobility models (random, temporal, grid-based and group-based) and seven mobility metrics (link-based, graph-based, and velocity-based).First of all, we showed that the ability of metrics on distinguishing different mobility models is variable, which depends on the mobility scenario configuration, such as the node density. This finding may explain, for example, the divergences found in the literature over the effectiveness that the metric number of link changes has on distinguishing mobility models[9, 30, 52, 64]. As described in the experimental study (Section 4.2.1), depending on the node density this metric may or not be able to distinguish models.Secondly, we show that, independently of the mobility model, node speed cause no impact on average node degree neither on the number of network partitions. Besides that, for all mobility scenarios evaluated our simulation results point out the existence of a linear positive relation between node speed and number of link changes between nodes in a MANET. On the other hand, only negative correlations were found between node speed and link lifetime (duration). The results presented in this paper also show differences in the performance of metrics for mobility models belonging to the same class (e.g., group-based).Through correlation analysis we estimate the mobility variables that most impact the mobility metrics for each class of mobility model. Lastly, we proposed and used several derived parameters as potential predictors in several stepwise multiple linear regressions to obtain predictive models for link duration, node degree, and network partitioning metrics. As future work, we intend to investigate how to design mobility aware protocols with the findings reported in this paper, with special attention to the mobility metrics’ predictive models.
Notes
- 1. We use the true random number generator service provided by Haahr [27], which is based on atmospheric noise level for getting the random numbers.2. Even though SMS is a temporal model by default, when its memory parameter α is properly set, the model behaves like a random model [76].3. To get the number of groups (NG), we simply divide the number of nodes (N) by the group size (GS).4. For instance, if the scenario is a square of 1000 m and NR=NC=11, then there will be 100 square blocks of 100 m. On the other hand, if NR=6 and NC=5, there will be 20 rectangular blocks of 200 m x 250 m. An example is depicted in Figure 13.5. Multicollinearity exists when two or more predictor variables in a multipleregression model are highly correlated