Yves Josse , Frédéric Lucarz , Bruno Fracasso
Optics department Telecom Bretagne, Institut Mines-Telecom, Brest, CS83818 29238, France
Correspondence to: Yves Josse , Optics department Telecom Bretagne, Institut Mines-Telecom, Brest, CS83818 29238, France.
| Email: |  |
Copyright © 2012 Scientific & Academic Publishing. All Rights Reserved.
Abstract
Distributed antenna systems (DAS) are known to improve coverage and performance of wireless communications in indoor environments. In the present paper, we propose a method to determine the position of distributed antennas that optimizes the network capacity for a given deployment scenario. We also consider power consumption measurements of commercially-available Wi-Fi access points and dongles, in order to quantify the energy efficiency of a DAS using Radio-over-Fiber (RoF) technologies. Our results show that there exists an optimal number of distributed antennas for a given topology of the indoor environment.
Keywords:
Green Wireless, Radio-Over-Fiber, Energy Efficiency
Cite this paper:
Yves Josse , Frédéric Lucarz , Bruno Fracasso , "Green Wireless Network Deployments in Indoor Environments Using Radio-over-Fiber Distributed Antenna Systems", International Journal of Networks and Communications, Vol. 2 No. 6, 2012, pp. 142-147. doi: 10.5923/j.ijnc.20120206.02.
1. Introduction
Capping the power consumption of mobile and wireless networks, whilst accommodating growth in the number of subscribers, has become a crucial issue in view of the growing need for un-tethered and ubiquitous connectivity. Within that context, new strategies for greener telecoms are being extensively researched to reach higher energy efficiency and greater power saving, not only for terminals to increase their battery life, but also for access points to reduce their carbon footprint. Furthermore, demands on throughput and performance keep on increasing, with extended coverage especially in indoor environments, such as homes and public places (stadiums, commercial centres, transport hubs) where users are densely located. Distributed Antenna Systems (DAS) are known toimpro-ve coverage[1] and performance of wirelesscommunica- tions in indoor environments. One approach for reaching higher energy efficiency consists in forming smaller coverage cells by reducing the transmit power at each antenna site[2]. A future-proof and high-capacity optical communication network can be advantageously provided to interconnect all antenna sites. In that case, radio-over-fibre (RoF) transmission techniques are used to transport optically high bit-rate radiofrequency (RF) signals. The main advantages of RoF distributed antenna systems include very low fibre transmission loss, large bandwidth, and low transmit RF power levels, which enable us to improve the coverage of in-building wireless services[3]. In this paper, our aim is to give some rules to design an energy-efficient RoF DAS network. In a given configuration, the number and position of distributed antenna is determined to optimize overall energy efficiency.
2. Related work
In order to achieve energy efficiency in wireless networks, a possible approach is to reduce the power consumption of the devices (both access points and terminals) or to optimize the communication protocols to efficiently use wireless interfaces. Many investigations on the electrical power consumption of physical devices and interfaces have been performed in the past[4], mainly focusing on reducing power consumption of devices and thus increasing the battery life. However, reducing the power consumed by the terminal has a relative little impact on the overall energy efficiency of the system since this power is usually low (a few mW).An alternative approach consists in modifying the network architecture. For instance, DAS are known to improve coverage and performance of wireless communications while reducing the total radiated power level[5]. Some works, like Zhang et al.[6], focus on the deployment of an energy efficient DAS and propose an algorithm for the position of the antennas. By minimizing the average distance between users and distributed antennas, the optimal position of antennas is given in a circular environment. Then considering a constant circuit power and the transmission power for each antenna, the optimal number of antennas is obtained. However, a circuit power independent of the transmission data rate is considered without taking into account the link between the access point and the remote antennas. Crisp et al.[7], model the overall power consumption in a RoF DAS and optimize the output power at each remote antenna to provide a given wireless coverage area. However, the metric used (power per area unit) does not take performance (e.g., wireless link data-rate) into account, while we consider that the throughput has to be included in the energy efficiency metric in indoor environment.
3. Rof DAS Architecture Design
3.1. Rof DAS Architecture Design
Figure 1 illustrates the architecture of the RoF DAS network considered in this paper. On the system downlink, RF signals from the access point are split electrically by a splitter and adapted by a laser drive amplifier (ATTN) to a suitable power level to directly modulate a laser diode. The resulting intensity-modulated optical carrier is transported over an optical fiber to a photodiode and transimpedance amplifier (TIA) to perform opto-electrical conversion. The RF signals obtained are simultaneously transmitted wirelessly from all distributed antennas (simulcast transmission) to the terminal after being amplified by a power amplifier (PA). For uplink communications, the same components are used in a symmetrical manner. We are interested in determining the optimized number of antennas and their location to offer the best possible coverage with the highest possible performance.
3.2. Design Methodology
The method proposed to design an energy efficient network comprises the three following steps:• Measuring RF signal attenuations to estimate the average power decay index n that characterizes the indoor environment.• Calculating the position of distributed antennas by maximizing the overall network performance using a defined scenario.• Determining the total radiated power and the number of distributed antennas to maximize energy efficiency for a given coverage.
4. Received Power Estimation
The user received power is modelled by considering only the link between the distributed antenna and the terminal. Although indoor (RF) propagation has been extensively studied, the received RF power cannot be accurately predicted. Multiple scattering and reflections from walls and obstacles, as well as shadowing effects cause strong time and space variations in the received power. This is the reason why a statistical RF propagation model is used, which does not require any topographic database.In a DAS with N antennas, the average power received by the terminal from the ith antenna can be expressed (in dBm) as :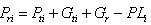 | (1) |
where Pti is the power transmitted by the ith antenna in dBm, Gti and Gr are the transmitter and receiver antenna gains, respectively, and PLi is the path loss in dB between the user terminal and the ith antenna. Considering isotropic antennas, Gti=Gr=0 dBi, the path loss is modeled as follows : 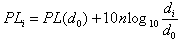 | (2) |
where PL(d0) is the path loss at d0=1m, PL(d0)=40.2dB at 2.4GHz, di is the distance between the ith antenna and the terminal and n is the power decay index that depends on the wireless environment. The previous median path loss formula was obtained from a linear regression of the measured mean signal levels at various locations. | Figure 1. Example of distributed antenna wireless network using radio-over-fiber technology |
The total power received by the terminal Pr is the sum of the power received from the N antennas. Then, Pr can be used to estimate the capacity of the network and to determine an optimal criterion to place the distributed antennas.
5. Position of the Distributed Antennas
5.1. Positioning Criterion
One of the criteria to determine the position of the distributed antennas is to maximize the capacity of the network[8]. This criterion provides an upper limit of the system capacity and enables better performance for multi-user cases[9]. The average capacity in bit/s/Hz can be formulated as : 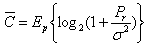 | (3) |
where Pr is the power received by the terminal, σ2 is the average power (variance) of the additive white Gaussian noise and Ep{} denotes the expectation with respect to the location of the terminal.
5.2. Application to a Rectangular Shaped Space
A rectangular space with dimension 40m × 80m is considered: for instance, the floor of a building containing multiple offices. Using the criterion presented in the previous section (4.a.), the positions of distributed antennas were determined for 1th antenna can be written as in dBm :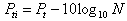 | (4) |
where Pt is the total radiated power in dBm. The simulation was performed with the optimization toolbox from Matlab software using a Quasi-Newton algorithm. The users presence probability is considered as uniform over the space considered. The benefit of this approach is that the location of the distributed antennas can be computed regardless of the room dimensions with a non-uniform probability of presence that can be easily adapted, for instance near a desk. Based on the antenna positions, we shall study in the next section the energy efficiency of RoF DAS using Wi-Fi transmission links.
6. Energy Efficiency in 802.11 RoF DAS
6.1. Application to a Rectangular Shaped Space
In order to estimate the benefits of DAS, an appropriate energy efficiency metric should be defined[10]. To take into account both power consumption and performance, the energy-per-bit metric is used. This metric indicates how much energy the system has to spend to transmit one bit of payload data. The energy-per-bit is defined as  | (5) |
where Ptot is the total electrical power consumed during a transmission in watt and D is the effective throughput in Mbps. Considering a RoF DAS architecture, Eb, measured in J/Mbit, can be expressed as stated in Eq. 6, where PAP and Pterminal are the electrical power consumed during a transmission by the access point and the terminal. PRoF is the overall electrical power consumed by the RoF components for N identical links.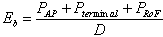 | (6) |
6.2. Power Consumed by RoF Components
The laser drive amplifier, laser diode, photodiode and transimpedance amplifier (Figure 1) are assumed to have fixed power consumptions, regardless of the power radiated by the distributed antenna. However, the power consumed by the power amplifier (PA) dpends on the radiated power. In order to evaluate the power consumed by the PA, we refer to the power amplifier efficiency μPA, defined as the ratio between the transmitted power and the electrical power consumed.Considering Figure 1, the overall electrical power consumed by the RoF components for N identical distributed links can be written as stated in Eq. 7, where PATTN, PLD, PPD, PTIA are the electrical power consumed by the laser drive amplifier, laser diode, photodiode and transimpedance amplifier respectively and Pti is the power radiated by one antenna.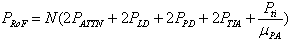 | (7) |
The RoF link leads to higher intrinsic power consumption, as a result of the powering/bias needed for optoelectronic components such as the laser emitter and the photodiode.
6.3. Power Measurement in Access Points and Terminal
In the literature, there are few measurement reports dealing with the energy consumption of access points and terminals during a transmission when the modulation type changes. In general, device specifications showing drive current curves while transmitting and receiving are not sufficient to calculate energy consumption accurately.We have performed power measurements on a Netgear WG 602 Access point in the infrastructure mode with no encryption and on a Wi-Fi USB dongle TL-WN422g from TP-Link. Other types of access points or USB dongles have been used with similar results.The configuration of the access point enables us to choose the standard (802.11b/g) and the modulation scheme associated with the highest reachable datarate presented in the previous section. Other parameters can be freely chosen, such as the fragmentation length (2346 Bytes) or the RTS Threshold (2347~Bytes).A TCP connection between an access point and a USB dongle was performed using the Iperf software, as shown in Figure 2. This software enables us to record the effective throughput. Laptop computers were used and configured to maximize the resources allocated to the present task. | Figure 2. Measurement setup to record instantaneous power consumption from the access point and the dongle |
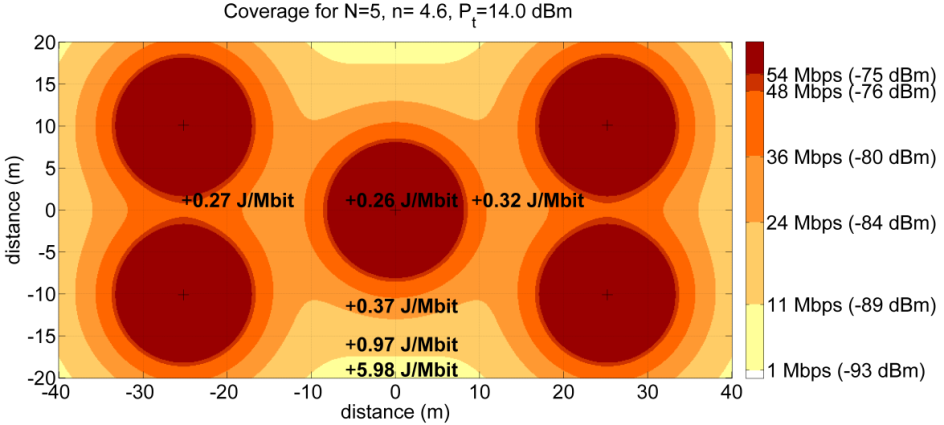 | Figure 3. Map of the highest reachable datarate with five distributed antennas delivering a total power radiation of 14~dBm (7~dBm per distributed antennas) |
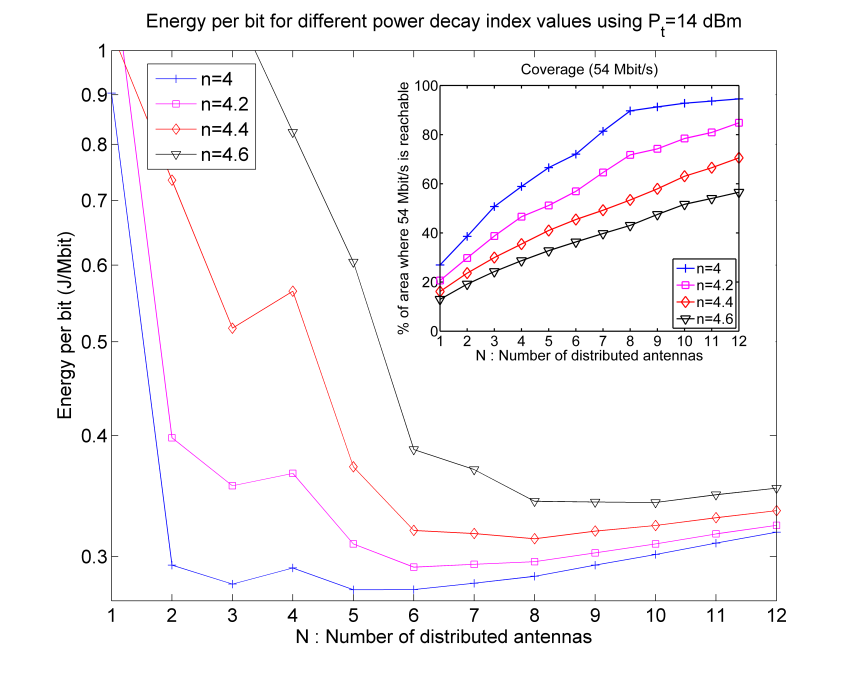 | Figure 4. Evolution of the energy per bit for different power decay index values with a total radiated power equal to 14 dBm. Inset: Evolution of the percentage of the total area where the maximum datarate is reachable for different power decay index values with a total radiated power equal to 14 dBm |
The power measurement setup is depicted in Figure 2. It is designed to measure and record the instantaneous and average power consumptions of the access point and the USB Wi-Fi dongle during the transmission stage. In order to measure the instantaneous power, we monitored the supply current of the access point and the dongle.The power required by the access point/dongle is the product of the voltage drop and the current across the access point/dongle. The current was measured by placing a calibrated resistor in line with the power cord. The voltage drop across accurate resistors (R1=0.102Ω and R2=0.097 Ω) was then observed and captured using a digitizing oscilloscope (Picoscope 2205 from Pico Technology).To ensure an operating voltage of 9V for the Netgear WG 602 access point, the power cord was connected to a regulated power supply. The operating voltage of the USB dongle (5V) was provided by the laptop computer and controlled during the transmission with the Picoscope device. To avoid inherent ground problems, the two laptop computers were operated in battery mode.Table 1 presents the average power consumption during a transmission between the access point and the dongle when the modulation changes, for a fragmentation length of 2346Bytes and an RTS Threshold of 2347Bytes. The distance between the dongle and the access point was d = 1.5m. The effective throughput is measured using Iperf software.| Table 1. Mean power consumption (PAP, Pterminal) and effective throughput (D) for different 802.11 standards during a transmission between the access point (AP) and the terminal |
| | Standard IEEE802.11 | D (Mbit/s) | PAP (W) | Pterminal (W) | | b 1Mbps | 0.8 | 2.71 | 1.06 | | b 11Mbps | 4.8 | 2.47 | 1.18 | | g 24Mbps | 12.7 | 2.48 | 1.24 | | g 36Mbps | 14.8 | 2.42 | 1.24 | | g 48Mbps | 17.5 | 2.38 | 1.25 | | g 54Mbps | 18 | 2.36 | 1.25 |
|
|
Different behaviours can be distinguished, depending on the modulation scheme. For the 802.11b modulation, the mean power consumed by the access point is higher than for the best modulations owing to the reduction in packet transmission time. For the same reason the power consumed by the dongle increases with an increasing data rate. Indeed, the dongle sends acknowledgments signals more frequently. Moreover, the effective throughput measured by Iperf is lower than the maximum data rate given by the 802.11 standard.
6.4. Overall Energy Efficiency
The modulation scheme is adapted according to the received power level and the maximum reachable data-rate for a particular modulation scheme is set according to the IEEE 802.11 standard. Data-sheets of Wi-Fi access points and Wi-Fi dongles provide the relationship between the modulation scheme and the receiver sensitivity, with the corresponding data-rate. We have all the information necessary to compute energy efficiency.
7. Simulation Results
7.1. Map of Highest Reachable Datarate
By combining the receiver sensitivity from data-sheets and the indoor propagation model for our deployment scenario, we obtain a map of the highest reachable data-rate. For instance, Figure 3 presents the configuration with five distributed antennas and an overall radiated power of 14 dBm (i.e. each distributed antenna emits -7 dBm of power).The energy per bit for different modulation schemes are reported in Figure 3. The energy per bit value is 23 times higher for 802.11b (1Mbps) than for 802.11g (54Mbps), due to both the reduction in the overall power consumed by the access point and dongle and the increase in effective throughput[11]. With the energy per bit map, the spatial average energy per bit can be computed and is equal to 0.60~J/Mbit in the configuration of Figure 3.
7.2. Analysis of the optimal number of antennas
In order to find the optimal number of distributed antennas, the evolution of energy per bit and performance with the number of distributed antennas are studied considering that the total radiated power remains constant and equal to 14 dBm. The inset of Figure 4 presents the evolution of the percentage of the total area where the maximum datarate (54Mbps) is reachable with the number of distributed antennas for different power decay index values (n parameter in Eq. 2). A change in power decay index means a modification of the topology of the space considered. This inset shows the interest of distributed antennas in terms of coverage. The higher the number of distributed antennas, the better in terms of datarate is the connection between the terminal and the access point.Figure 4 presents the evolution of the spatial average energy per bit with the number of distributed antennas. The energy per bit for a small number of distributed antennas is not represented because the total radiated power does not enable us to cover the whole area for n=4.6. This figure shows the advantage of DAS in terms of energy efficiency as the energy per bit is maximal for N=1. Furthermore, there exists an optimal number of distributed antennas which minimizes the spatial average energy per bit. This number is shifted towards higher values as the value of the power decay index (n) increases. For lower numbers of distributed antennas, the coverage is not uniform enough. For higher values, the prevision of additional RoF components degrades the overall energy per bit. The optimal number of antennas is respectively equal to 5 for n=4, 6 for n=4.2, 8 for n=4.4 and 10 for n=4.6. The denser the environment the higher the number of distributed antennas to minimize the average energy per bit.
8. Conclusions
In this paper, we have proposed a method to determine the optimal positions of antennas in an RoF-DAS topology. This method is performed in two stages. First, we position the antennas by maximizing the overall network capacity. Then, we show that for each particular scenario, there is an optimal number of antennas that maximizes the energy-efficiency of the system. This method can be used to design RoF-DAS deployments in any topology, with different user-presence probability distributions and building layouts.Although we have considered Wi-Fi transmission with a statistical RF propagation model, the same method can be applied to other communication standards taking the precise topology of the environment to be covered into account. Additional improvement in energy efficiency and RF exposure level of DAS may be expected thanks to selective transmission with a full control of the optical components. With this kind of architecture, the RF power is only radiated at the distributed antenna(s) where and when communications are required in the presence of mobile terminals. In that case, additional devices should be considered to manage handover and sleep modes.
ACKNOWLEDGEMENTS
The authors wish to thank Bernard Della for his support in the experimental setup, Camilla Kärnfelt for fruitful discussions and the members of the CapilRTM platform of TELECOM Bretagne, dedicated to radio-over-fiber technologies.
References
| [1] | M.J. Crisp, S. Li, A. Watts, R.V. Penty, Uplink and Downlink Coverage Improvements of 802.11g Signals using a Distributed Antenna Network, Journal of Lightwave Technology, vol. 25, no. 11, pp. 3388-3395, Nov. 2007. |
| [2] | Honglin Hu, Yan Zhang, Jijun Luo, Distributed Antenna Systems: Open Architectures for Future Wireless Communications, §3.2.3 Power Efficiency of DASs, page 68, Auerbach Publications 2007. |
| [3] | M. Sauer, A. Kobyakov, J. George, Radio over fiber for picocellular network architectures Lightwave Technology, vol. 25, no. 11, 2007, pp. 3301–3320, Nov. 2007. |
| [4] | L. Feeney and M. Nilsson, Investigating the energy consumption of a wireless network interface in an ad hoc networking environment, in INFOCOM 2001. Twentieth Annual Joint Conference of the IEEE Computer and Communications Societies. Proceedings. IEEE, vol. 3, 2001, pp. 1548 –1557 |
| [5] | P. Chow, A. Karim, V. Fung, and C. Dietrich, Performance advantages of distributed antennas in indoor wireless communication systems, in Vehicular Technology Conference, 1994 IEEE 44th, jun 1994, pp. 1522–1526 |
| [6] | J. Zhang and Y. Wang, Energy-efficient uplink transmission in sectorized distributed antenna systems, in IEEE International Conference on Communications Workshops (ICC), May 2010, pp. 1 –5. |
| [7] | M. Crisp, R. Penty, I. White, and A. Bell, Wideband radio over fiber distributed antenna systems for energy efficient in-building wireless communications, in IEEE 71st Vehicular Technology Conference (VTC 2010-Spring), May 2010, pp. 1 –5. |
| [8] | X. Wang, P. Zhu, and M. Chen, Antenna location design for generalized distributed antenna systems Communications Letters, IEEE, vol. 13,no. 5, pp. 315 –317, May 2009. |
| [9] | L. Dai, A comparative study on uplink sum capacity with co-located and distributed antennas, Selected Areas in Communications, IEEE Journal on, vol. 29, no. 6, pp. 1200 –1213, june 2011. |
| [10] | G. Auer, V. Giannini, M. Olsson, M. Gonzalez, and C. Desset, Framework for energy efficiency analysis of wireless networks, in Wireless Communication, Vehicular Technology, Information Theory and Aerospace Electronic Systems Technology (Wireless VITAE), 2011 2nd International Conference on, 28 2011-March 3 2011, pp. 1 –5. |
| [11] | Y. Josse, B. Fracasso, and P. Pajusco, Model for energy efficiency in radio over fiber distributed indoor antenna Wi-Fi network, in The 14th International Symposium on Wireless Personal Multimedia Communications (WPMC’11), Brest, France, Oct. 2011. |
 Abstract
 Reference
 Full-Text PDF
 Full-Text HTML