-
Paper Information
- Next Paper
- Previous Paper
- Paper Submission
-
Journal Information
- About This Journal
- Editorial Board
- Current Issue
- Archive
- Author Guidelines
- Contact Us
International Journal of Networks and Communications
p-ISSN: 2168-4936 e-ISSN: 2168-4944
2012; 2(5): 112-122
doi: 10.5923/j.ijnc.20120205.04
The Limitations of Campus Wireless Networks: A Case Study of University of Nigeria, Nsukka[Lionet]
 Abstract
 Reference
 Full-Text PDF
 Full-Text HTML
Udora N. Nwawelu , Anthony N. Nzeako , Mamilus A. Ahaneku
Department of Electronic Engineering, University of Nigeria, Nsukka, Enugu, Nigeria
Correspondence to: Udora N. Nwawelu , Department of Electronic Engineering, University of Nigeria, Nsukka, Enugu, Nigeria.
| Email: |  |
Copyright © 2012 Scientific & Academic Publishing. All Rights Reserved.
This work studied the effects of physical environment (trees and buildings) obstructions on the Lionet in Nsukka campus of the University of Nigeria. The effects of these obstructions were measured by the variation in path loss and received signal strength as functions of distance using computer simulation and field measurement. The simulation results were compared with the field measurement results, conducted under free space condition and where the Lionet signal was obstructed by trees and buildings. The results show that trees and buildings have significant effects on the path loss and the received signal strength of the Lionet. The study therefore recommends that the power level of the Lionet should be improved for efficient performance, more access points should be deployed at locations where obstructions are prevalent, and Lionet should possibly migrate from wireless to fibre optic network.
Keywords: Physical environment, Received Signal Strength, Path Loss, Free Space
Article Outline
1. Introductio
- Wireless communication system refers to any system that uses electromagnetic waves to transfer information from one point to another without using wires[1]. In communication systems where antennas are used to transmit information from one point to another, the medium between (and around) the transmitter and receiver has a major influence on the quality of the transmitted signal. This is because radio wave propagation is very sensitive to the properties and effects of the medium located between the transmitting and the receiving antennas[2]. When radio wave impinge on an obstruction, some of the energy can be reflected back into the initial medium, some may be transmitted into the second medium, some may be absorbed by the medium, some may be diffracted and some may be scattered[3][4][5][6]. The interaction of radio waves with the obstruction reduces its received signal strength. The University of Nigeria Nsukka, in Enugu State of Nigeria, operates wireless network communication system for its diverse activities. Many ornamental trees for aesthetic and large buildings constitute major physical features of the University environment. For the fact that radio waves are very sensitive to obstructions, the trees and buildings are expected to have significant effects on the received signal strength, besides other attenuating factors such as the terrain. This factor ought to be taken into consideration in the deployment of wireless communication networks in the University environment. The University has land mass of about 871.38 hectares in an asymmetrical shape lying to the Northeast of Nsukka town. The bulk of the buildings in the University occupy the Western half of the site. Buildings are known to be main source of signal attenuation, but vegetation elements such as trees also have some reducing effects on a propagated radio signal. When the radio waves are being transmitted through the buildings, the penetration loss causes the signal to be severely attenuated[7]. For the trees, the discrete scatterers such as the randomly distributed leaves, twigs, branches and tree trunks can also cause attenuation, scattering, diffraction, and absorption of the transmitted radio signal[8]. The poor signal reception frequently experience in the University has been attributed to the obstruction of the Lionet signal by the trees, buildings e.t.c. For the buildings, scattering, absorption and diffraction of the Lionet signal when it interacts with the buildings could be the main cause of signal degradation and fluctuation. For the case of the trees, Lionet signal propagating through them is attenuated because of the absorption of power by the components of the tree canopy such as leaves, branches e.t.c. There are also some losses in the transmitted Lionet signal due to scattering of power out of the beam by the components of the tree canopy. Preliminary investigations around the Lionet access points revealed that the subscribers usually receive the signal better around the trees nearer to access points. This is evidence that the propagated Lionet signal is being obstructed by trees and buildings, thus preventing it from covering its maximum expected range. Studies on the effects of vegetation and buildings on the transmitted radio signal have been done. Propagation measurements through vegetation over a range of frequencies have been carried out in rain forests of India between 50 – 800 MHz[9], through a single tree between 1 and 4 GHz, in a forested urban park between 0.9 and 1.8 GHz, in various foliage and weather condition between 2 and 60 GHz[10]. The effects of vegetation on GSM signal propagation in rural areas has been studied[11]. Also, a good number of research works on data acquisition were reviewed. These dealt with measurements to study the effects of a single tree, a line or multiple lines of tress along the streets or buildings, a small forest, and a large forest covering a region on the propagated radio signal[10][12][13][14]15]. Investigation of foliage effects on a propagated radio signal via data logging for point-to-point link at 5.8 GHz was reviewed. The result showed that point-to-point link which was obstructed by a single tree and a row of trees recorded an average of 12.2615 dB and 4.6306 dB excess path losses respectively[10]. In[16], study on the influence of trees on radio channel at frequencies of 3 and 5 GHz shows that the excess path loss was between 1 and 16 dB. For the measurements carried out in the residential areas and homes for the transmission frequency in the 5.85 GHz band, building penetration attenuation was reported at an average of 14 dB[10]. The present study is motivated by the undesirable poor signal reception, loss of data packets, and delay in uploading and downloading of data, frequently experience from the radio wave signal transmitted by the Lionet within the University environment. The study investigates the extent of signal attenuation due to the trees and buildings, by using spectrum analyzer (SPECTRAN HF 6080) to monitor the mean path loss and received signal strength from one of the Lionet’s signal access point in the University. The modeling equations describing the signal attenuation due to tree and building obstructions are developed for detail analysis and in-depth understanding of the scenario. A computer simulation programs based on MATLAB is used to study the variations in the path loss and received signal strength as functions of the separation distance between transmitting and receiving antennas to validate the results from the spectrum analyzer.
2. Suggested Tree Path Loss Propagation Model
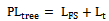
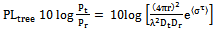
- Path loss prediction of Lionet signal passing through a tree includes; free space loss plus tree loss factor (Ltree). The tree loss factor is included in the model to account for the increase in attenuation of the received signal strength when the receiver is placed behind a tree. Mathematically, this becomes[10].
 | (1) |
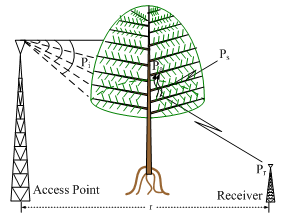 | Figure 1. Geometry of tree Canopy |
 respectively, where the subscript b is an element of
  is used to denote branches of the nth size category.Attenuation of radio wave propagating through a tree is primarily due to scattering and absorption caused by both leaves and branches. Some assumptions made while trying to reduce the complexity of the model include:• Loss due to the trunk as a result of diffraction is considered negligible[18].• The tree is so tall that there is no diffraction.• The leaves are assumed to be identical and homogenous.• Multiple scattering is negligible.• The tapered nature of the individual branches is neglected. From figure 1, the power balance in the volume is;
 | (2) |
 | (3) |
 | (4) |
 is readily related to power density
  , the magnitude of the time-average pointing vector as[11];
  | (5) |
 | (6) |
 | (7) |
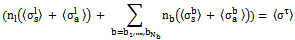
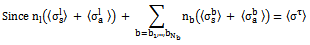
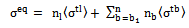
 contributed by the scattering and absorption of incident power by the leaves, represented by their number n1 and branches classified into Nb different size categories represented by their number
  is:
is: | (8) |
 Therefore equation (8) becomes;
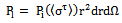 | (9) |
 | (10) |
 | (11) |
 | (12) |
 is the emitted power density in a spherical wave generated by an isotropic antenna with a time-average transmitted power Pt,[1].
 | (13) |
 | (14) |
 | (15) |
 | (16) |
 | (17) |
 Let
Let Hence, equation (17) becomes;
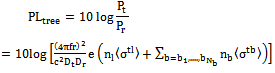 | (18) |
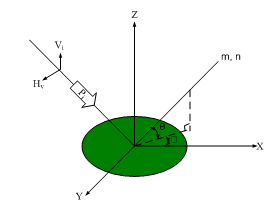
2.1. Expectation Value of the Total Cross Section
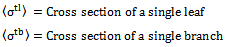
- The total cross section
 is the sum of the cross section due to absorption and scattering of incident power density by a single leaf and a single branch. It is written as:
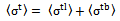 | (19) |
 | Figure 2. Incident Wave on a Single Leaf or a Single Branch of the Tree Canopy |
 ,
,  ) to describe it.where;= Elevation orientation angle of leaves and branches of the tree canopy.
 = Azimuthal orientation angle of leaves and branches of the tree canopy.The normal of the disc is denoted by n and the symmetry axis of the cylinder by m. From figure 2, the normal vector which also is valid for the symmetry axis of the cylinder can be written as;
 | (20) |
2.2. The Expectation Value of the Total Cross Section
- The general expression for the expectation value of total cross section of a single leaf and a single branch of the tree canopy is;
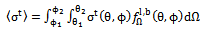 | (21) |
 is the solid angle,
  equals the probability density function for the azimuthal and elevation orientation angle of the leaves and branches of the tree canopy.Based on the fact that leaves and branches in the canopy are randomly placed, we employed a statistical based approach to characterize the leaves and branches of the canopy. This relation takes the form of probability density function. The probability density for the leaves and branches in the azimuthal coordinate
  is assumed to be uniformly distributed over the tree canopy volume from 0 ≤
 < 2π. Also, the probability density for the leaves and branches in elevation coordinate
  is considered to be uniformly distributed and of the form;
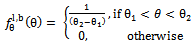 | (22) |
 and
and  with
with  . The mean cross section of a single leaf of a tree canopy is
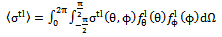 | (23) |
 with 0 ≤ ϕ < 2π,
  ,
,  . The mean cross section of a single branch of a tree canopy is
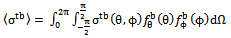 | (24) |
 | (25) |
 ; the number of leaves and branches of a tree canopy are
 is the number of branches of different size categories.
3. Suggested Building Path Loss Propagation Model
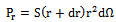
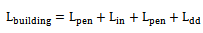
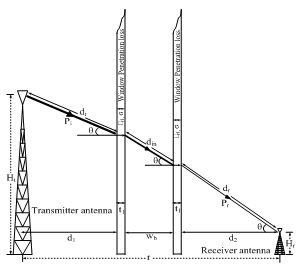
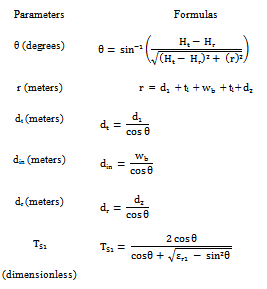
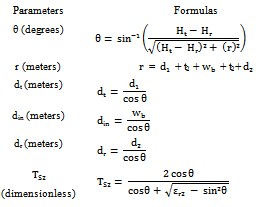
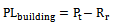
- Path loss prediction of the Lionet signal passing through a building includes; free space loss plus building loss factor. The building loss factor is included in the model to account for the increase in attenuation of the received signal strength when the receiver is placed behind a building. The expression for the path loss from the transmitting antenna to the receiving antenna in the presence of a building is;
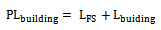 | (26) |
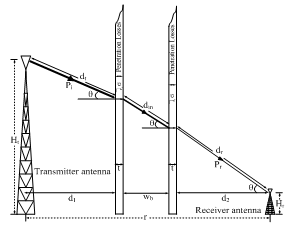 | Figure 3. Geometry of Lionet Signal Transmission through a Building |
3.1. Free Space Loss Model
- The equation for free-space propagation between two antennas is given by the Friis transmission equation[21];
 | (27) |
3.2. Building Loss Factor
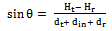
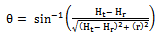
- When the Lionet signal passed from the building to the receiving antenna, an expression for the building loss factor is written as:
 | (28) |
 | (29) |
 | (30) |
 | (31) |
 | (32) |
 | (33) |
 | (34) |
 | (35) |
 | Figure 4. Configuration for Lionet Signal Penetrating the Glass Window |
|
 | (36) |
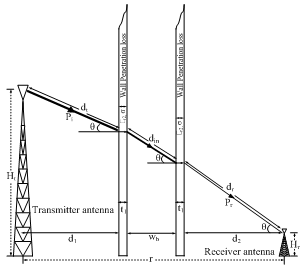 | Figure 5. Configuration for Lionet Signal Penetrating the Wall |
|
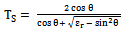
 | (37) |
3.3. Distance Dependence Losses
- Distance dependence losses are dependent on the distance from the building to the receiving antenna. The path loss dependence with distance from the building to the receiver was chosen equal to 2 as in the case of free-space loss because it obeys power decays law[1]. The resultant expression is;
 | (38) |
 | (39) |
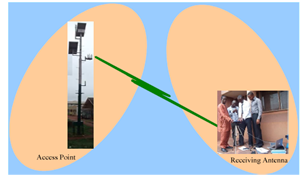 | Figure 6. Free Space Condition |
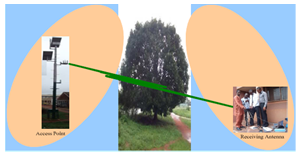 | Figure 7. Obstruction of Lionet Signal by a Single Tree |
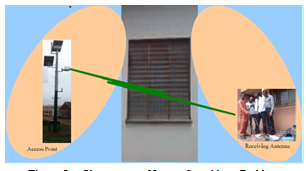 | Figure 8. Obstruction of Lionet Signal by a Building |
4. Experimental Setup and Measurements
- The experimental setup for measuring the path loss and received power level under free space condition and where a single tree or a building obstructs the Lionet signal are shown in figures 6, 7, and 8, respectively. At the transmitting section, omni-directional antenna (WBS 2400) with transmitting power of 19 dB is mounted at the top of 7m height mast Ht. Along the transmission path lays either a tree or a building, which obstructs the Lionet signal as in the case shown in figure 7 and 8. The receiving section consisted of a spectrum analyzer (SPECTRAN HF 6080) that was connected to a Laptop (HP G62) loaded by Aaronia test software for data logging, and Uninterruptible Power Supply (UPS) to provide emergency power whenever there is any occurrence of power disruption, which may eventually result in data loss. The access point of interest is partly impeded by a tree and a building as shown in the figures 7 and 8, while part of the access point is free from any kind of obstruction as shown in the figure 6. The received power level was measured with SPECTRAN HF 6080 via an omni-directional antenna (WBS 2400). The SPECTRAN HF 6080 was adjusted to a frequency of 2400 MHz at sampling rate of 5000 ms. The receiving antenna is directional while the transmitting antenna has no restriction. Finally, from the measured received power level, we obtained the measured path loss for the three scenarios shown in figures 6, 7, and 8.
4.1. Simulations Results and Discussions
4.1.1. Path Loss in dB as a Function of Transmitting and Receiving Antennas Distance for the Models
- The results from simulation of the free space path loss, suggested tree path loss, and building path loss models are shown in table 4, with their corresponding plots in figure 9. The simulated results from the free space path loss are used as a reference point to study the extent a single tree or a building blockage affected the path loss. From the plot, it is seen that the graph increases in exponential manner; this means that the path loss exponentially increased with the distance of separation between the transmitting and receiving antennas. By further examining the plot for the free space propagation model, it is observed that its graph is lower than the graphs obtained when the Lionet signal is obstructed by a single tree or a building. This may be attributed to the fact that the propagation of Lionet signal through free space is free from any form of obstruction as compared to the other two cases with obstruction of a tree and building along its communication path.Another observation made from the plots of the path loss versus the distance of separation between the transmitting and receiving antennas is the dependency of the received signal strength on the variation of the distance decay rate. This is because, increase in path loss results to the gradual decay of the signal strength[11].
| ||||||||||||||||||||||||||||||
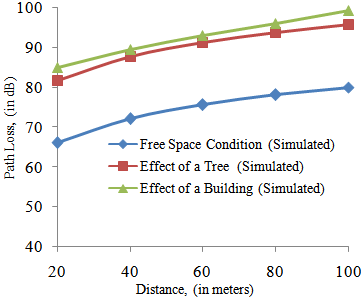 | Figure 9. Plots of Simulated Path Loss with Distance for the Three Models at Frequency of 2400 MHz |
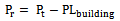
4.1.2. Received Power Level in dB as a Function of Transmitting and Receiving Antennas Distance for the Models
- From the result of the free space path loss, suggested tree path loss, and building path loss model shown in table 4, received power level for the three scenarios were obtained using the relationships:
 | (40) |
 | (41) |
 | (42) |
| ||||||||||||||||||||||||||||||
 | Figure 10. Simulated Received Power Level with Distances for the Three Models at Frequency of 2400 MHz |
4.2. Field Measurements Results and Discussions
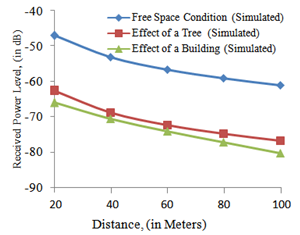
4.2.1. Received Power Level in dB as a Function of Transmitting and Receiving Antennas Distance under Free Space, and Non Line-of-Sight Condition
- Table 6 is the results from field measurements taken under free space condition and non line-of-sight condition (areas where the Lionet signal is obstructed by a single tree or a building). Also, their corresponding plots are figure 11.
| ||||||||||||||||||||||||||||||
 | Figure 11. Plots of the Measured Received Power Level with Distance for the Three Scenarios at Frequency of 2400 MHz |
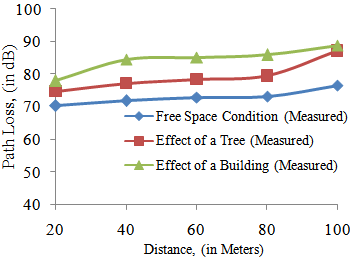
4.2.2. Path Loss in dB as a Function of Transmitting and Receiving Antennas Distance under Free Space, and Non Line-of-Sight Condition
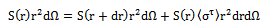
- From the measured received power level taken under free space and areas where the Lionet signal is obstructed by a single tree or a building, the measured path loss for the three scenarios shown in table 7 were obtained using the relationships:
 | (43) |
 | (44) |
 | (45) |
| ||||||||||||||||||||||||||||||
 | Figure 12. Plots of the Measured Path Loss with Distances for the Three Scenarios at Frequency of 2400 MHz |
4.3. Comparison of the Simulated Results with the Field Measurement Results for the Three Scenarios
- The simulated path loss results and the measured path loss results due to the obstruction of Lionet signal by a single tree and a building were compared using the simulated and measured free space path loss results as the reference point.Comparing the simulated free space path loss with that due to the effect of a single tree, the losses at different distances under consideration was 15.7dB. For that due to the effect of a building, we found the losses at different distances of consideration between 17.5 and 19.23 dB. Also, comparing the measured free space path loss with that due to the effect of a single tree, the losses at different distances under consideration were between 4.42 and 10.64 dB. For the case due to the effect of a building, the losses at different distances under consideration were between 7.72 and 12.84 dB. The result obtained for the scenario where the Lionet signal was obstructed by a single tree, agreed with the field measurement results obtained by Karlsson et al[24] in which the path loss is between 1 and 16 dB at 3.1 and 5.8 GHz frequencies. Also, the results obtained due to the obstruction of the Lionet signal by a building conformed to result of building penetration loss reported by Durgin et al[25] at an average value of 14 dB. This implies that the effects of trees and buildings on campus wireless networks are quite significant.
5. Conclusions
- This work has studied the effects of the obstruction of trees and buildings on the Lionet wireless network. The study revealed that one of the problems that hinder efficient performance of the Lionet wireless network is the presence of trees and built structures. This resulted in poor signal reception, missing of data packets, delay in uploading and downloading of data, and fluctuation of signals. The mathematical models that described this physical problem were formulated, and simulated in computer program written in MATLAB. The simulation results showed reasonable agreement with experimental results for the studied three scenarios. The results showed that attenuation due to the presence of trees and buildings in the Lionet communication path is substantial. The results also showed that the Path loss increased, while the received power level decreased with the distance of separation between the transmitting and the receiving antennas, and vice versa. This study therefore recommends that the power level of the Lionet signal strength should be improved for efficient performance; more access points should be deployed at locations where obstructions are prevalent, and Lionet should possibly migrate from wireless to fibre optic network.
References
| [1] | Robert K. Crane, Propagation Handbook for Wireless Communication System Design: CRC Press LLC, Boca Raton London New York Washington, D.C., 2003. |
| [2] | Robert E. Collin, Antennas and Radio Wave Propagation: McGraw Hill Inc, 1985. |
| [3] | Theodore S. Rappaport, Wireless Communication, Principles and Practice, 2nd ed., Pearson Education Inc. Singapore, 2000. |
| [4] | Y. S. Meng, Y. H. Lee, B. C. Ng, “Study of Propagation Loss Prediction in Forest Environment”, Progress in Electromagnetics Research B, Vol. 17, 117-133, 2009. |
| [5] | Tilahun Abebe, “Modeling of Scattering and Absorption by Phantom Tissue”, Addis Ababa University Addis Ababa, Ethiopia, 2010. |
| [6] | Sng Sin Hie, “Radio Channel Modeling For Mobile Ad Hoc Wireless Networks”, Naval Postgraduate School Monterey, California, 2004. |
| [7] | M. S. H. Al Salameh , Y. S. A. Al-Mashhadani, “Impact of a Concrete Room on the Performance of Cellular Telephone Communications for Low Bit Rate Applications”, ARPN Journal of Engineering and Applied Sciences, VOL. 6, 2011. |
| [8] | Y. S. Meng, Y. H. Lee, B. C. Ng, “Study of Propagation Loss Prediction in Forest Environment” Progress in Electromagnetics Research B, Vol. 17, 117-133, 2009. |
| [9] | R.K. Tewari, S. Swarup, and M. N. Roy, “Radio Wave Propagation through Rain Forests of India” IEEE Transactions on Antennas and Propagation, Vol.38, No.4, pp. 433-499, 1990. |
| [10] | Pon Lai Ly, Phoon Lai Ly, Tharek Abd. Rahman, Mohammed Khomeini Abu, “Investigation of Foliage Effects via Remote Data Logging at 5.8 GHz”, Wireless Communication Centre, Faculty of Electrical Engineering Universiti Teknologi Malaysia, 2010. |
| [11] | Oriuwa Richard Chukwudi, “The Effects of Vegetation on GSM Signal Propagation in Rural Areas”, M. Eng. Thesis, University of Nigeria Nsukka, Nigeria, 2008. |
| [12] | Michael J. Gans, Noach Amitay, Y. S. Yeh, T. C. Damen, Reinaldo A. Valenzuela, Choelhang Cheon, Jeho Lee, “ Measurements for Fixed Wireless Loops (FWL) in a Suburban Region with Foliage and Terrain Blockages”, IEEE Transactions on Wireless Communications, Vol.1, No.2, pp. 302- 310, 2002. |
| [13] | T. Sofos and P. Constantinou, “Propagation Model for Vegetation Effects in Terrestrial and Satellite Mobile Systems”, IEEE Transactions on Antennas and Propagation, Vol.52, No.7, 1917-1920, 2004. |
| [14] | S. Perras and L. Bouchard, “Fading Characteristics of RF Signals Due to Foliage in Frequency Bands from 2 to 60 GHz”, The 5th International Symposium on Wireless Personal Multimedia Communications, pp. 267- 271, 2002. |
| [15] | J. Goldhirsh and W. J. Vogel, Roadside Tree Attenuation Measurements at UHF for Land Mobile Satellite Systems, IEEE Transactions on Antennas and Propagation, Vol.35, No.5, pp. 589-596, 1987. |
| [16] | A. Karlsson, R.E. Schuh, C. Bergljung, P. Karlsson, and N. Lowendahl, “The Influence of Trees on Radio Channel at Frequencies of 3 and 5 GHz”, IEEE VTS 54th Vehicular Technology Conference, pp. 2008-2012, 2001. |
| [17] | Yvo L. C. de Jong, Matti H. A. J. Herben, “A Tree-Scattering Model for Improved Propagation Prediction in Urban Microcells”, IEEE Transaction on Vehicular Technology, Vol. 53, No. 2, 2004. |
| [18] | Peter Johannesson, “Wave Propagationthrough Vegetation at 3.1 GHz and 5.8 GHz”, Department of Electroscience, Lund Institute of Technology Sweden, 2001. |
| [19] | Kiyoshi Honda, “Interactions between Electromagnetic Wave and Targets” Space Technology Applications and Research Program School of Advanced Technologies Asian Institute of Technology. |
| [20] | Kamal Sarabandi, “Electromagnetic scattering from vegetation canopies” PhD Thesis, University of Michigan, 1989. |
| [21] | ITU-R, Recommendation ITU-R P.841, “Conversion of Annual Statistics to Worst-Month Statistics”, International Telecommunication Union, Geneva, 1994. |
| [22] | G. A. 1. Van Dooren, “A deterministic approach to the modelling of Electromagnetic wave propagation in urban environments", Ph.D. Thesis, Eindhoven University of Technology, Netherlands, 1994. |
| [23] | S. Stavrou and S.R. Saunders. “Review of constitutive parameters of building materials”, Centre for Communication Systems Research University of Surrey, United Kingdom. |
| [24] | Karlsson A., R.E. Schuh, C. Bergljung, P. Karlsson, and N. Lowendahl, “The Influence of Trees on Radio Channel at Frequencies of 3 and 5 GHz”, IEEE VTS 5th Vehicular Technology Conference, pp. 2008-2012, 2001. |
| [25] | Durgin G., T.S. Rappaport, and H. Xu., “Measurements and Model for Radio Pathloss and Penetration Loss in and Around Homes and Trees at 5.85 GHz”, IEEE Transactions on Communication, Vol. 46, No.11, pp. 1484-1496, 1998. |