Raban Yobe Ngwira
Department of Metallurgy and Mineral Processing, The University of Zambia, Lusaka Zambia
Correspondence to: Raban Yobe Ngwira , Department of Metallurgy and Mineral Processing, The University of Zambia, Lusaka Zambia.
| Email: |  |
Copyright © 2020 The Author(s). Published by Scientific & Academic Publishing.
This work is licensed under the Creative Commons Attribution International License (CC BY).
http://creativecommons.org/licenses/by/4.0/

Abstract
Konkola West Concentrator stockpile handles 55000 tonnes copper ore per day producing an average of 400 tonnes of concentrate. The grade of the concentrate is 36 to 40% TCu. The plant efficiency (recovery) is at 89% TCu. The concentrator operations include: Primary, secondary and tertiary crushing, grinding, flotation, dewatering and tailings disposal. The objective of this study was to investigate optimum grind of a blended copper ore comprising sulphide and oxide minerals with a view to achieving an optimal flotation performance in the treatment of the Konkola Copper Mines ore in Chilabombwe. This required an in-depth analysis of the mineralogy of the feed as well as tailings samples after different flotation processes involving a range of reagent types and dosage procedures. The in-depth analysis included the analysis of the percent Total Copper (%TCu) and percent Acid Soluble Copper (%ASCu) of the feed, concentrate recovered and the tails. The reagents used in the flotation process included; Sodium Isopropyl Xanthate (SIPX), Frother Zambia Konkola (FZK 245) and Sodium hydro-Sulphide (NaHS). The ore samples studied represented a high quality (HQ) ore dominated by sulphide minerals and low quality (LQ) ore dominated by oxide minerals. The project was initiated on the 18th of August, 2015. The experimental results showed that optimization of grind for the blended copper at different grinding times was successfully achieved and can be used to increase the concentration of copper at KCM West concentrator.
Keywords:
Concentration, Feed, Mineralogy, Mineral processing, Optimization, Recovery, Tails
Cite this paper: Raban Yobe Ngwira , Grind Optimization of Konkola Blended Copper Ore, International Journal of Metallurgical Engineering, Vol. 8 No. 1, 2020, pp. 7-21. doi: 10.5923/j.ijmee.20200801.02.
1. Introduction
1.1. Classification of Konkola Copper Ore
Konkola Copper Mines which is one of the wettest mine in the world is located in Chilabombwe. Chililabombwe, also formerly known as Bancroft, is a small town located on the Congo Border in Zambia’s Copperbelt Province (Mulenga 1993). Figure 1 shows the map of the location of Konkola West Concentrator.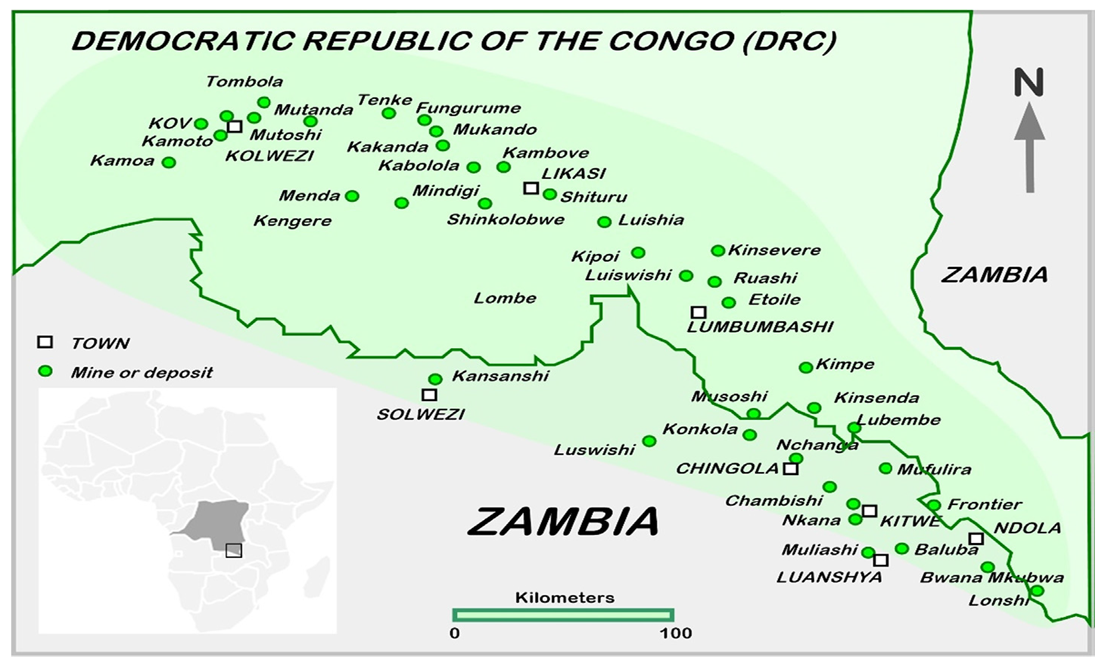 | Figure 1. Location of Konkola (Chilabombwe) (Source: Crundwell et al 2020) |
The new plant now known as Konkola West Concentrator started operating towards the end of 2008. The new plant was setup in order to increase the efficiency of operations which includes concentration of copper from its ore. Konkola West Concentrator processes underground ore from No. 1, No. 3 and No. 4 Shafts. At Konkola Copper mines, however, there is no No.2 shaft. No. 1 and No. 4 Shafts are located within the proximity of the plant; ore is transported by a network of conveyor belts while that from No. 3 Shaft, located about three kilometers away is transported by dump trucks which bring the copper ore to the stockpile where blending of the copper ore takes place. The ore has an average grade of 3.0% T Cu and a composition of the ore is mainly Bornite, chalcopyrite and chalcocite with traces of malachite and pseudo malachite. The stockpile handles 55000 tonnes copper ore per day producing an average of 400 tonnes of concentrate. The grade of the concentrate is 36 to 40% TCu. The plant efficiency recovery is at 89% TCu. Table 1 shows the basic classification of Konkola Copper mineral deposits.Table 1. Basic Classification of Konkola Copper mineral deposits
 |
| |
|
From table 1, it can be seen that the Konkola ore deposit is made up of primary and secondary copper minerals which are basically sulphides and oxides. According to Ayres (2002), Copper ores are known to be complex in nature as they constitute a variety of other minerals in different proportions such as sulphides, oxides, pyrites, pyrrhotite and other precious metals like gold and silver. Copper sulphide ores do not dissolve in leaching solutions of dilute sulphuric acid but they are soluble when the copper ore is in its oxidized state (Greenough 1932). Furthermore, mining areas usually contain an enormous amount of copper sulphides compared to oxides which occur in minor quantities and hence extraction of copper from the copper oxides is by leaching whilst that of the copper sulphides is by flotation (Bulut et al. 2007). Also according to Konecna (2012), in some processing industries, the copper sulphides and oxides are blended together followed by grinding then conditioning with sulphurdizers for subsequent flotation processes, while in other industries copper sulphides are taken directly for concentration by flotation whereas the oxides are taken through the hydrometallurgical process for leaching (Konecna 2012).In order to liberate the mineral values from an ore, Communition process is applied to liberate the mineral valuables through the process of crushing and grinding. Crushing in mineral processing is initiated first, it is often referred to as the “first stage of communition” (Wills 1998). After the run-off-mine ore has been crushed to a required size, it is then taken through the secondary stage of communition called grinding (Sunny 2018). Grinding is carried out in cylindrical vessels known as tumbling mills in which the particles are further reduced to the required size by size reduction through the compression, abrasion, chipping and impact forces in the mills to a size required by the subsequent froth flotation process (Wills and Napier-Munn 2006). In mineral processing froth flotation is employed to recover the valuable minerals of interest. Froth flotation is a process that involves the selective recovering of valuable minerals and the gangue by taking advantage of the difference in their physio-chemical properties (Mu et al 2016).At Konkola West Concentrator communition and flotation processes are employed to fully recover the copper minerals from the blended ore. The concentrator operations include: Primary, secondary and tertiary crushing, grinding, flotation, dewatering and tailings disposal. The objective of this study was to investigate optimum grind of a blended copper ore comprising sulphide and oxide minerals with a view to achieving an optimal flotation performance in the treatment of the Konkola Copper Mines ore in Chilabombwe. Furthermore, the study sought to establish the relationship between recovery and grind.
2. Methodology
This chapter mainly concentrates on the experimental procedures undertaken and the results analysis, as well as the equipment and reagents used for the experiments. The test were carried out using the standard flotation methods which were recommended.
2.1. Apparatus
• Laboratory jaw crushers (Primary, Secondary and Tertiary crushers)• -4mm sieves• Laboratory Ball mill• Denver D-12 Laboratory Flotation Machine• 2-litre Denver flotation Cell• Electronic Balances• Gloves• Measuring Cylinder• Laboratory Drying ovens• Flotation Paddles• Wash bottles• Flotation pans• Plastic bags
2.2. Reagents
• Sodium Isopropyl Xanthate (SIPX)-Collector• Sodium Hydrogen Sulphide (NaHS)-Promoter/Activator• Frother Zambia Konkola (FZK 245)-Frother
2.3. Sample Collection and Preparation
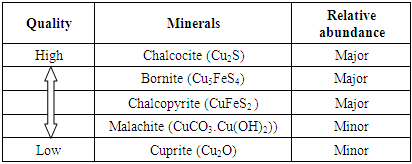
Sample collection and blending was done from Konkola West Concentrator stockpile coming from the three shafts i.e. number 1,3 and 4 shafts, then taken for drying to the laboratory. Drying of the samples was done on stainless steel trays as shown in figure 2.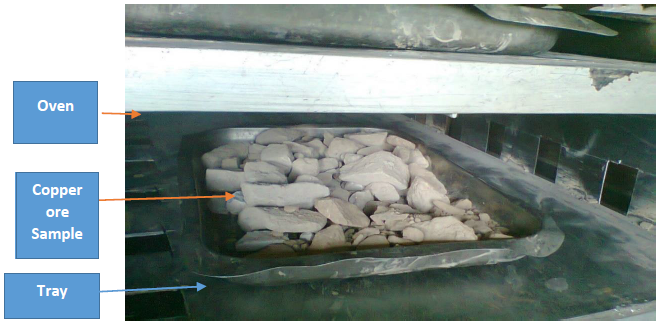 | Figure 2. Drying of the samples in the oven below 100°C (Done below 100°C to avoid oxidation of the ore samples) |
Drying was done for 1hour 30min below 100°C in order to avoid oxidation and then followed by cooling the samples in open air as shown in figure 3. The samples were then crushed using the primary, secondary and tertiary crusher. “Crushing is the first mechanical stage in the process of comminution in which the main objective is the liberation of the valuable minerals from the gangue, furthermore, it is defined as the operations, required to reduce run-of-mine ore to the size, suitable to feed grinding mills” (Wills 1998). On a laboratory scale, in this project, the size of the ore required to feed the grinding mill was 4mm particle size. 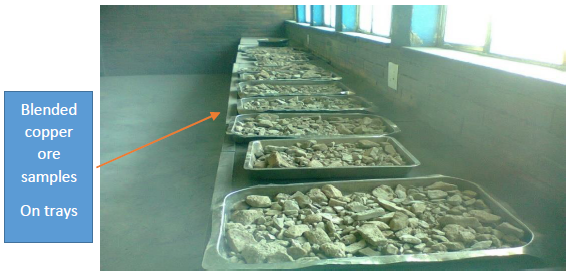 | Figure 3. Samples being cooled after drying below 100°C |
The crushed samples were sieved on a 4mm sieve. The samples passing the sieve (undersize) were then package in plastics to weigh 1kg. The samples that could not pass were retained as oversize. Figure 4 shows the how the samples were sieved, weighed and packaged.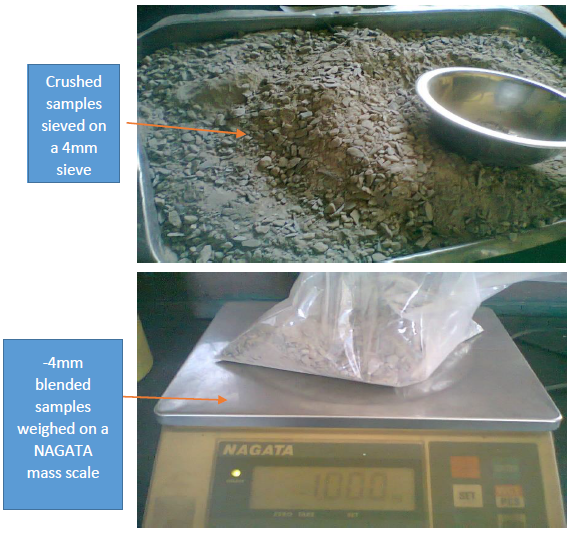 | Figure 4. -4mm sieved sample ores crushed and weighed (1000g) |
2.4. Grinding
The laboratory pebble mill with a diameter of 180mm and depth of 240mm was charged with fifteen 8mm steel balls, 1000grams ore, 1 litre water, closed and operated at 210 rpm as recommended by the senior metallurgist. Grind was done at different times i.e. starting at 4min then 6min, 8min, 10min, 12min, 14min, 16min, 18min and then finally 20minutes for different each different charge. After grinding for each respective time, the samples were transferred into the flotation cells with an addition of 0.8litre of water making up 1.8 litres.The head samples representing Test 1NA and Test 2 NB were used to do the particle size distribution (PSD). The method was carried out as follows:• Six set of sieves, that is, 450, 315, 212, 150, 106 and 75 sieves were piled up followed by putting them in descending order on a sieve shaker.• Followed by cyclozing 100grams of the -75micons samples to produce the +38 microns, +10microns and -10 microns samples using the cyclosizer.• The initial weight of the head dried sample was weighed, in this case 300grams.• This was followed by collecting mass retained or sediments on each sieve after shaking• The collected mass on each sieve was weighed and cumulative percentages were calculated.• Each sediment from the representative screens was then taken for mineralogical analysis.
2.5. Reagent Preparation and Flotation Operation
The calculations were done as follows:Calculation of the active reagent in a mass of reagent: - | (7) |
With the strength of reagents given for SIPX and NaHS as 80% and 70% respectively the active mass of reagent was found. Using equation (7) for example if 100gram of SIPX was used as mass of reagent then to find the Active mass of reagent of SIPX was 80grams and the other 20grams was inactive or not useful. That is, = 80 grams as an example.1% solution of SIPX and NaHS were prepared except for the frother (FZK). For 1% solution strength, volume of water required: -
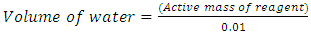 | (8) |
This is the volume of water required for the preparation of the solution strength of the reagent. For the volume required for dosing the calculation was done as follows:- | (9) |
One drop of frother from the syringe with a needle is equivalent to 10gpt such that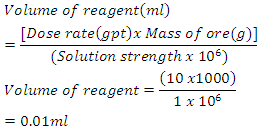 Converting the drops for easy addition:-
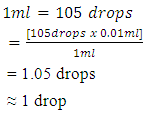 For the flotation process and operations, volumes to be used in the flotation process were 6.87ml and 8.49ml respectively as was recommended as the standard. The volumes were taken by using different syringes which were labeled as SIPX and NaHS. The concentrates for both stages and the tails altogether were air filtered and then taken to the oven for drying until they were completely dry. Figure 6 shows how the concentrate was filtered using air filter pressure pumps. The Denver D12 Flotation machine was set at 1400 revolutions per minute (rpm). In the first stage i.e. the sulphide stage 6.87ml of SIPX was added to the sample for conditioning for 3minutes. After 3min 3 drops of frother FZK245 was added to condition for 1min. After conditioning, the air valves were opened to allow entry of air into the solution. Collection of the concentrate was done for 10seconds per 2 pours for both stages using flotation paddles for 6minutes altogether making 10minutes.After the first stage, air valves were closed. This was then followed by simultaneous addition of 8.49ml of NaHS and 2 drops of Frother FZK245 for conditioning for 3minutes for the 2nd stage. After the 3 minutes conditioning time elapsed air valves were opened and collection of concentrate was done using the frother paddles for 10 seconds per 2 pours into con 2. The duration for the collection of concentrate for both stages added up to 17 minutes. The last stage involved the collection of the tails which were collected in con 3. These three stages were done for all the grinding times i.e. 4min, 6min, 8min, 10min, 12min, 14min, 16min, 18m and 20min. Figure 5 shows a sketch of cumulative flotation process and some of the parameters that were employed.
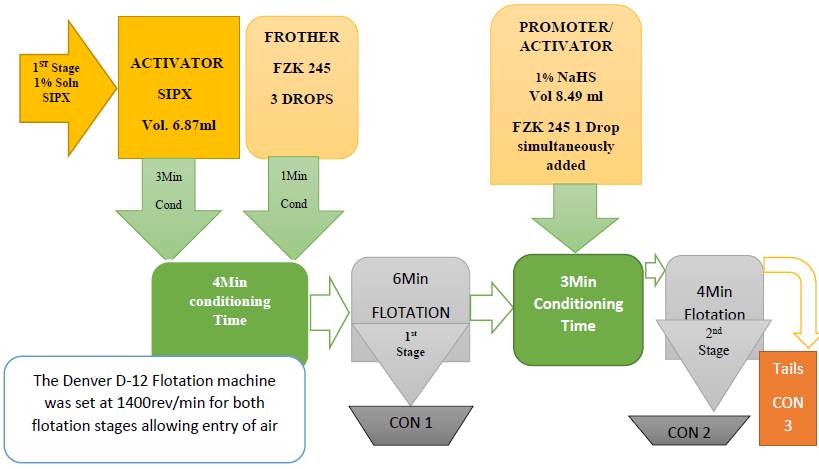 | Figure 5. Sketch of cumulative copper recoveries |
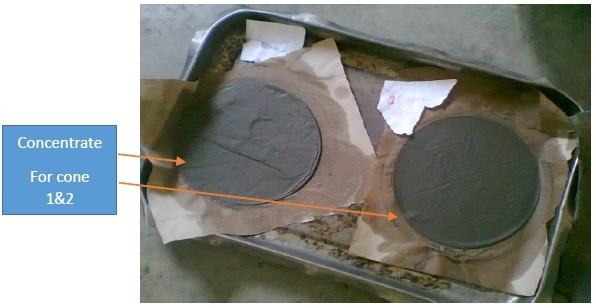 | Figure 6. Air filtered Concentrate cone 1 and cone 2 |
After complete drying, they were weighed on a scale, pulverised and finally packaged in labelled envelops and then later submitted to the analytical laboratory for the analysis of %Total Copper (%TCu) and %Acid Soluble Copper (%ASCu). Figure 7 shows tails after drying from the oven below 100°C.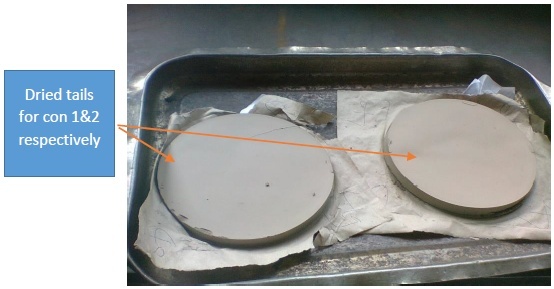 | Figure 7. Oven dried tails |
For the heads after filtration, drying and pulverising screen analysis was done using the 75microns only as follows:• 100 grams of dry head sample was washed on 75µ until the underflow was clear.• The oversize was then vacuum filtered.• After vacuum filtration the material was dried then followed by weighing it.• The weighed material was dry screened on a sieve shaker using a 75µ screen.• The sieving time was 10minutes initial, and then 5minutes until there was a difference of less than 0.10gram between the weighed oversize.• The percent passing was then calculated as  | (10) |
3. Results and Discussion
The chapter discusses and illustrates the results obtained from the experimental procedures that were undertaken. The graphs in this chapter show the results obtained in relation to the grind optimization of copper from its ore.
3.1. Grind Determination and Establishment Using PSD and Copper Deportment
Particle Size Distribution was used as a method for determining the liberation of the mineral values for different grinding times and the graphs plotted as shown in the figures.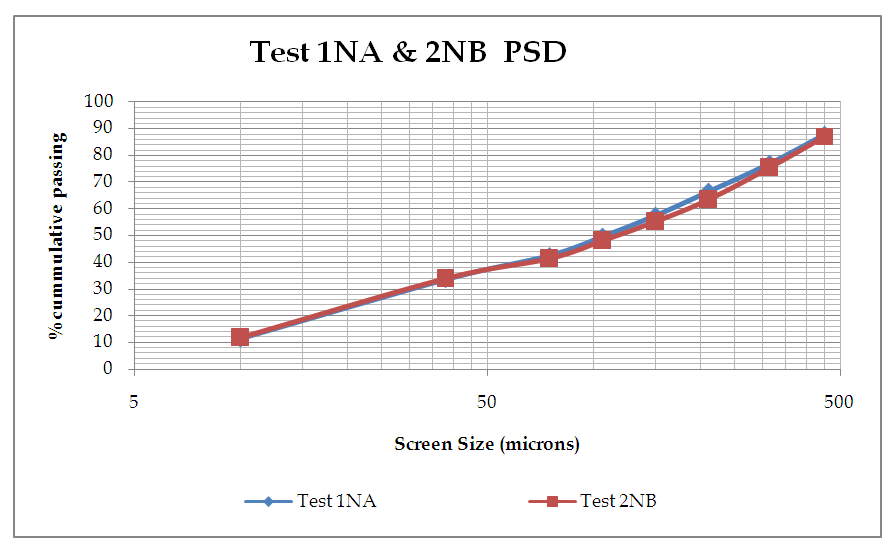 | Figure 8. Graph of % Cumulative against Screen size |
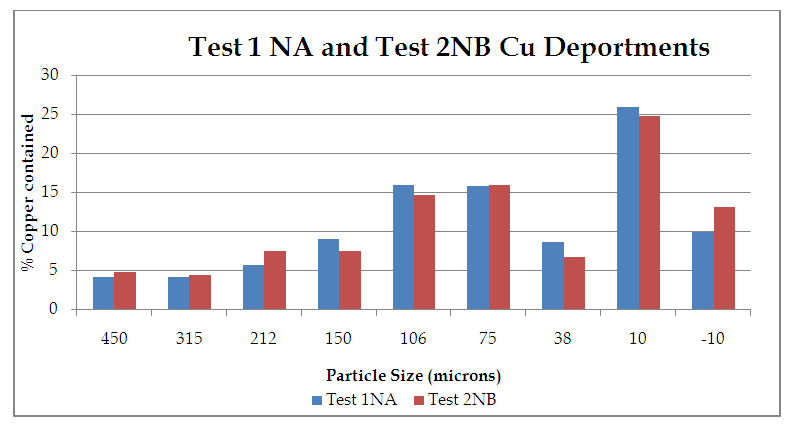 | Figure 9. %Copper contained vs Particle Size (microns) |
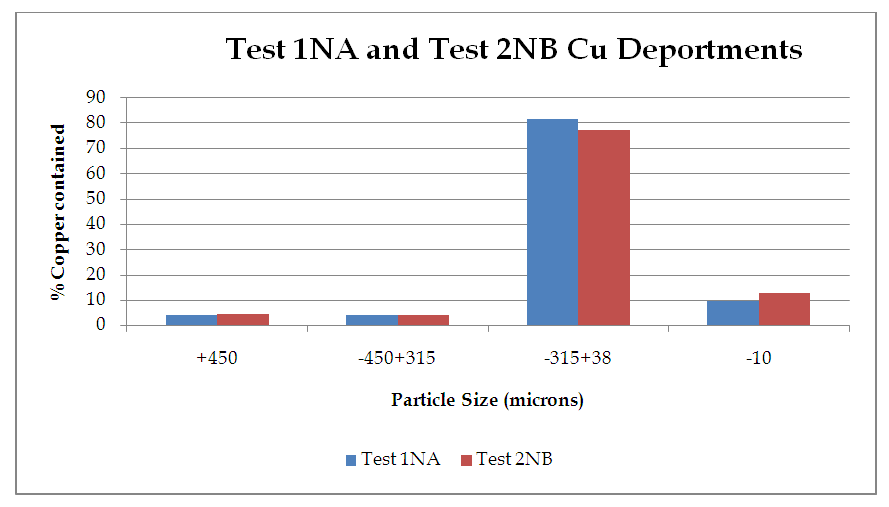 | Figure 10. %Copper contained vs Particle Size (microns) |
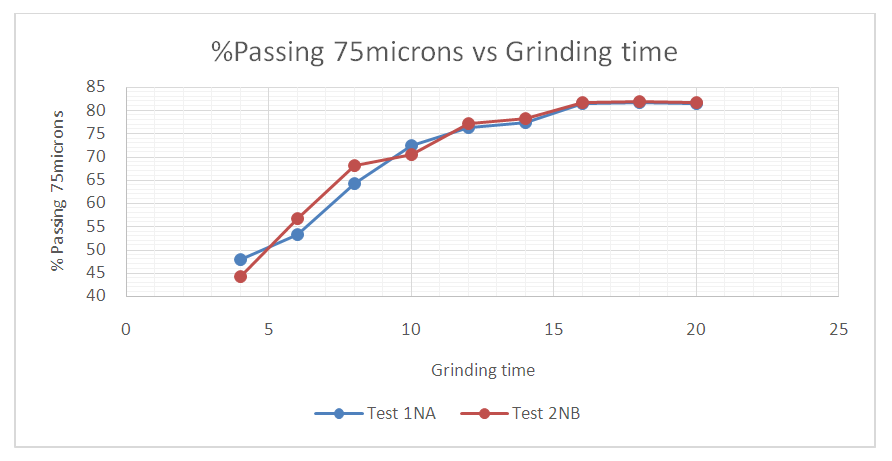 | Figure 11. % Cumulative passing 75 microns against the grinding time at 4, 6, 8, 10, 12, 14, 16, 18 and 20 minutes |
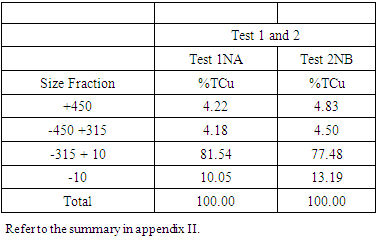
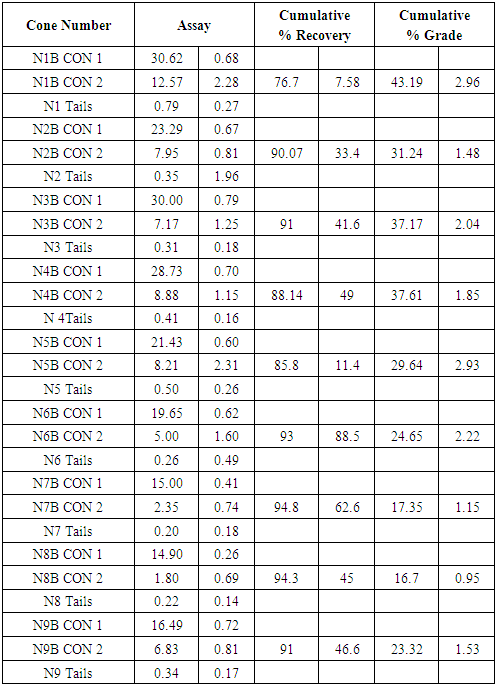
From figure 8, the P80 for Test 1 NA and Test 2 NB is in the range -315+38 microns where the 75microns sits. Which shows that for both Tests grinding within the range of these screens full liberation of Copper minerals is achieved and that when the fines increase some report to the -10microns, that is, 10.5 and 13.2 for Test 1 and Test 2 respectively. Furthermore, from the copper deportment graphs, both tests had higher copper valuables in the -10micron screen size representing the fines than the +450microns representing the coarse.This is an indication that shows that lower recovery in the coarse fraction is a result of copper surfaces not being exposed and as well as being interlocked in the gangue material which represents relatively poor liberation degrees that require an optimum grind (Runge 2014). This was observed mostly at 4, 6, 8, 10, 12 and 14 minutes grinding time. From 4 to 14 minutes the particles passing 75 microns are slightly coarse and hence few pass while the coarser ones are retained as shown in figure 11.Figure 9 and 10 also shows that the decrease in the copper recovery in the finer particles shown in the -10 microns’ screen size, could be attributed to coating of the fines onto the copper surfaces which leads to the minerals not having enough surface area for exposure to collectors. Hence this results in the copper values being entrained in the tails. Furthermore, since the particles do not possess enough kinetic energy even when there is vigorous agitation they eventually are drawn in to the tails which results in poor particle-bubble attachment which leads to low recoveries. More copper recoveries are noticed in the -315+38 microns for both Tests. Overall copper recovery by size showed losses in the minus 10µm and in the +450 µm screen which had the coarser size fractions which represented the minority of the difficult to float fractions. This was observed mostly at 16, 18 and 20 minutes grinding time. At grinding time of 16 minutes to 20 minutes most of the particles are fine and very few are retained as oversize at approximate average of 81.7% for both Test 1NA and Test 2NB as can be seen in figure 11 and table 2. This is a good indication of the liberation of mineral of interest which gives good concentration recoveries (Runge et al. 2013). At these times there is maximum liberation of the valuable mineral of interest in this case copper. The finer the grind size, the larger the surface area and thus more liberation of the mineral of interest from its gangue. Table 2. Copper deportment data for Tests 1NA and Test 2NB
 |
| |
|
3.2. Recovery
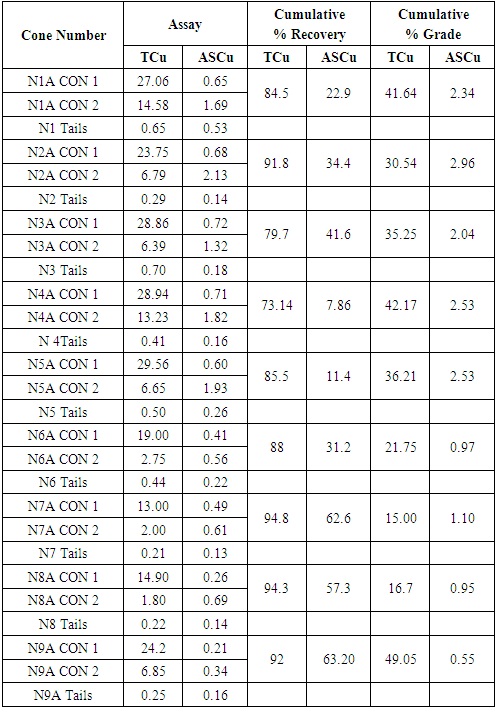
Flotation was carried out on two samples of the same composition labeled sample 1 NA for Test 1 NA and sample 2 NB for Test 2 NB at different grinding times done at 4, 6, 8, 10, 14, 16, 18 and 20 minutes. Plots of Cumulative Cu Recovery versus Flotation Time were made as shown in Figures 12. The results shown in figure 12 exhibits similar flotation responses and optimum recoveries observed for the two tests with no significant recovery step change. Furthermore, the results also show a steady increase in the copper recovery for both tests as the grinding time increases. Test 1NA and 2NB also show how results are reliable to each other since they are of the same sample, hence the closeness in their correlation. It can also be seen that, from 4 to 14 minutes grinding time the cumulative recoveries were low, this is due to the fact the time range was not sufficient for the reagents to interact with the mineral of interest and that the valuable mineral of interest could not be reached by the reagents because of it being interlocked by the gangue because it was not fully liberated at this grinding time. Therefore, only a small portion of the mineral was recovered. After 15 minutes the maximum recoveries were finally attained with optimum grinding times for the samples being 16,18 and 20 minutes with maximum average cumulative %recoveries being 94.6, 94.3 and 92 for both tests. From figure 13 the results indicate that as the % cumulative copper grade increases the grinding time decreases which indicates high recovery of the valuable copper minerals than the gangue (with interlocked copper minerals). Hence, at higher recoveries lower grades are expected as can be seen from figure 15.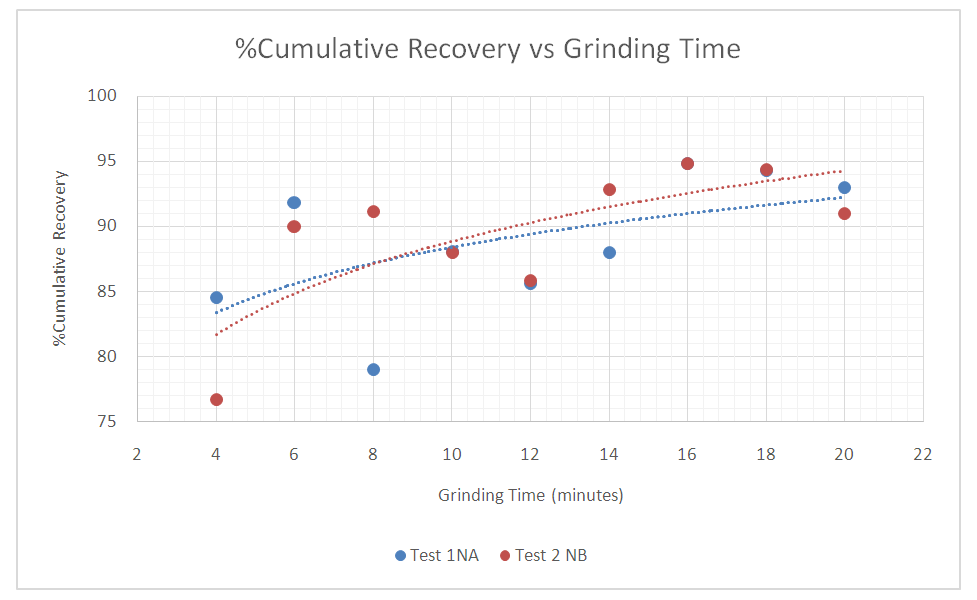 | Figure 12. Grind recovery response |
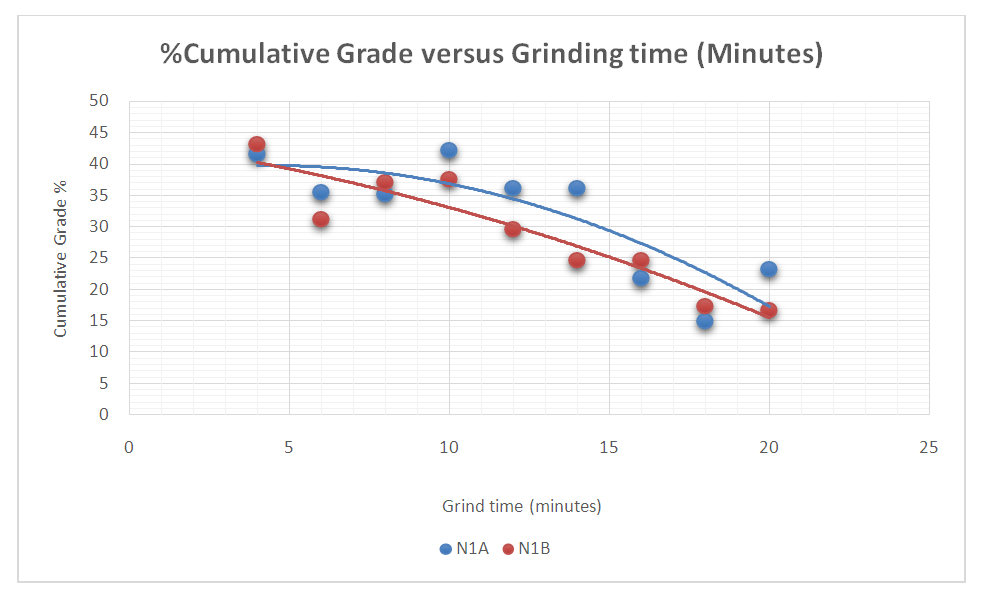 | Figure 13. % Cumulative Grade vs Grinding time |
3.3. Relationship between %Cumulative Recovery vs % Passing 75um
Another way for evaluating and determine the grind at which maximum flotation recovery was achieved is to plot the cumulative recoveries for the two tests against each grind represented by the percent passing 75microns as shown in figure 14.Figure 14 shows that the total recovery of copper cumulatively increases with respect to the material passing the 75microns, i.e. up 81.7% passing 75µm for both tests.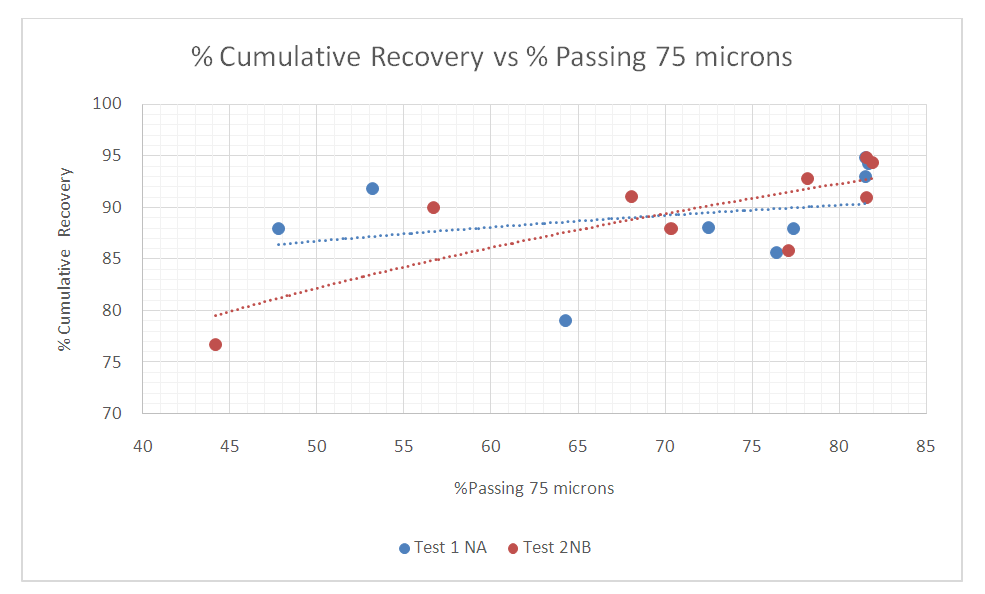 | Figure 14. Effect of grind on flotation performance |
3.4. Inverse Relationship between Recovery and Grade
Figure 15 shows the inverse relationship between Cumulative %Recoveries and % Grade. It can be seen that as the Cumulative %Recovery increases there is a decrease in the % Grade. The maximum average %Grades for the two test were 32.9, 39.9 and 42.4 at Cumulative %Recoveries of 85.7, 88.1, and 82.3 respectively for both tests. The two tests show that at poor recoveries there are higher grades and vice versa.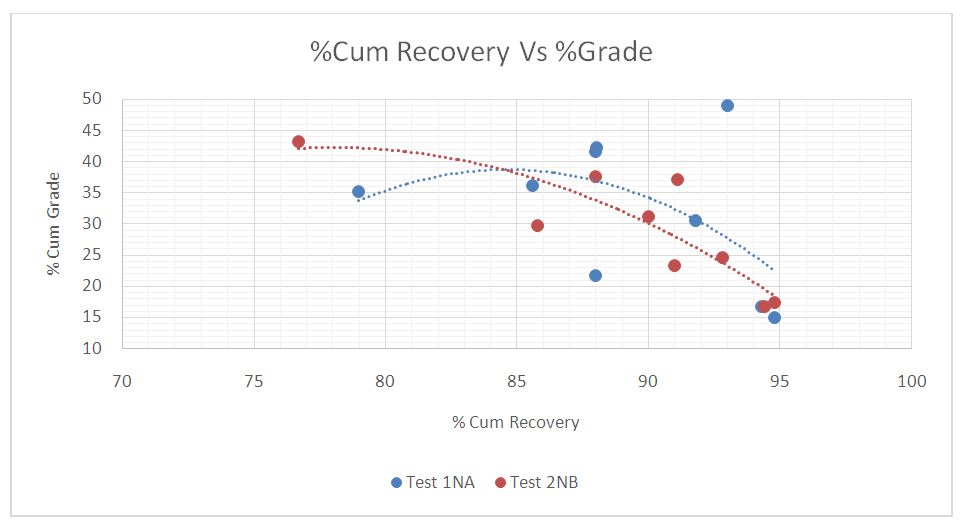 | Figure 15. The inverse Relationship between Cumulative %Recovery and % Grade |
4. Discussion and Limitations of the Research Work
The objective of this study was to investigate optimum grind of a blended copper ore comprising sulphide and oxide minerals with a view to achieving an optimal flotation performance. However, the research work was limited in many ways as most of other important parameters were not investigated. These parameters included the pulp density of the slurry which is very important as it determines the flotation kinetics; the pH of the slurry was also important to know as certain reagents such as collectors like xanthates which are highly selective do not work effectively in high or low pH levels. Furthermore, pH acts as a modifier and also helps to depress some insolubles such as pyrites (Goktepe 2002); Sufficient blending of the samples was a major requirement. Blending of the ore samples was not done using a machine such as a rotary splitter which is more robust and accurate than hand blending to producing representative samples. Therefore, with these limitations it would be suggested that in future, much more attention is given to the parameters under which the project is being carried out. Furthermore, in future such a project needs to look at the costs associated with power consumption in terms of grinding as grinding is an energy intensive process (Wills and Napier-Munn 2006).
5. Conclusions and Recommendations
ConclusionThe extraction of the copper concentrate from its ore were achieved by performing metallurgical process tests which included the use of machinery equipment’s and reagents by following the given parameters.The following conclusions can be drawn from this study taking into account the operating parameters employed with respect to SIPX collector, NaHS promotor or activator and FZK frother:• Optimum grinding times for the two tests samples were 16, 18 and 20 minutes which gave optimum cumulative % recoveries of 91.5, 93.9 and 94.6.• The maximum average %Grades for the two test were 32.9, 39.9 and 42.4 at Cumulative %Recoveries of 85.7, 88.1, and 82.3 respectively for both tests. • The optimum mesh of grind was achieved at 81.7% passing 75µm at which the average maximum Cumulative %Recovery of 94.6 was obtained.• From these results, it can be further concluded that, increasing the grind on the blended ore resulted in having fines which also increased the recovery of the valuable copper minerals (Hanumantha 2011). However, too much fines can lead to poor recoveries due to losses of the mineral valuables of interest to the tails (Wills 1998). Full liberation of the minerals is only attained at optimum grind whilst coarse grinding doesn’t fully liberate the minerals, hence poor recoveries in the subsequent flotation process are a result of either coarse grinding which give coarser heavy particles requiring high kinetic energy to float or due to very fine grinding which gives ultra-fine particles which are difficult to float.RecommendationsBased on the experimental results and from the analysis it can be recommended that other flotation parameters should be investigated which include:• Ratio for blending the samples from the stockpile which requires great supervision.• Pulp density.• pH of the slurry and as well as it being carefully examined during flotation process.• Examining the rate at which the flowrate of the air is introduced into the slurry after conditioning time as it is also a reagent necessary for successful froth flotation.• Mineralogical study of the tails.It can be further recommended from the results that using a 75microns screen size for optimization of the grind can improve the concentrate quality and recoveries at Konkola Copper West Concentrator.
ACKNOWLEDGEMENTS
I would first of all love to thank God for according and granting me an opportunity to learn and get an education from the University of Zambia as well as the opportunity I had to do my Industrial attachments and Project from Konkola Copper Mines West Concentrator. I thank the LORD for also giving me good and sound health during my attachment.I take this momentous opportunity to express my heartfelt gratitude and regards to my highly esteemed guide, Dr. H.J Masinja and Dr. E.Siame Lecturers, Department of Metallurgy and Mineral Processing, for giving me an opportunity to do this project under their supervision. The endless constant encouragement, support, commitment and exemplary guidance and supervision will always be highly valued.I would also like to express my profound gratitude and thanks to my love Joyce Bwalya for her constant support and encouragement throughout the time of my project.Deepest thanks also goes to the following people at Konkola Copper Mines for their wonderful assistance; Mr. Baldwin Matipa (Metallurgical Training Officer), Mr. Leonard Chomba (Senior Process Metallurgist), Mr. Victor Bukali ((Senior Process Metallurgist) and Mr. Henry Chilombo (Assistant Plant Manager) and following loving cooperative people at their respective work of places; Mr. Aaron Kalusa (plant), Mr. Chisheta Floyd (pump house), Mr. Chibuba Chileshe Moses (stockpile), Mr. Muntali Alwini (SAG mill & Ball mill), Mr. Mpundu Rodrick (Flotation cells), Mr. Nyibili John Francis (Tailings disposal Control room), Mr. Zulu Clement (Control Room for the plant stockpile to flotation), Mr. Mwape Steven (Larrox) and Mrs. McYvonne Simutenda Mwape (High Rate Thickener and Convectional Thickener).I extend my heart felt gratitude to my ever loving mum Vainness Lungu Ngwira for her constant care and love and my brother Mr. Abiton R Ngwira.
Appendices
Appendix 1.0: Miscellaneous Formulae and sample calculations(a) % Metal Recovery calculation at 6minutes flotation time and 14 minutes grinding time for Test 1 given,Ø c=21.75,Ø f=3.2 andØ t=0.26For Total Copper (TCu):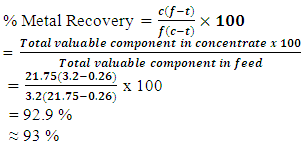 (b) % Metal Recovery calculation at 7minutes flotation time and 16minutes grinding time for Test 1 givenØ C=15Ø F=3.2Ø T=0.21For Total Copper (TCu):
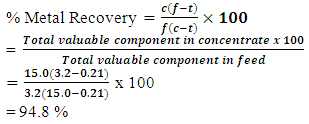 (c) % Metal Recovery calculation at 7minutes flotation time and 16 minutes grinding time for Test 1 givenØ f=0.29Ø t=0.13Ø c=1.10For Acid Soluble Copper (ASCu):
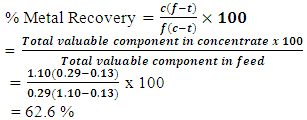 Appendix 2.0 Laboratory Flotation Results
Blended ore head grade from Laboratory analysis
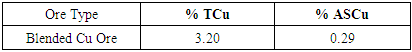 |
| |
|
Flotation test 1 results for NA
 |
| |
|
Flotation test 2 results for NB
 |
| |
|
 | PSD and Copper deportment for Test 1 NA and Test 2NB |
References
| [1] | Ayres, R.U., Ayres, L.W and Rade, I. 2002. The life cycle of copper, its co-products and by-products. Mining, Minerals and Sustainable Development. Available at: https://pubs.iied.org › pdfs. (Accessed 19/12/2016). |
| [2] | Bulut, G., Perek, K.T and Arslan, F. 2007. Metallurgy and Mineral processing. Recovery of metal values from copper slags by flotation and roasting with pyrite. Research gate publications. Available at: https://4m.cn/qQnUr. (Accessed 12/12/2016). |
| [3] | Crundwell, F.K., Preez du, N.B and Knights, D.B.H. 2020. Production of cobalt from Copper-Cobalt ores on the African Copperbelt-An overview. Journal of Minerals Engineering, Elsevier. London, United Kingdom. 1-16. |
| [4] | Davenport, W.G., King, M and Biswas, A.K. 2000. Extractive Metallurgy of Activated Minerals. Slovak Academy of Sciences. Elsevier Publications. |
| [5] | Deelder, J. W. 1991. Introduction to Metallurgy-Part II: Mineral processing and extractive Metallurgy. |
| [6] | Goktepe, F. (2002). Effect of pH on Pulp Potential and Sulphide Mineral Flotation. Turkish Journal of Engineering and Environmental Sciences, 26, 309–318. https://4m.cn/qBayh. (Accessed 10/09/2020). |
| [7] | Greenough, J.S. 1932. The Recovery of Copper in Sulphide Ores by Roasting, Leaching, and Electrolysis. Bachelors Theses and Reports, 1928 - 1970. Paper 21. |
| [8] | Gupta, A. 2006. Mineral processing technology: An introduction. (2006) Oxford: Elsevier. |
| [9] | Hanumantha. K, and Chernyshova.2011. Challenges in Sulphide Mineral Processing, The open Mineral Processing Journal, Volume 4, pages 3 – 4. |
| [10] | Konecna, R. 2012. Copper and Copper Alloys: Casting, Classification and Characteristic Microstructures. Aailabl at: https://4m.cn/zRKyA. (Accessed 11/05/2016). |
| [11] | Mulenga. 1993. Solution to Konkola Copper Mines Inflows Water problems. www.imwa.info › IMWA_1993_Mulenga_060-097. Chililabombwe, Zambia. |
| [12] | Pourret, O and Fuacon, M.P. 2016. Cobalt. Springer International Publishing. Available at: https://www.researchgate.net/publication/305302314_Cobalt. (Accessed 11/12/2016). |
| [13] | Runge, K.C, Tabosa, E and Jankovic, A. 2013. Particle Size Distribution Effects that Should be Considered when Performing Flotation Geometallurgical Testing, Brisbane, Australia. |
| [14] | Wills, B.A. 1998. Mineral processing technology, 4th Edition, Pergamon Press, Oxford, UK. |

 Abstract
 Reference
 Full-Text PDF
 Full-text HTML