-
Paper Information
- Next Paper
- Paper Submission
-
Journal Information
- About This Journal
- Editorial Board
- Current Issue
- Archive
- Author Guidelines
- Contact Us
International Journal of Metallurgical Engineering
p-ISSN: 2167-700X e-ISSN: 2167-7018
2015; 4(1): 6-11
doi:10.5923/j.ijmee.20150401.02
Effects of Ruthenium Addition on the Phases of 2101 Duplex Stainless Steel
 Abstract
 Reference
 Full-Text PDF
 Full-text HTML
O. A. Olaseinde1, 2, L. A. Cornish2, 3, 4, J. W. van der Merwe2, 3, 4
1Federal University of Technology of Akure, Akure, Nigeria
2African Material Science and Engineering Network (Carnegie – RISE Network)
3School of Chemical & Metallurgical Engineering, University of the Witwatersrand, RSA
4DST/NRF Centre of Excellence for Strong Materials, University of the Witwatersrand, RSA
Correspondence to: O. A. Olaseinde, Federal University of Technology of Akure, Akure, Nigeria.
| Email: |  |
Copyright © 2015 Scientific & Academic Publishing. All Rights Reserved.
The effects of ruthenium additions on the phases of 2101 duplex stainless steels were investigated. The samples were prepared metallographically, and electrochemically etched in NaOH, and then characterized using high resolution scanning electron microscopy, and spectroscopic analysis was done. The phase proportions of the alloys were calculated using Thermo-Calc with the TCFE5 and SSOL4 databases. Ruthenium contents between 0 and 10 wt% were calculated over a 600℃ - 1500℃ temperature range. The calculated and experimental phase proportions were compared, and good agreement was found. There was very little difference between the phase proportions calculated for the different Ru contents.
Keywords: Ruthenium, Duplex stainless steel, Thermo-Calc
Cite this paper: O. A. Olaseinde, L. A. Cornish, J. W. van der Merwe, Effects of Ruthenium Addition on the Phases of 2101 Duplex Stainless Steel, International Journal of Metallurgical Engineering, Vol. 4 No. 1, 2015, pp. 6-11. doi: 10.5923/j.ijmee.20150401.02.
Article Outline
1. Introduction
- Stainless steel is widely used in applications where good corrosion resistance, low maintenance, and low life-cycle costs are required. However, the price volatility of the high nickel content makes this grade of stainless steel prohibitively expensive. Outokumpu addressed this by introducing the lean duplex LDX 2101 stainless steel. Duplex stainless steels have dual phase structures, comprising austenite and ferrite. Several studies [1] show that LDX 2101 stainless steel has superior mechanical and corrosion-resistance properties than 304 austenitic stainless steel, but less than, or almost equal, properties to the 316 austenitic stainless steel. However, it possesses a poor strength-to-corrosion resistance capability compared to the 2205 Code Plus Two® and Outokumpu 2507 super duplex stainless steels [2]. Platinum group metals (PGMs) have been added to stainless steels to give better corrosion resistance properties in non-oxidizing media [3, 4]. The introduction of an active cathode into the alloy lowers the hydrogen over potential [5]. Also, addition of sufficient PGMs increases the ability of the alloy to passivate.This study investigates the effects of ruthenium additions on the phases and their proportions of LDX 2101 stainless steel using thermodynamic calculations. The calculated phase proportions of the LDX 2101 stainless steel were compared with the microstructure of as-received sample of the alloy. In order to identify suitable ranges of ruthenium additions, several calculations were made using different values of ruthenium. The results were then compared, and a suitable ruthenium addition was selected. The calculations were also used to identify the best heat treatment that would give a good duplex austenite/ferrite microstructure.
2. Experimental Procedure
- Samples of the lean duplex LDX 2101stainless steel were obtained from Outokumpu, and were subjected to standard spectroscopic chemical analysis. The samples were cut into samples of sides 1cm and hot mounted in bakelite. They were ground with silicon carbide papers from 320 down to 1000 grade, and polished with diamond paste until a mirror -like surface were achieved. The surfaces were electrochemically etched in NaOH solution that had been prepared by adding 40g of reagent grade NaOH to 100g of distilled water. 1-3 v dc was applied, with a platinum cathode for 5 – 60 s [6]. After etching, the samples were characterized using a high resolution scanning electron microscope (HR-SEM).Using the analysed values of the chemical compositions, the phase proportions of the alloys were calculated using Thermo-Calc software. Initially, the specialised steel TCFE5 database was used for the thermodynamic calculations of the phase proportions and phase compositions. However, to calculate the effects of the ruthenium additions, the SSOL4 database [7] had to be used because the steel database did not include ruthenium. SSOL4 is a more generalised database and often gives more reliable results out of the ranges of the specialised databases [8]. Calculations were made for different steel compositions where between 0 and 10 wt% Ru was substituted for Fe, and the compositions of all the other components were kept the same.
3. Results
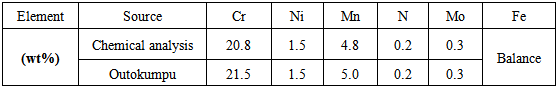
- The results from the spectroscopic chemical analysis are given together with the specifications from Outokumpu [9] in Table 1. It can be seen that the as-received sample was within the Outokumpu specifications.
|
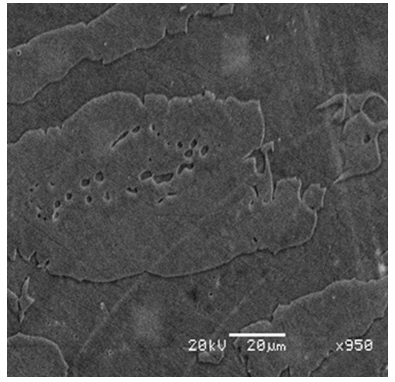 | Figure 1. SEM secondary electron image of 2101 LDX showing ferrite (dark) and austenite (light) after etching in 40g NaOH in 100ml distilled water |
|
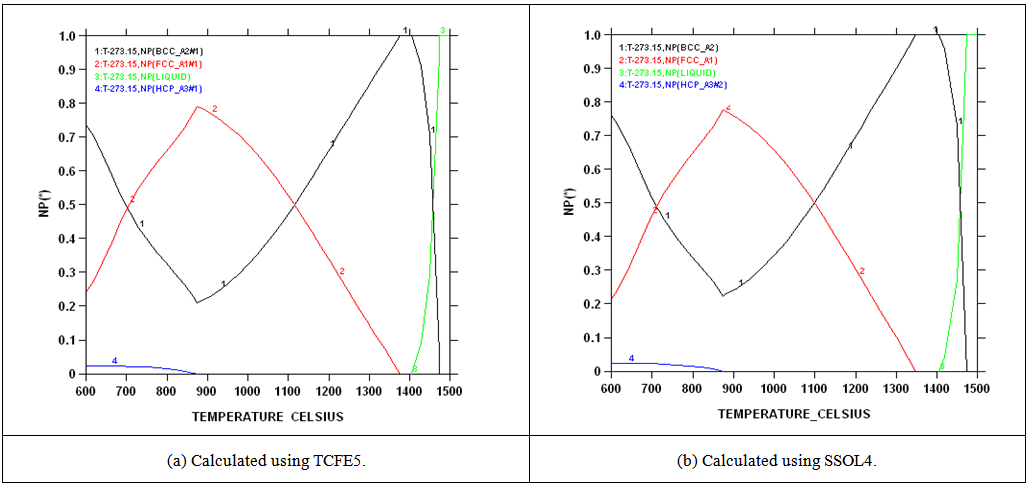 | Figure 2. Calculated phase proportions of as-received 2101 using Thermo-Calc with different databases |
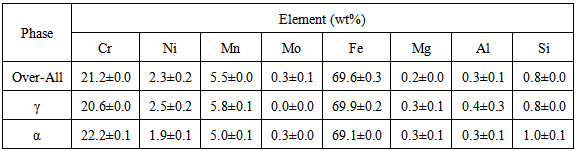
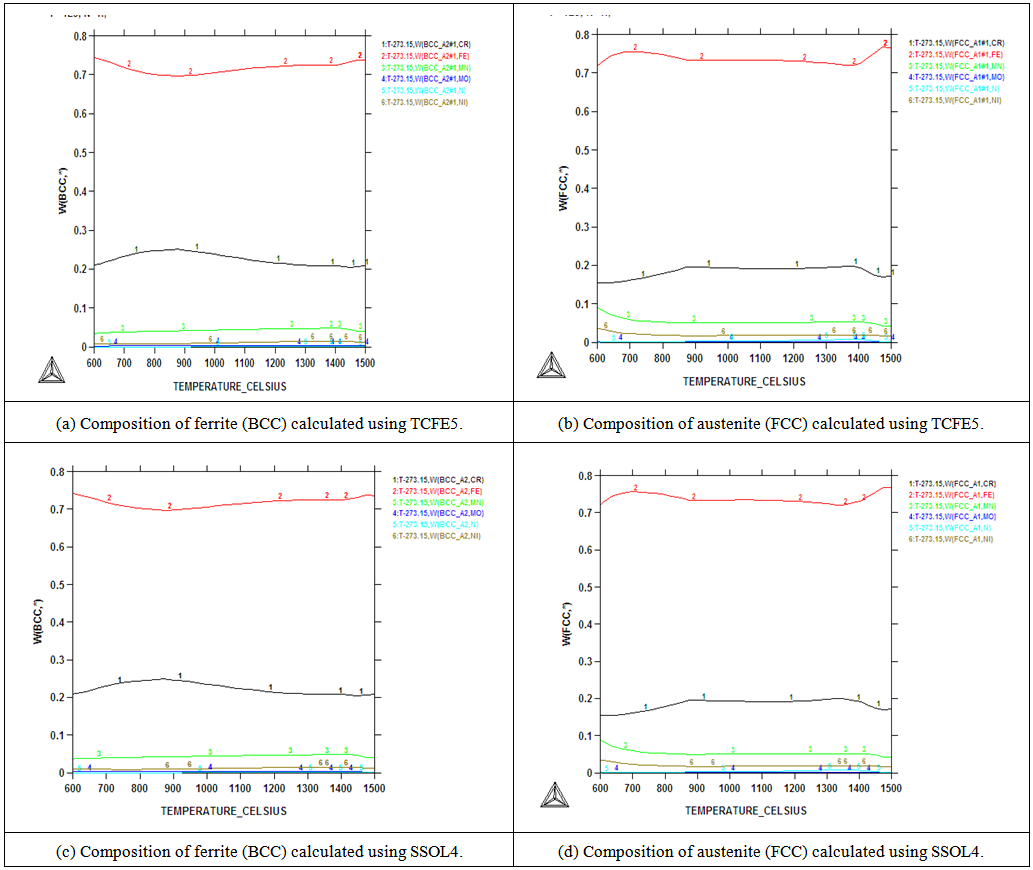 | Figure 3. Compositions of the ferrite and austenite phases calculated using the TCFE5 and SSOL databases |
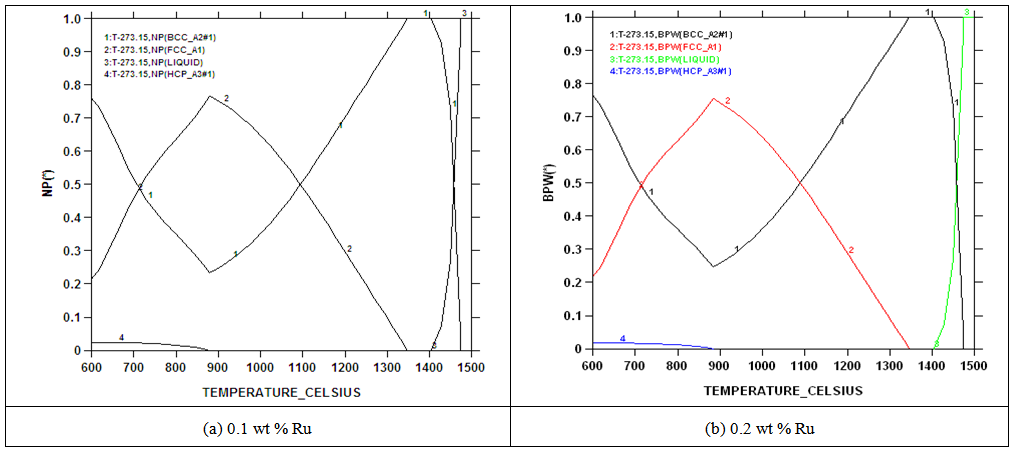 | Figure 4. Calculated phase proportions of 2101 with 0.1 and 0.2wt% Ru using SSOL4 databases |
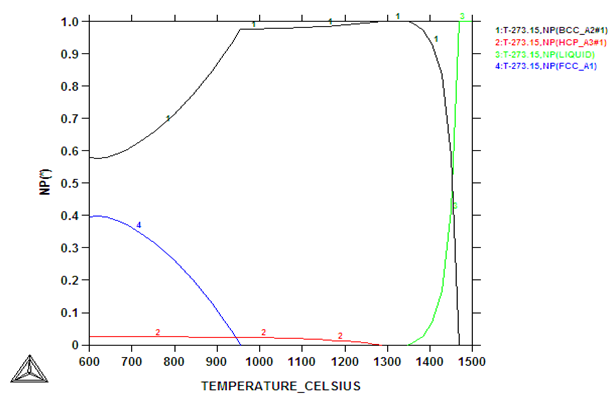 | Figure 5. Calculated phase proportions of as-received 2101 with 10 wt% using SSOL4 |
4. Discussion
- Chemical analysis of the as-received 2101 LDX alloy had similar compositions for all the elements, except that for all measured elements, the amounts were slightly less, although still in the correct proportions. After metallographic preparation, the as-received 2101 LDX had the expected ferrite-austenite microstructure, with discrete austenite within ferrite. As well as etching the ferrite phase dark and the austenite lighter, the NaOH is usually used to detect intermetallic phases in the ferrite, and none were found. However, when the trends of the phase analyses were compared with Zhang et al. [10], all were in agreement, this was true, even taking the errors into account. The Thermo-Calc results showed better agreement with Zhang et al. [10] rather than with the current EDX analyses, although the compositions are fairly close for both phases. The EDX values showed higher Ni content (~2.4 wt %) than either the Outokumpu specification [9] or the chemical analysis done on the same material. This is possibly an indication that the material was inhomogeneous. However, studying the elements present in small quantities, Al, Mn and Ni partitioned more to austenite than ferrite, while Si, Ca, Cr and Mo partitioned more to ferrite, which is in agreement with the results of Zhang et. al., [11] and Atamert and King [12]. Also Mg partitioned more out in the two phases.Using computer calculation of the phases and their compositions is an accepted way of shortening the alloy design process, although it is necessary to verify the results against actual experimental results. The results in Figure 2 were encouraging because they showed good agreement between calculations of the 2101 LDX compositions from the two different databases. This is important, because only SSOL4 could be used for calculations involving Ru additions. Ideally the specialised steels database, TCFE5, should have been employed for all the calculations, but since it does not contain ruthenium, the more generalised database had to be used. Calculations for the phases from same composition of duplex stainless steel showed that either database could be used (Figure 3). Thermo-Calc showed that heat treating the alloys between 1000-1200℃ would give a duplex structure for the alloys up to 0.2 wt% Ru.Due to the high expense of the ruthenium additions, only small amounts were planned, since improved corrosion resistance has been reported with minor additions [11-12]. However, when the very similar results for the low Ru compositions were calculated, there was concern that ruthenium was not being calculated properly. As a check, a higher Ru content was calculated (even outside the required amounts), and it was found that there was a significant difference, as shown in Figure 4. The targeted duplex structure was disrupted for calculations showing higher Ru additions. Since this calculation demonstrated that Ru was being calculated, more work was done on the planned lower compositions.Both the component phases over a temperature range and the varying compositions of those phases were calculated (Figure 5). There was very little effect on the component phase proportions and stabilities, and calculation of the phase compositions showed that the Ru was partitioning to both phases, almost equally (Figure 6). The likely reason why there is no noticeable shift in the calculated diagram is because ruthenium partitions to both FCC austenite and BCC ferrite phases thereby roughly balancing the Ru content in both phases. This should be advantageous for the corrosion results, since the ruthenium is balanced between both phases. If the Ru was partitioning to one phase rather than the other, this would mean that the phase with Ru would have better corrosion resistance than the phase without Ru, and so there would be a galvanic effect. Thus, the calculations show that from a partitioning consideration, Ru additions should be beneficial because the partitioning is about the same in each phase.
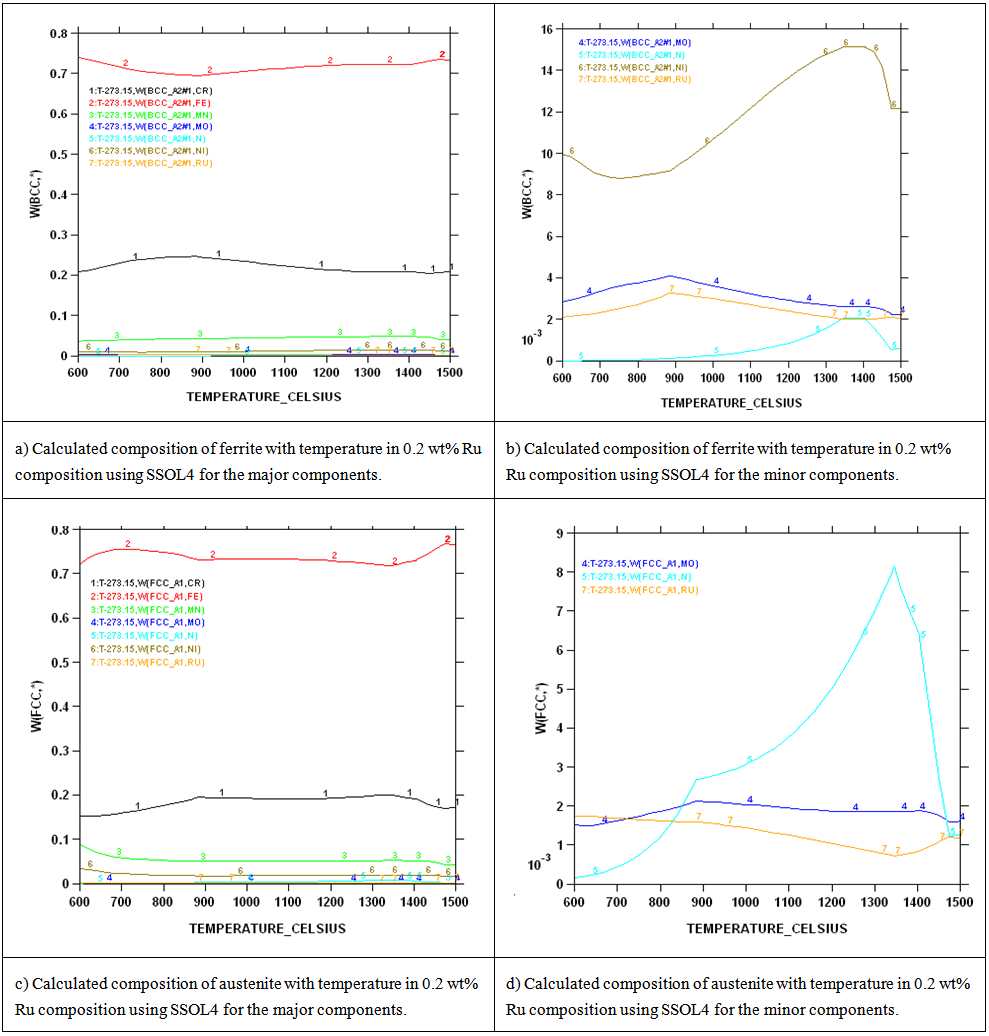 | Figure 6. Calculations of the compositions of ferrite and austenite with temperature for the 0.2 wt% Ru composition using SSOL4 |
5. Conclusions
- Predictions using Thermo-Calc have shown that small amounts of ruthenium can be added to duplex stainless steels without changing the structure, up to about 0.2 wt% Ru. Potential heat treatment temperature between 1020 and 1200℃ has been identified. The ruthenium partitions fairly equally between the ferrite and austenite which will be beneficial to the corrosion resistance of the steels since Ru will protect both phases.
ACKNOWLEDGEMENTS
- Anglo Platinum, South Africa for the ruthenium.This work is part of PhD work at the University of Witwatersrand, Johannesburg, South Africa.