-
Paper Information
- Next Paper
- Previous Paper
- Paper Submission
-
Journal Information
- About This Journal
- Editorial Board
- Current Issue
- Archive
- Author Guidelines
- Contact Us
International Journal of Metallurgical Engineering
p-ISSN: 2167-700X e-ISSN: 2167-7018
2013; 2(2): 130-136
doi:10.5923/j.ijmee.20130202.03
Investigation of Progress in Dynamic Recrystallization in Two Austenitic Stainless Steels Exhibiting Flow Softening
 Abstract
 Reference
 Full-Text PDF
 Full-text HTML
A. Sarkar, J. K. Chakravartty
Mechanical Metallurgy Division, Bhabha Atomic Research Centre, Mumbai, 400085, India
Correspondence to: J. K. Chakravartty, Mechanical Metallurgy Division, Bhabha Atomic Research Centre, Mumbai, 400085, India.
| Email: |  |
Copyright © 2012 Scientific & Academic Publishing. All Rights Reserved.
The hot working behaviour of two austenitic stainless steels: SS304 and Ti-modified 15Cr-15Ni-2Mo (Alloy D9) were studied by hot compression test at temperatures of 900–1200℃ and at strain rates of 0.002–1 s-1. The progress of dynamic recrystallization (DRX) was modelled by the Avarmi kinetics equation. The flow softening was directly related to the DRX volume fraction and the DRX time was determined by strain rate. For quantification of recrystallization rate, the time corresponding to the DRX fraction of 50% was used. Analysis of the sigmoid-shaped recrystallization curves revealed that the rate of DRX increases with increasing deformation temperature and strain rate. Avrami exponents obtained indicated heterogeneous grain or twin boundary nucleation during DRX of these steels. Results of the Avrami analysis were used to predict the DRX flow curves for different deformation conditions.
Keywords: Austenitic Stainless Steel, Hot Compression, Dynamic Recrystallization, Flow Curve, EBSD, Microstructure
Cite this paper: A. Sarkar, J. K. Chakravartty, Investigation of Progress in Dynamic Recrystallization in Two Austenitic Stainless Steels Exhibiting Flow Softening, International Journal of Metallurgical Engineering, Vol. 2 No. 2, 2013, pp. 130-136. doi: 10.5923/j.ijmee.20130202.03.
Article Outline
1. Introduction
- Hot working is one of the important steps in fabrication of structural components used in various engineering applications. Dynamic recovery (DRV) and dynamic recrystallization (DRX) are the primary restoration mechanism during high temperature deformation of metallic materials. Micro mechanism of hot deformation in fcc metals and alloys is in general governed by their stacking fault energy (SFE). In some materials with high SFE such as aluminium, DRV can balance work hardening, and a plateau is achieved in the stress strain curves. However, in materials with low SFE such as austenitic stainless steels, the kinetics of DRV is low, and DRX can be initiated at a critical condition of strain energy accumulation. DRX is associated with softening in the stress-strain curves. DRX plays an important role in controlling microstructure and mechanical properties in hot working of many metallic materials[1–3]. Due to the great impact of DRX on the high temperature flow stress and its effect on the microstructure and properties of the material after processing, the evaluation of the rate and progress of DRX in terms of deformation conditions is of utmost importance. The rate of DRX depends on the chemical composition of the material, the mode of deformation, and the deformation conditions.In the present work, the rate and the progress of DRX in two stainless steels namely SS304 and a Ti-modified 15Cr-15Ni-2Mo austenitic stainless steel (known as alloy D9) were studied during hot compression test.
2. Experimental Procedures
- Hot compression tests were conducted on solution-annealed (SA) SS304 and alloy D9 and specimens of 10-mm height and 5-mm diameter in a deformation dilatometer. The specimen was heated to the deformation temperature at a heating rate of 5℃/s and held there for 10 min. Single-hit hot compression tests were carried out at temperatures of 900-1200℃ with strain rates of 0.002–1 s-1 up to true strain of about 0.6.
3. Results and Discussions
3.1. Stress-strain Behavior
- Flow curves obtained at different temperatures and at a strain rate of 0.01 s-1 for SS304 and alloy D9 are shown in Figure 1 a and b respectively.
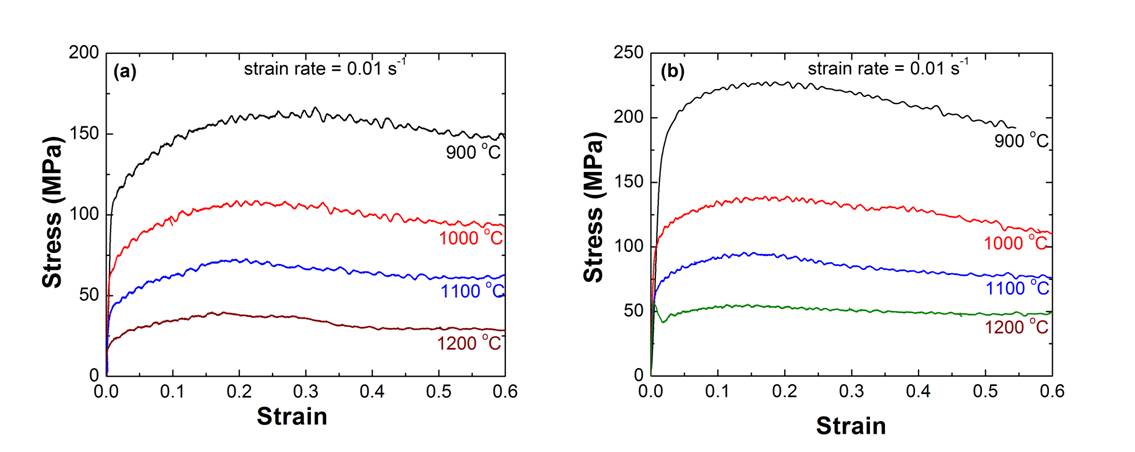 | Figure 1. Stress-strain curves for (a) SS304 and (b) alloy D9 deformed at a strain rate of 0.01 s-1 at different temperatures |
3.2. Deformation Microstructure
- The hot-deformed samples were cut along the longitudinal direction using a precision cut-off machine. One half of the sample was taken to prepare specimens for electron backscattered diffraction (EBSD) investigation. The microstructures were examined in the maximum deformation zone of the specimens. EBSD scans were performed on all processed samples using a TSL-Orientation Imaging Microscopy (OIM) system attached to an FEI Quanta 200 scanning electron microscope (FEI, Eindhoven, Netherlands) operating at 30 kV. Samples for EBSD were polished up to 0.25-lm grit diamond paste using the standard metallographic polishing procedure. Finally samples were electro polished to ensure removal of any residual surface deformation. EBSD maps were collected from the processed samples using a step size of 0.5
 using a hexagonal grid. Fig 2 shows the microstructure of the starting SS304 material.
 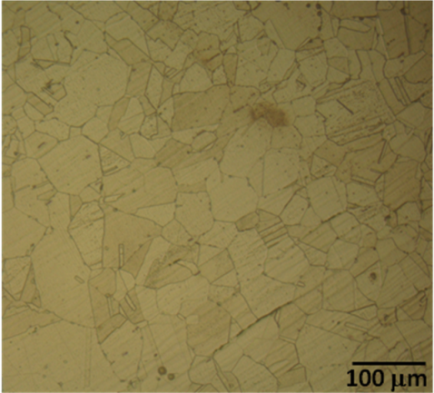 | Figure 2. Optical microstructure of the starting annealed SS304 sample |
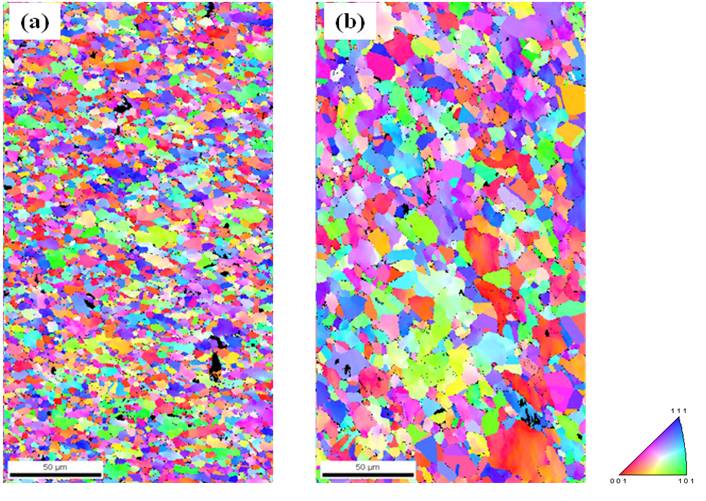 | Figure 3. EBSD images of deformed SS304 samples at strain rate of 0.01 s-1(a) 900℃ (b) 1000℃ |
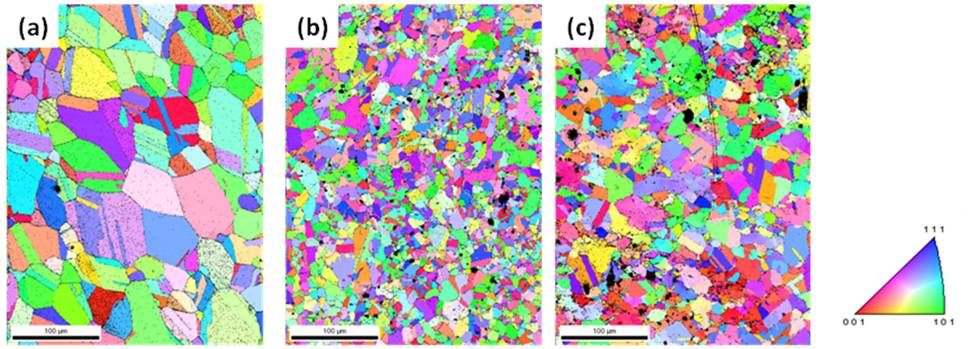 | Figure 4. EBSD images of (a) starting solution annealed alloy D9 and samples deformed at strain rate of 0.01 s-1 at (b) 1000℃ (c) 1100℃ |
 ) along with large fraction of twin boundaries (Figure 2 and 4a). It is seen from the Figure 3a and 3b and 4 b and 4c that the initial structure is completely modified and the deformed microstructures consist of fine uniform grains. This is the typical characteristics of DRX. This type of microstructure modification and occurrence DRX during hot compression of steels has also been reported by Mandal et al.[4-7].
3.3. Avrami Analysis of Flow Curves
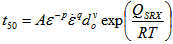
- Avrami relation[8-10] is a popular approach to study how solids transform from one phase (state of matter) to another at a constant temperature. It can specifically describe the kinetics of a phenomena which is governed by nucleation and growth processes. It is generally accepted that the progress in DRX also follows Avrami equation. However, the study of DRX in terms of Avrami equation is not straight forward. Various computational methodologies have been proposed to predict DRX and microstructure evolution such as Vertex models[11], Potts-type Monte Carlo[12], phase field models[13] and cellular automata[14]. Results obtained from these simulation studies provided a reasonable understanding of the DRX kinetics. However, it is always advantageous to investigate the evolution of DRX from experimental flow behaviour. Recently Jonas et al.[15] has developed a novel formalism to investigate the Avrami kinetics of DRX. They analyzed various flow curves of different steels using their method. Here in this study we apply the formalism of Jonas et al. to investigate the DRX kinetics of alloy D9. In this approach, an experimental flow curve is considered to be the net result of the simultaneous operation of dynamic recovery and DRX. This has been illustrated by schematic curves in Fig 5. It explains the difference between the features of flow curves obtained during operation of dynamic recovery and DRX. DRX curve is obtained experimentally by carrying out compression tests at different strain rates and temperatures. However, the recovery curve (σDRV) which is regarded as resulting from dynamic recovery alone is not available directly from the experiment. The recovery curve is assumed to represent the work hardening behavior of the unrecrystallized region. Now it is well known that during the deformation, DRX initiates after a certain critical stress (σc). The work hardening behavior of the recovery curve is same as that of the experimental curve prior to the critical strain (εc), where εc is strain corresponding to σc. The recovery curve finally reaches saturation (σsat) when there is a balance between the generation and annihilation rate of dislocation.
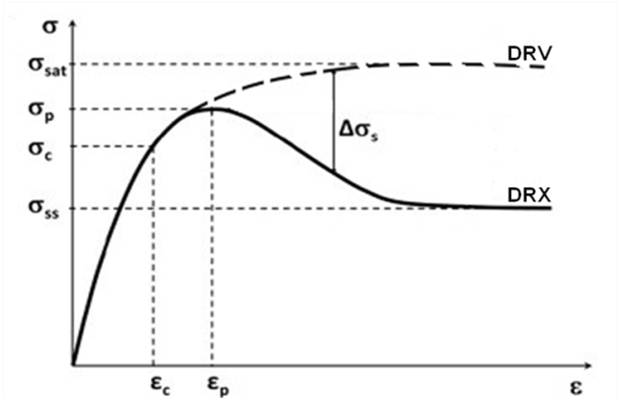 | Figure 5. Schematic representation of flow curves during dynamic recovery and dynamic recrystallization defining various stress and strain parameters involved in Avrami analysis |
 | (1) |
 | (2) |
 | (3) |
 is the net softening and is directly attributed to DRX. The maximum value of
  is (σsat - σss), where σss is the steady state stress under DRX conditions.. The evolution fractional softening with strain is expressed as X=
  /(σsat - σss). Once the recovery curve is derived for a particular deformation condition the evolution
  with
with  can be obtained in a straightforward way. The Avrami equation describing the SRX is expressed as:
 | (4) |
 | (5) |
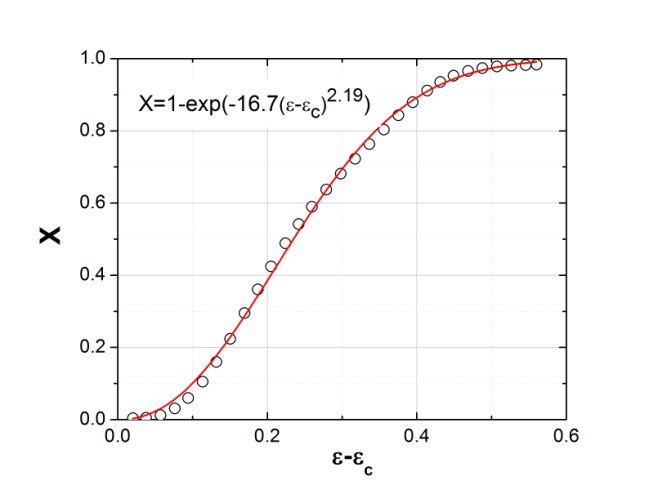
 are derived for different deformation conditions. Figure 7 shows typical Avrami plots for SS304 deformed at 1200℃ at a strain rate of 0.1 s-1. Figure 8 shows the Avrami plots for alloy D9 samples deformed at strain rate of 0.002 s-1 at temperatures 900℃, 1000℃ and 1100℃.The Avarmi time exponents (n) obtained from the slope of the curves are shown in the figures. It can be seen that the values of n lie between 1.35-2.12 and increases with decreasing temperature. The low value (~1) of n indicates heterogeneous site saturated nucleation of recrystallized grains. On the contrary n ~3, correlates with ideal Avrami recrystallization for homogeneous, constant rate nucleation[18]. The n values obtained in this study (1<n<3) signify that prior grain boundaries or twin edges are the nucleation cites for DRX in alloy D9. It is worth mentioning here that the detailed EBSD studies on the DRX behaviour of this steel by Mandal et al.[4-7] indicated heterogeneous nucleation at grain boundaries and formation of necklace structure. EBSD investigation also confirmed that twins play an important role during nucleation and subsequent expansion of the DRX process in alloy D9[5].
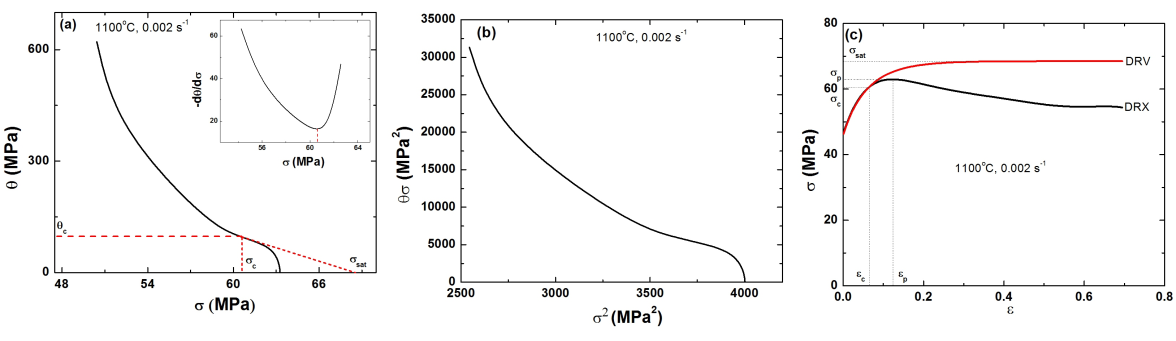 | Figure 6. (a)  vs. σ plot, (b) vs. σ plot, (b)  .σ vs. σ2 plot and (c) reconstructed dynamic recovery (DRV) curve plotted along with the experimental dynamic recrystallization (DRX) curve for alloy D9 deformed at 1100°C, 0.002 s-1 .σ vs. σ2 plot and (c) reconstructed dynamic recovery (DRV) curve plotted along with the experimental dynamic recrystallization (DRX) curve for alloy D9 deformed at 1100°C, 0.002 s-1 |
 | Figure 7. Variation of fraction recrystallization w.r.t.  for SS304 deformed at 1200℃ at a strain rate of 0.1 s-1 for SS304 deformed at 1200℃ at a strain rate of 0.1 s-1 |
 | Figure 8. Variation of fraction recrystallization (X) w.r.t.  for alloy D9 at different deformation conditions for alloy D9 at different deformation conditions |
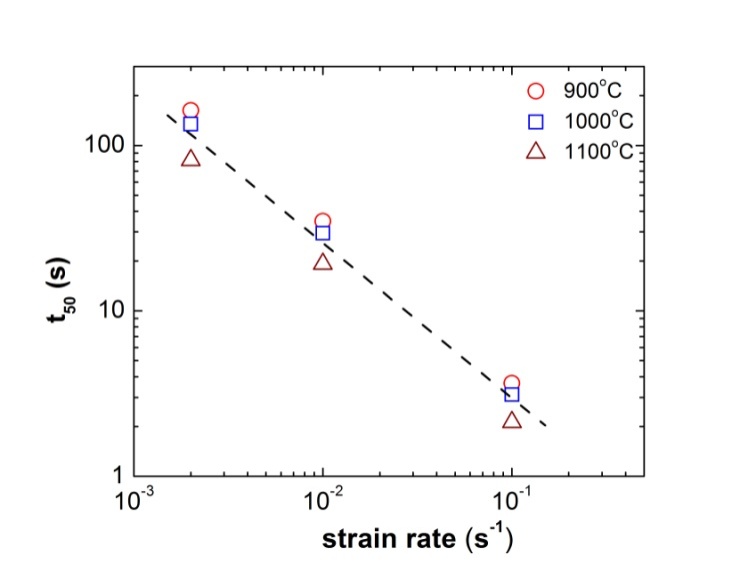 | Figure 9. Dependence of the characteristic time (t50) on strain rate  for alloy D9 for alloy D9 |
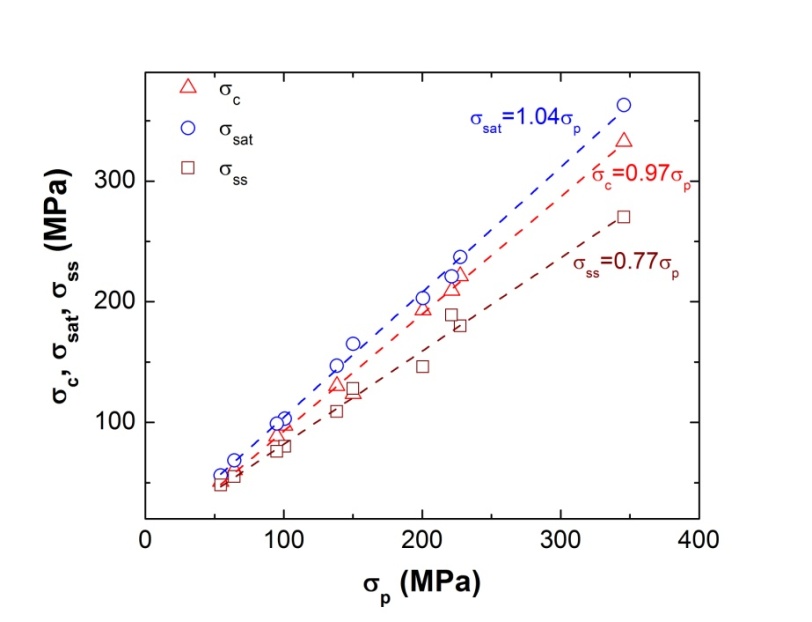 | Figure 10. Plots showing the variation of critical stress (σc) and steady state stress for dynamic recovery (σsat) and steady state stress for dynamic recrystallization (σss) with peak stress (σp) for alloy D9 |
 | (6) |
 is a constant (taken as equal to 1)[15,25] and
  the shear modulus (81 GPa)[26] and b is the magnitude of Burgers vector (0.258 nm for alloy D9). Figure 11 shows the dependence of r and h on σp for alloy D9.
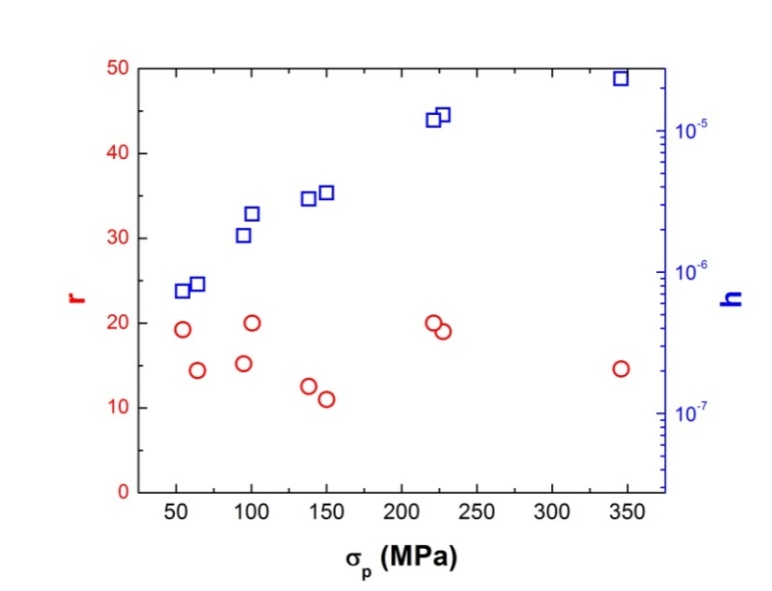 | Figure 11. Dependence of the dynamic recovery coefficient r and the athermal work-hardening parameter h on σp for alloy D9 |
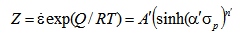 | (7) |
 are constants derived from the nonlinear fit of the experimental data. Figure 12 shows the fit of Eqn. (7) to the experimental data. The best fit gives the values:
  = 4.010,
  = 0.0078, Q= 284 kJ/mol and
  = 5.43.The constants thus evaluated can be utilized to determine σp for alloy D9 at desired T and using Eqn. (7). Once the dependences of r, h and the other parameters on σp is established and the constants in Eqn. (7) are determined, it is possible to construct the DRV curve and subsequently the DRX curve for the desired deformation conditions of industrial processing. The predicted and the experimental DRX curve for different deformation conditions are shown in Figure 13.
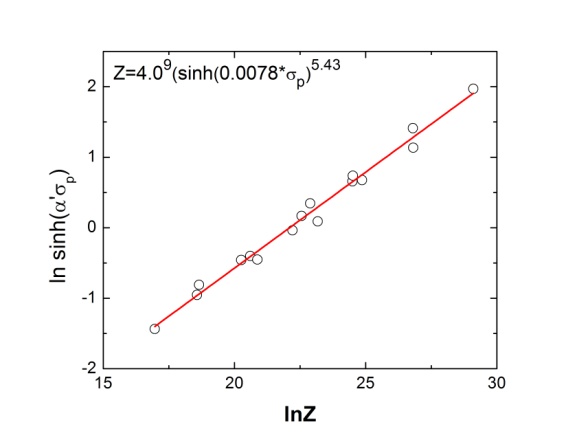 | Figure 12. Plot of vs. lnZ |
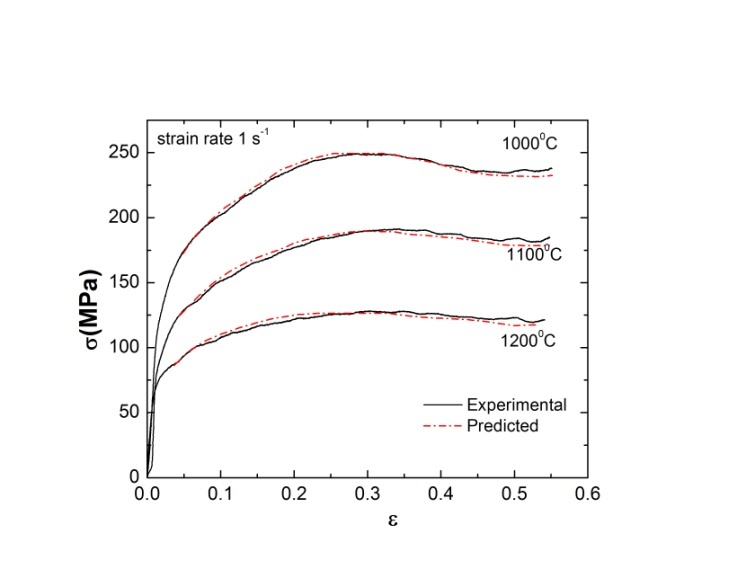 | Figure 13. Predicted and experimental stress-strain curves for strain rate 1 s-1 at different temperatures for alloy D9 |
4. Conclusions
- The DRX behavior of SS304 and Ti-modified austenitic stainless steel (alloy D9) are investigated under different deformation conditions through hot compression tests. The results of these tests are summarized as follows: 1. The stress–strain curves of SS304 and alloy D9 exhibited typical DRX behaviour with a single peak stress followed by a gradual fall towards a steady-state stress. At high temperature and low strain rate multiple oscillations were observed in the stress-strain curve. 2. The progress of DRX in the steels during hot deformation can be well predicted on the basis of the Avrami relation in conjunction with features of the flow curve and work hardening data. 3. The rate of DRX increases with deformation temperature. By increasing the deformation temperature, the recrystallization curve shifts to lower strains and recrystallization times.4. The values of the Avrami exponent for different conditions (1<n<3) signify that prior grain boundaries or twin edges are the nucleation cites for DRX in these steels.5. Flow curves for alloy D9 during hot working can be predicted well based on the analysis. These results will be useful to design the hot-forging/extrusion/rolling processes for alloy D9.