-
Paper Information
- Next Paper
- Previous Paper
- Paper Submission
-
Journal Information
- About This Journal
- Editorial Board
- Current Issue
- Archive
- Author Guidelines
- Contact Us
International Journal of Metallurgical Engineering
p-ISSN: 2167-700X e-ISSN: 2167-7018
2013; 2(2): 125-129
doi:10.5923/j.ijmee.20130202.02
Modelling Grain Size Distributions during TMCR of Nb-microalloyed Steels
 Abstract
 Reference
 Full-Text PDF
 Full-text HTML
M. Strangwood, C. L. Davis
School of Metallurgy and Materials, The University of Birmingham, Birmingham, B15 2TT, UK
Correspondence to: M. Strangwood, School of Metallurgy and Materials, The University of Birmingham, Birmingham, B15 2TT, UK.
| Email: |  |
Copyright © 2012 Scientific & Academic Publishing. All Rights Reserved.
Models for recrystallisation and precipitation during hot deformation of HSLA steels, based on the original Dutta–Sellars approach, show good agreement with experimental data for compositions around 0.04 wt% Nb, strains around 0.3 and prior austenite grain sizes up to 600 µm. The experimentally determined recrystallisation start and finish temperatures have been compared with predictions made with the original and a modified Dutta-Sellars model for homogenised and segregated samples. These modifications include the use of Thermo-Calc to predict the solute Nb content and prior austenite grain size distributions, rather than an average prior austenite grain size, which have been shown to give consistently better predictions using literature data. The application of a Clyne-Kurz model has accounted for the amounts of solute-rich and solute-depleted material for steels with compositions solidifying through the peritectic transformation.
Keywords: Microalloyed Steels, Segregation, Recrystallisation, Hot Rolling
Cite this paper: M. Strangwood, C. L. Davis, Modelling Grain Size Distributions during TMCR of Nb-microalloyed Steels, International Journal of Metallurgical Engineering, Vol. 2 No. 2, 2013, pp. 125-129. doi: 10.5923/j.ijmee.20130202.02.
Article Outline
1. Introduction
- The combination of high strength and good toughness for high strength low alloy (HSLA) steels is achieved through the generation of fine ferrite grain sizes through application of controlled thermo-mechanical processing (TMP) schedules[1]. Steel grades amenable to this treatment will contain small amounts of some or all of Al, Ti, V, Mo and, especially, Nb in combination with C and N[2]. For a hot deformed and recrystallised (fully or partially) HSLA steel, the strength level is largely determined by the mode or average grain size (through the Hall-Petch relationship); toughness, however, is much more dependent on the population of larger grains in the grain size distribution. The grain size distributions are usually characterised as a log-normal distribution for full recrystallisation with the maximum grain size being 2 – 3 times that of the mean / mode[3]. This is a notable effect for unimodal grain size distributions, but bimodal grain size distributions the mixture of coarse and fine grains (banded or in patches) results in increased scatter in toughness values, although the strength levels are similar[4].Niobium is the most potent microalloying addition for austenite grain size control through both solute drag and strain-induced precipitation (SIP) effects. During solidification, however, niobium shows a strong tendency to segregate into the liquid phase and its low diffusivity in austenite means that it will remain segregated through most of the TMP schedule resulting in spatial variations in the degree of retardation of recrystallisation. In order to avoid low or scattered toughness values, then the grain size distribution during hot deformation needs to be controlled. In selecting TMP schedules then one on the more widely used predictive schemes is that of Dutta and Sellars (DS)[5]. The following equations are used to predict static recrystallisation and precipitation start time according to 5 % recrystallisation (Rs) and 5 % precipitation (Ps) based on classical nucleation theory.

 where[Nb] is the amount of Nb in solution in austenite; ε is applied strain; T (K) is the deformation temperature; ks is the supersaturation ratio; D0 is the austenite grain size at the start of deformation; and Z is Zener-Holloman parameter.This model was developed from experimental data based on deformation testing of steels with Nb contents between 0.03 - 0.045 wt %, starting prior austenite grain sizes of 100 – 450 μm and using a strain of 0.3[5]. However, unimodal grain sizes are assumed along with a uniform Nb concentration. Earlier studies on a 0.46 wt % Nb steel that had been homogenised for 4 days at 1225°C[6] showed that the DS equations using the parameters above overestimated the proportion of recrystallisation for a 10 s hold after 0.3 strain. The agreement, however, improved when grain size classes were used rather than just the average grain size.The generality of this approach to dealing with grain size distributions and how chemical heterogeneities are dealt with is the subject of this paper.
 2. Materials and Experimental Procedure
- The material used in this work was a 290 mm thick continuously cast slab of composition: 0.10 C, 1.51 Mn, 0.32 Si, 0.017 P, 0.005 S, 0.046 Nb, 0.002 Ti, 0.006 V, 0.045 Al and 0.008 N; all wt %. Specimens of size 10 x 15 x 20 mm (machined from the ¼ thickness position of the slab) from the slab were tested in the as-cast state and after being homogenised at 1225 ºC for 4 days under vacuum and slowly cooled at a rate of 3 ºC/min to remove the Nb segregation. The details of selection of homogenisation temperature and time have been discussed elsewhere[7]. The homogenised and segregated specimens were sealed inside silica tubing under a partial Ar atmosphere and reheated to 1150 or 1225°C, soaked for 1 hour and then quenched (tube intact) into water to represent a commercial reheating temperature and time (to dissolve Nb-rich precipitates); quenching was used to preserve the Nb in solution prior to deformation trials. Thermo-Calc software (version Q) was used to determine the equilbrium Nb content in solution at 1150 / 1225ºC in the homogenised condition. The reheated specimens were subjected to plane strain compressive deformation in a Gleeble 3500 over a range of temperatures (975°C to 1075°C) and 0.3 strain being held at the chosen deformation temperatures for a range of times (4 to 10 s) at a strain rate of 10 s-1 after solutionising at 1150 or 1225°C for 5 minutes. Samples after reheating and Gleeble simulation were sectioned along their mid-thickness (normal to the compression axis) and mounted in Bakelite. The samples were metallographically polished to a 0.05
 SiO2 finish and etched in saturated aqueous picric acid solution at 60ºC to reveal the prior austenite grain structures. The heat-treated and deformed specimens were examined in a Leica DMRX microscope equipped with KS300 image analysis software. Quantitative determination of austenite grain size in terms of equivalent circle diameter (ECD) was carried out measuring about 1500 grains in terms of individual grain area and ECD (obtained directly from the KS300 software) to determine grain size distributions as an area fraction against size.
 3. Results and Discussion
- For homogenised material single hit Gleeble tests showed that the fully recrystallised grains showed a distribution that could not be modelled using equation of the type:
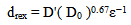 where drex is the average recrystallised grain size, D0 the average starting austenite grain size and D’ a constant with values quoted between 0.66 and 1.86. Inspection of the prior austenite grain size distributions for reheated(un-recrystallised) and fully recrystallised samples, Figures 1 and 2, shows that a good fit could be achieved by merely halving the original grain size on recrystallisation. This amounts to limiting recrystallisation to the formation of two recrystallised grains per deformed austenite grain on average and so may limit this approach to a certain range of starting austenite grains.
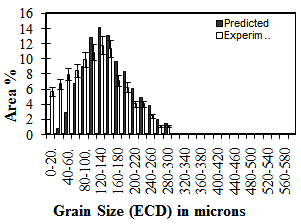
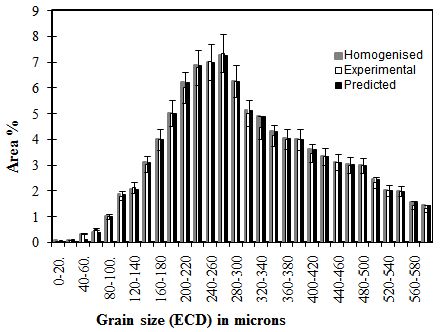 | Figure 1. Prior austenite grain size distribution for re-heated, homogenised sample |
 | Figure 2. Prior austenite grain size distributions (predicted and measured) for a fully recrystallised, homogenised sample |
 , which corresponds to a cooling rate of 0.182 K s-1. Microsegregation in this system was modelled using a Clyne-Kurz[9] approach. This is based on mass balance and back diffusion of carbon during solidification of the steel to give a solidified fraction, fs , as a function of temperature, T:
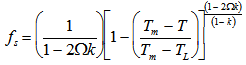 where Tm is the melting temperature of pure iron, TL is the alloy liquidus temperature, k is the equilibrium partition coefficient and
  is the solidification factor given by
 where
where  is a function of the secondary dendrite arm spacing (SDAS),
  , local solidification time, tf, and solute diffusivity in the solid phase, Ds:
 The assumptions made are that the first appearance of austenite via the peritectic transformation would form a low-diffusivity layer that would prevent further atomic migration between the dendrite and the interdendritic liquid. On this basis, the solute-depleted fraction would be the integrated fraction solidified by the start of the peritectic transformation; the dominant role of [C] on this transformation meant that the equilibrium value for the peritectic start temperature as predicted from Thermo-Calc was used to define the undercooling temperature range over which the dendrites solidified. Carbon diffusion in ferrite was also used for determination of Ds.The fractions of solute-rich and solute-depleted determined this way deviated from the equilibrium values at the peritectic start temperature, but Thermo-Calc was used to establish the mass balance between delta-ferrite and liquid that would give these volume fractions (noting that the segregation profiles determined experimentally were top-hat functions). This method gives reasonable agreement between prediction and experiment, Table 2, and has been extended to steels with 0.04 – 0.1 wt % C and 0.019 – 0.094 wt % Nb, all of which involved the peritectic transfiormation during their solidification sequences.The results shown in Table 2 show reasonable agreement with optical and scanning electron microscopy determination of the solute-rich and solute-depleted fractions, although differences of up to 6 % are observed. These differences may become significant when modelling a commercial multi-pass hot rolling schedule and cross-diffusion effects are being investigated using EDS mapping techniques in order to improve the fit between model and experiment.
|
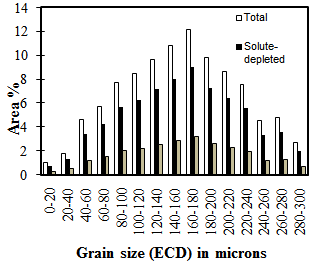 | Figure 3. Separation of grain size classes into solute-rich and solute-depleted for unimodal grain size distribution (re-heated to 1225°C) |
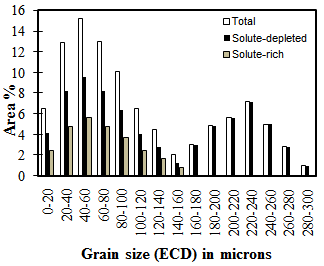 | Figure 4. Separation of grain size classes into solute-rich and solute-depleted for bimodal grain size distribution (re-heated to 1150°C) |
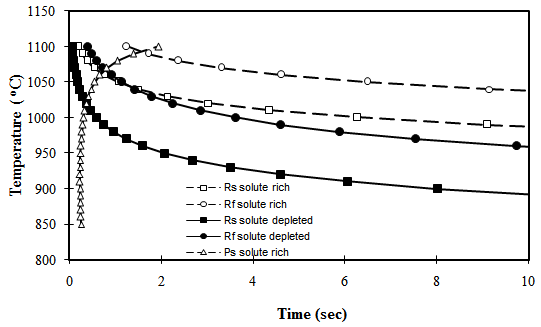 | Figure 5. Separation of recrystallisation start (square symbols) and finish (circular symbols) temperatures for solute–rich (solid symbols) and solute-depleted (open symbols) in a segregated steel sample |
4. Conclusions and Further Work
- The use of grain sizes classes instead of an average grain size gives better fit between a Dutta-Sellars-based prediction and experimentally determined recrystallisation fractions in an homogenised sample.In a segregated steel sample, the use of different[Nb] in the modified Dutta-Sellars approach results in improved prediction of the amount of recrystallisation although the fit for grain size distributions is not as good as that seen for the homogenised case.For steels solidifying via a peritectic transformation then a Clyne-Kurz approach gives reasonable prediction for the fraction of solute-rich materialThe modelling approach is being improved by addressing the fit of grain size distributions; the effects of grain size on stored energy; variations in strain and composition; and solidification without the peritectic.
ACKNOWLEDGEMENTS
- The authors wish to thank the support of the School of Metallurgy and Materials at the University of Birmingham and Tata Steel Europe and the results generated by Debalay Chakrabarti, Amrita Kundu and Dayue Zhang.
References
| [1] | Sellars, C.M. The physical metallurgy of hot working. in Hot working and forming processes. 1979. University of Sheffield: The Metals Society, London. |
| [2] | Deardo, A.J., Niobium in modern steels. International Materials Reviews, 2003. 48(6): p. 371-402. |
| [3] | Fernandez, A., P.Uranga, B.Lopez and J.M.Rodriguez-Idabe, Static Recrystallization Behaviour of a Wide Range of Austenite Grain Sizes in Microalloyed Steels. ISIJ International, 2000. 40(9): p. 893 - 901. |
| [4] | Wu, S.J. and C.L. Davis, Effect of duplex ferrite grain size distribution on local fracture stresses of Nb-microalloyed steels. Materials Science and Engineering: A, 2004. 387–389(0): p. 456-460. |
| [5] | Dutta, B. and C.M. Sellars, Effect of composition and process variable on Nb(C,N) precipitation in niobium microalloyed austenite. Materials Science and Technology, 1987. 3: p. 197-206. |
| [6] | Kundu, A., C. Davis, and M. Strangwood, Grain Size Distributions after Single Hit Deformation of a Segregated, Commercial Nb-Containing Steel: Prediction and Experiment. Metallurgical and Materials Transactions A, 2011. 42(9): p. 2794-2806. |
| [7] | Kundu, A., Grain Structure Development During Casting, Reheating and Deformation of Nb-Microalloyed Steel, PhD thesis, School of Metallurgy and Materials 2011, University of Birmingham: Birmingham, UK. |
| [8] | Davis, C.L. and M. Strangwood, Segregation behaviour in Nb microalloyed steels. Materials Science and Technology, 2009. 25(9): p. 1126-1133. |
| [9] | Clyne, T.W. and W. Kurz, Solute Redistribution during Solidification with Rapid Solid-state Diffusion, Metallurgical Transactions A, 1981, 12, 965-971. |