Deepak Kundalkar, Asim Tewari
Department of Mechanical Engineering, IIT Bombay Powai, Mumbai, 400076, India
Correspondence to: Deepak Kundalkar, Department of Mechanical Engineering, IIT Bombay Powai, Mumbai, 400076, India.
| Email: |  |
Copyright © 2012 Scientific & Academic Publishing. All Rights Reserved.
Abstract
High-strength low-alloy steels (HSLA) have better mechanical and corrosion properties than carbon steels and lower manufacturing cost due to fewer heat-treatment steps. The superior properties of HSLA are attributed to the combined effect of multi-phase microstructure, grain size strengthening and precipitate hardening which are produced in situ during hot deformation. The final properties are a combined effect of solutionization/precipitation, austenitic grain growth/DRX/ recovery and kinetics of ferrite, pearlite, martensite and bainite formation. Hence it is of scientific and technological importance to understand the microstructural evolution of HSLA under High Temperature Deformation (HTD). In this work the effect of deformation rate and temperature on the competition among grain-growth/DRX/recovery kinetics of austenite phase is studied using analytical and numerical thermodynamic models. It is seen that for a given temperature there exists a critical deformation rate above which DRX is the dominant mechanism.
Keywords:
Drx, Hot Deformation, Hsla Steel, Microstructure Evolution, Strain Energy Density
Cite this paper: Deepak Kundalkar, Asim Tewari, Effect of Strain, Strain Rate and Temperature of Hot Deformation on Microstructural Evolution of Ti and V Microalloyed Steel, International Journal of Metallurgical Engineering, Vol. 2 No. 2, 2013, pp. 117-124. doi: 10.5923/j.ijmee.20130202.01.
1. Introduction
Structural steels with a ferrite-pearlite microstructure are widely used in civil, mechanical and chemical engineering applications. Higher working loads and increasing demand of reliability requirements have led to an increase in the requirement of high strength and toughness in these steels. In addition the requirement of good weldability leads to decrease in carbon content of the steel, thereby decreasing the strength of the steel, due to a decrease in the amount of pearlite. This decrease in strength can be overcome by microalloying the steel with elements such as titanium, niobium and vanadium in small amounts (< 0.15 wt. %). These microalloying elements improve the strength of steels through mechanisms such as precipitation strengthening and grain size refinement[1-6].In hot deformation process the mechanisms such as recovery, DRX and growth also play a very important role in determining the prior austenite grain size and also the final evolved microstructure of the steel. R. D. Doherty el. Al., in a review on DRX, have precisely defined these mechanisms as below. “Recrystallization is the formation of a new grain structure in a deformed material by the formation and migration of high angle grain boundaries driven by the stored energy of deformation”. On this definition “Recovery consists of all annealing processes occurring in deformed materials that occur without the migration of a high angle grain boundary”. Grain coarsening was defined as processes involving the migration of grain boundaries when the driving force for migration is solely the reduction of the grain boundary area itself[7]. Based on the type of deformation the mechanisms of recrystallization can be static or dynamic[8]. In the case of hot deformation recrystallization takes place dynamically.The effect of hot deformation on Nb, Ti and V microalloyed steel has been studied and reported by many authors[9-13]. These include the effect of strain rate and temperature of hot deformation on the microstructure and properties of steel.In this work an effort has been made to model the effect of hot deformation parameters on the microstructure through experiments and modeling.
2. Experiment
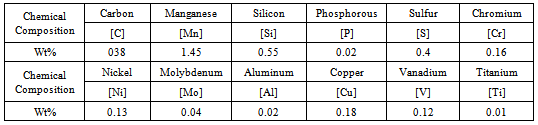
The HSLA steel consisting of Ti and V microalloying elements (commercially known as 38MnVS6) was chosen for this investigation. The material composition is as given in Table 1. The raw material was received in the form of rolled billets of  90 –110 mm diameter and 3000 mm length. This material was then processed as shown in Figure 1 to obtain samples of
  10 mm diameter and 15 mm length.
Table 1. Chemical composition of 38MnVS6 HSLA steel
 |
| |
|
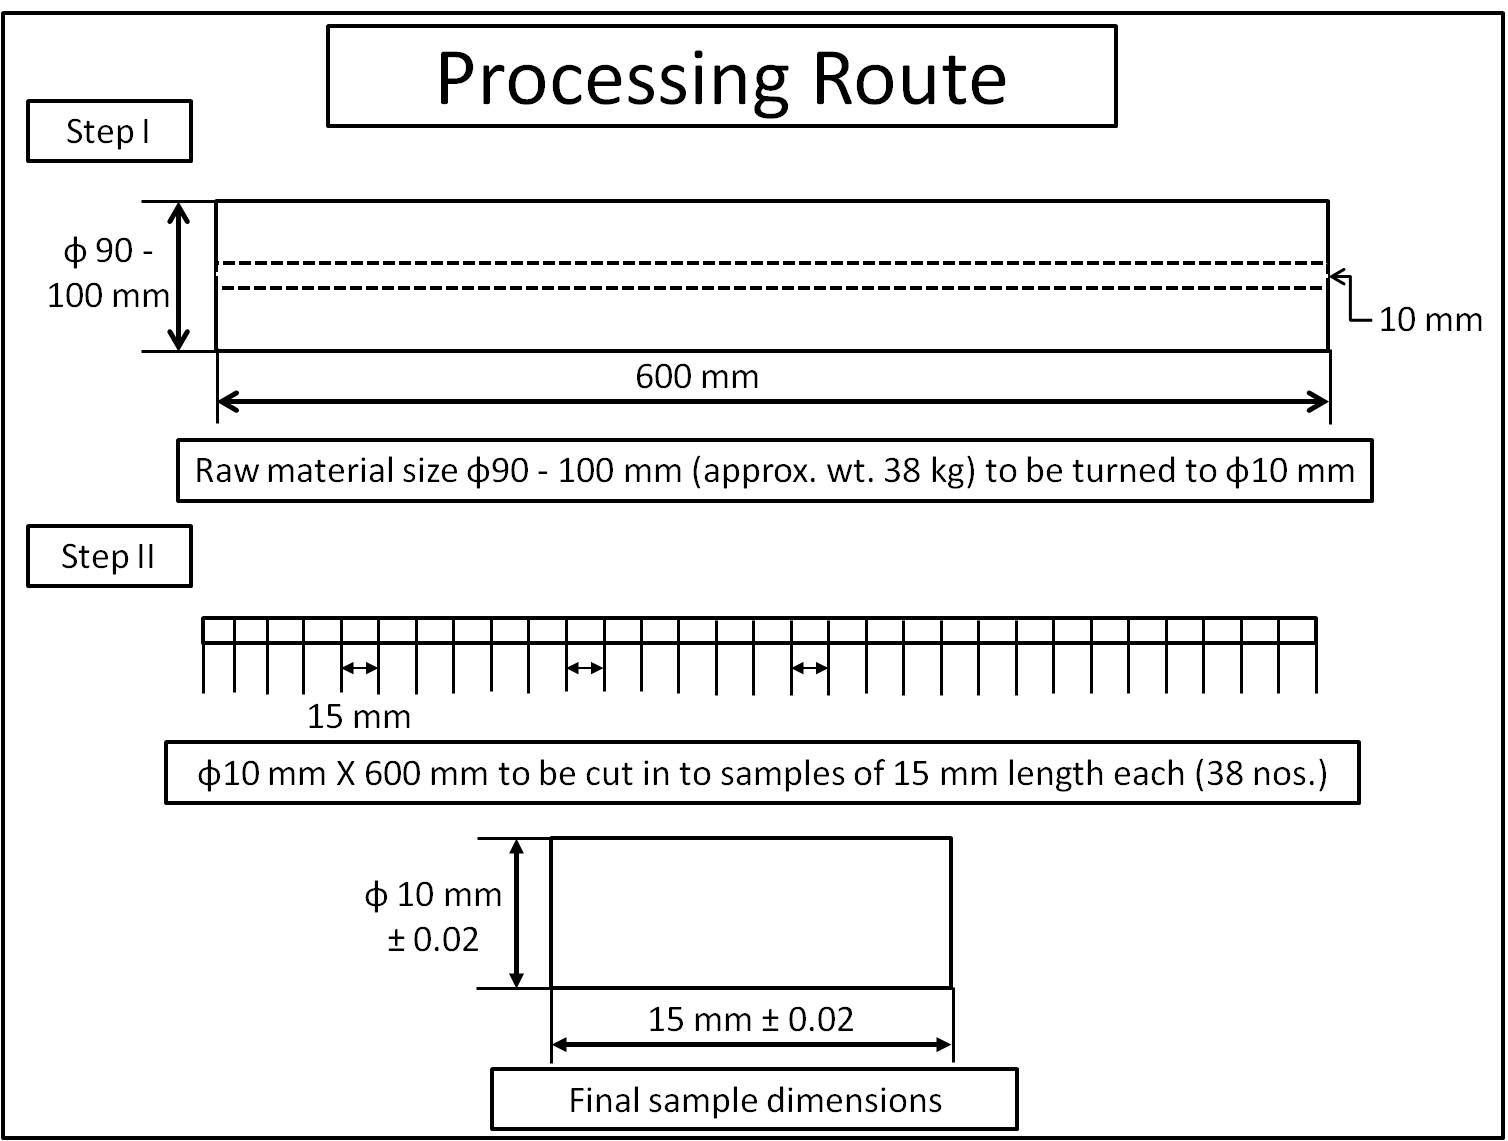 | Figure 1. Schematic of sample preparation from as-received material |
Hot compression test were carried out at various temperatures and strain rates on GLEEBLEthermo-mechanical simulator.The tests were conducted at true strain of 0.69 i.e. 50% compression of sample from its original length. Figure 2 represents the schematic of the hot compression testing process. Figure 3 shows the image of the GLEEBLE system with an enlarged view of sample mounting and testing chamber.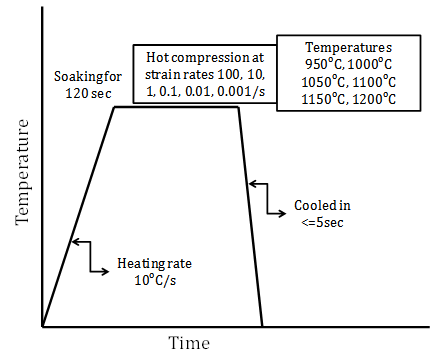 | Figure 2. Schematic of the hot compression testing process |
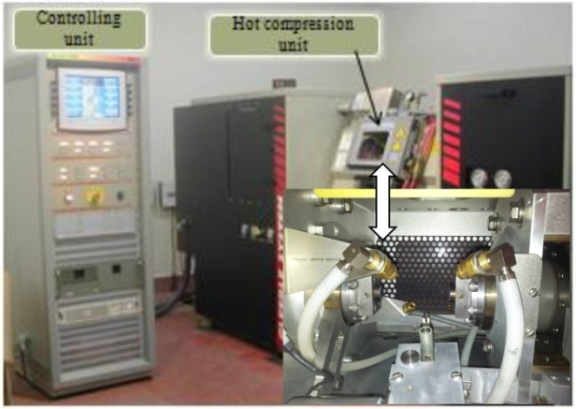 | Figure 3. GLEEBLE Thermo-mechanical simulator |
3. Modeling
Constant strain rate hot compression model was build using Deform v.10 software. The geometry used for modeling was same as the sample geometry Figure 4. Material model was created using the experimental flow stress curves. Figure 5 shows the setup used for modeling the constant strain rate hot compression test. The contact friction between the dies and the work-piece was taken as 0.3, condition similar to the lubricated hot forging environment.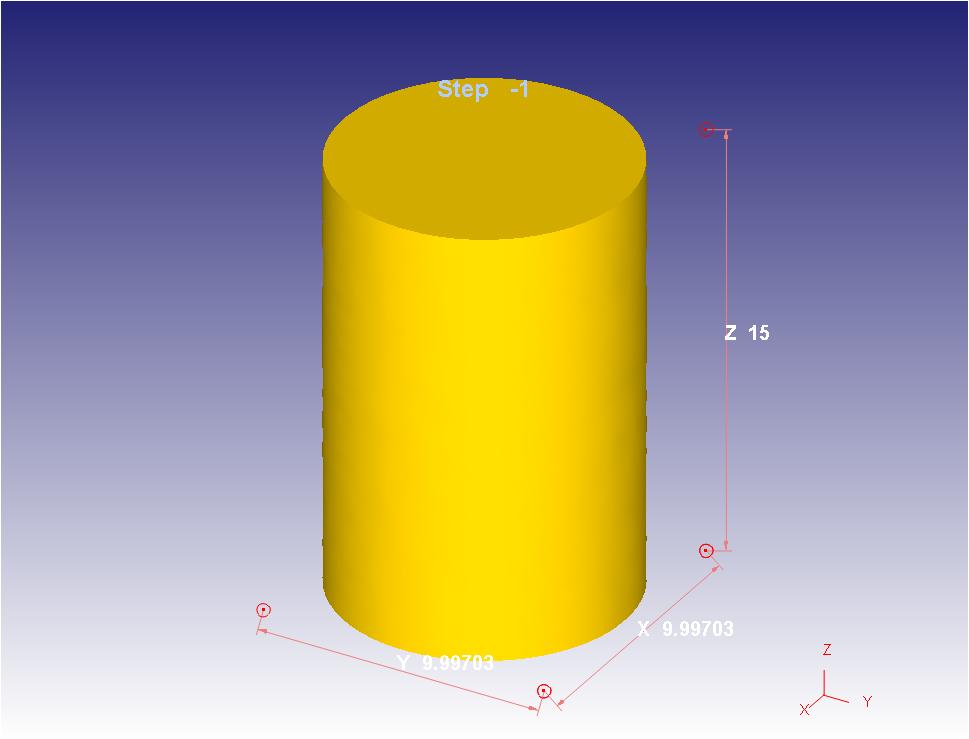 | Figure 4. Deform v.10 model geometry |
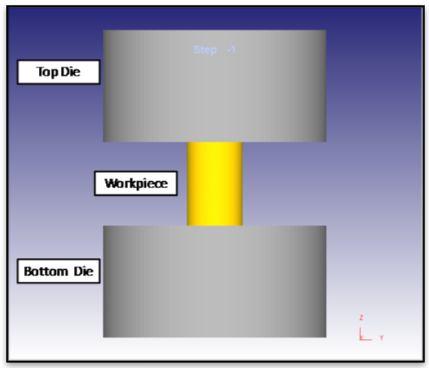 | Figure 5. Deform model hot compression setup |
Adiabatic boundary condition was imposed on the circumference along the length of the sample to imitate the experimental conditions.
4. Results & Discussion
The as-received material was polished and etched using 2% nital etchant and observed under the Carl Ziess optical microscope. Figure 6 shows the optical micrograph of as received samples of 38MnVS6. The microstructure observed in the optical micrograph shows ferrite-pearlite structure with prior austenite grain size of approx. 40mm.Figure 7a) shows the mean prior austenite grain size and Figure 7b) shows ferrite phase fraction along with 95% confidence interval for as-received sample of 38MnVS6 steel.The sample of 38MnVS6 steel was initially soaked at 1300℃ for 120 sec and then hot compressed at constant strain rate of 10/s and temperature of 1150℃ in GLEEBLE thermo-mechanical simulator. Figure 8 shows the heating, soaking, hot deformation and the cooling temperatures as function of time collected from GLEEBLE data. The heating was very rapid at rate of 10℃/s and after deformation cooling was also very rapid (i.e. in less than 5 sec).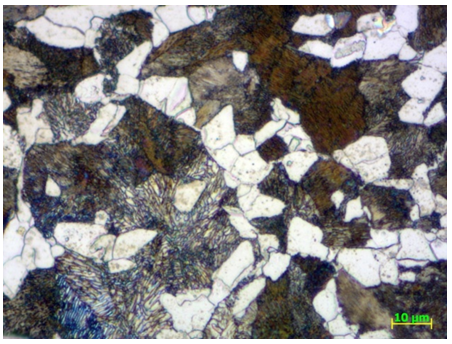 | Figure 6. Optical micrograph of as-received 38MnVS6 HSLA steel |
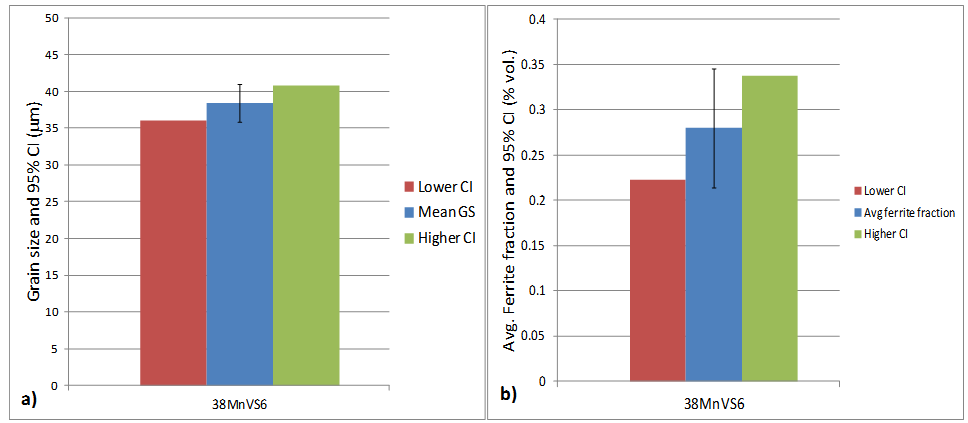 | Figure 7. a) Grain size and b) Ferrite phase fraction with 95% CI for as-received samples of 38MnVS6 HSLA steel |
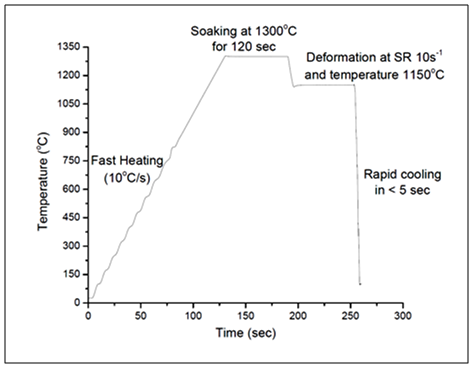 | Figure 8. Time temperature curve extracted from GLEEBLE data |
The effect of this hot deformation process on the evolved microstructure is as shown in Figure 9. It is seen that the grain size at the cross-sectional surface is the largest and decreases towards the radial edge. Similarly the grain size reduces as we move from the surface towards the axial center. The clear distinction in the final grain sizes at these locations is shown in Figure 10.The variation in the prior austenite grain sizes at locations shown in Figure 10 on the sample along with the 95% CI values is shown in Figure 11. It is seen that the mean grain size at the surface (P4) is almost the twice of the mean grain size at the center (P1). The variation in the phase fraction of ferrite is shown in Figure 12. The locations with largest grain size have least fraction of ferrite whereas those with fine grain size have higher fraction of ferrite phase.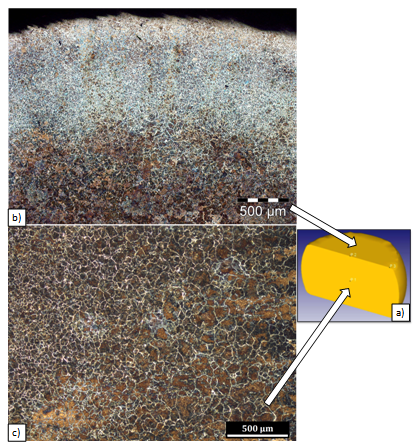 | Figure 9. Optical micrographs of a) sample at b) cross section and c) axial centre locations |
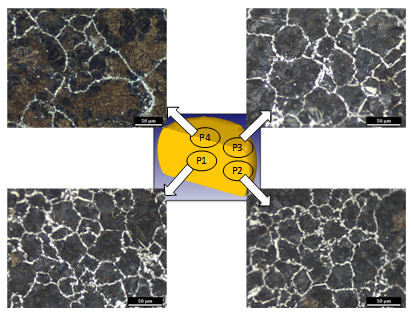 | Figure 10. Optical micrographs at various locations as marked on the sample |
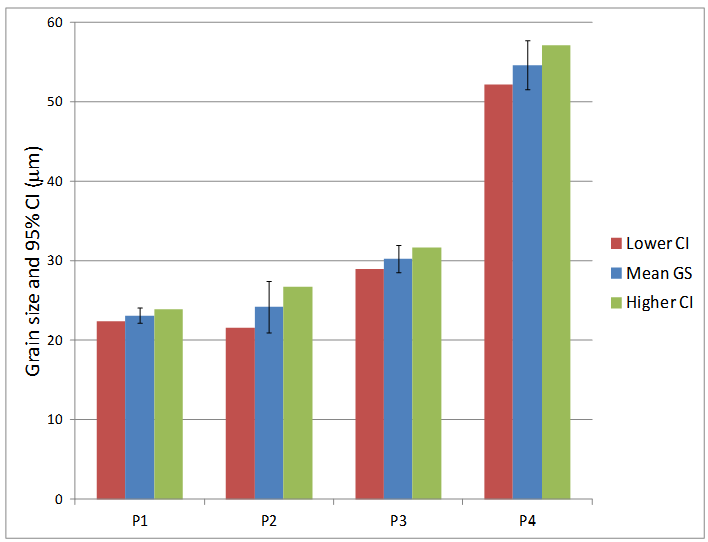 | Figure 11. Prior austenite grain size along with 95% CI at locations marked in Figure 10 |
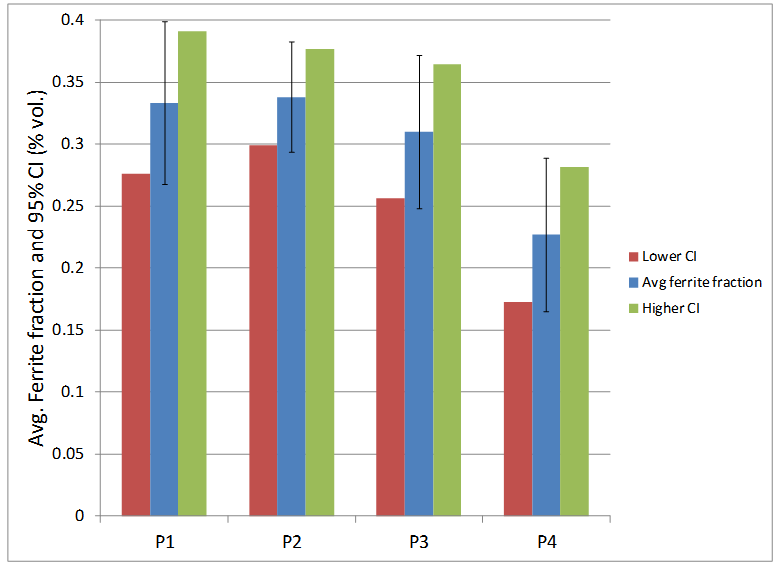 | Figure 12. Phase fraction of ferrite along with 95% CI at locations marked in Figure 10 |
Figure 13 shows the EBSD IPF and IQ maps at locations P1, P3 and P4, respectively. The KAM values were measured at these locations using the EBSD results and are given in Table 2.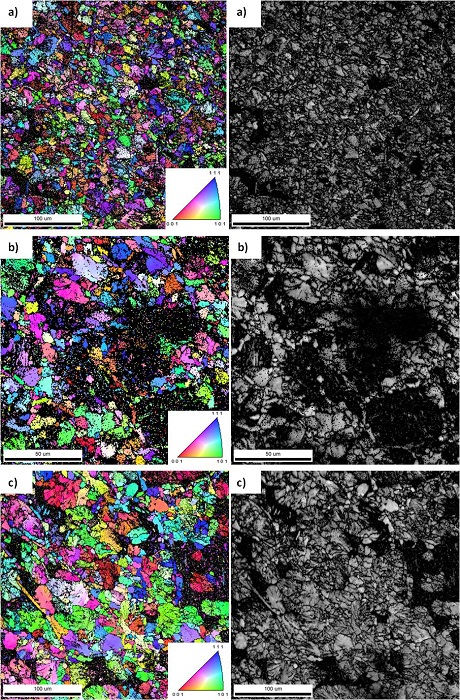 | Figure 13. EBSD IPF and IQ maps at locations a) P1, b) P3 and c) P4 |
From Figure 11 and Table 2 it is seen that the mean grain size increases in the order P1 < P2 < P3 < P4, whereas the pre-eutectoid ferrite phase fraction decreases in the same order P1 > P2 > P3 > P4.| Table 2. Grain sizes and KAM values for various locations |
| | Location | Grain size | KAM | | P1 | 19 mm | 1.20 | | P3 | 22 mm | 1.05 | | P4 | 46 mm | 0.9 |
|
|
KAM value provides the measure of post DRX deformation. As post DRX deformation increases KAM value also increases. Highest KAM value at location P1 indicates large deformation after final DRX, whereas lower KAM value at P4 indicates lesser deformation after final stage of DRX.Hot compression model was prepared in Deform to understand the variation in the strain, strain rate and temperature at different locations within the sample. The data used for building the material model was based on the experimental flow stress data available in the literature and from own work. In the Deform model same four points were tracked and the effective strain rate for each of these four locations were plotted Figure 14. The equivalent stress vs. equivalent strain curves were also plotted for each of these locations as shown in Figure 15.Form Figure 14 it is seen that thought the nominal strain rate of deformation is constant 10s-1, but the local strain rates are seen to vary by an order of magnitude. This large difference in the stain rates at different locations results in a large difference in strain energy densities at these locations. As a result of these different strain energy densities the nucleation rate also tends to vary.This stress strain data was further utilized for calculating the strain energy density at each location viz. P1, P2, P3 and P4. Figure 16 depicts the plots of strain energy density for each location as a function of true strain.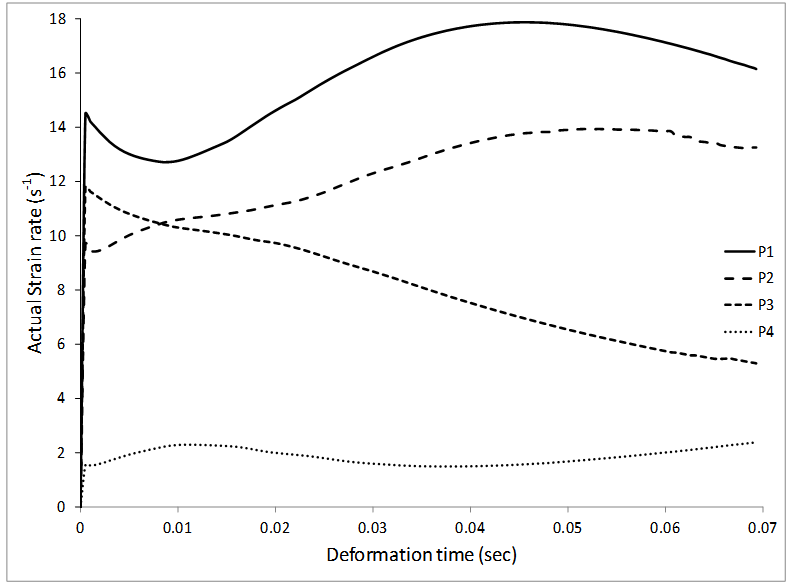 | Figure 14. Actual strain rates at locations P1 – P4 as a function of deformation time |
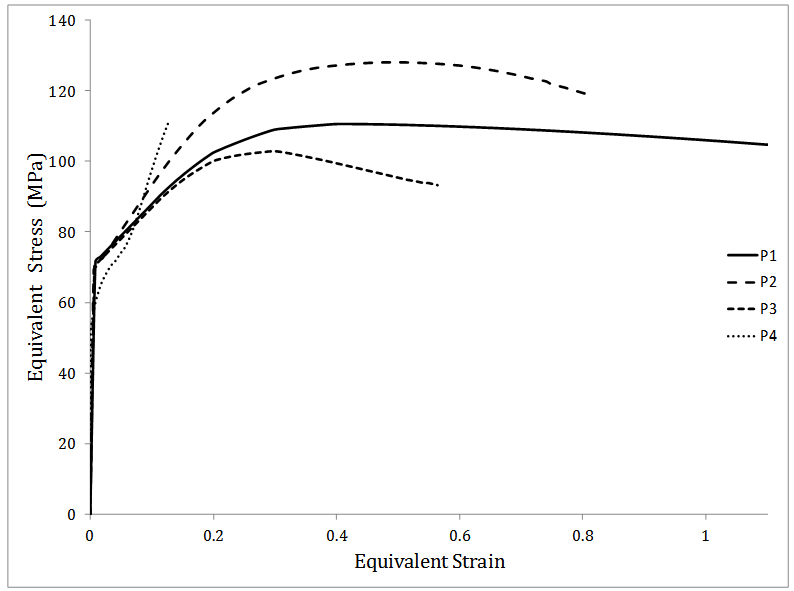 | Figure 15. Equivalent stress – strain plot for locations P1 – P4 |
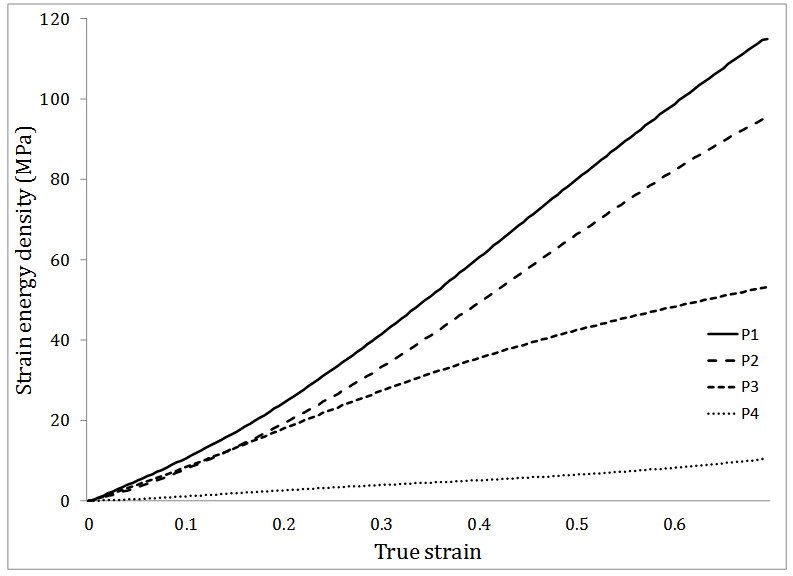 | Figure 16. Strain energy density at locations P1 – P4 as function of true strain |
The experimental and modeling results indicate variation in the nucleation rates at various locations within the sample. Increase in the strain rate at location P1 resulted in increased strain energy density. The nucleation rate which is directly proportional to the strain energy density thus increases resulting in lower grain size. For a given interval of time, say Dt, the strain changes as a function of strain rate. From Figure 14 it is evident that point P1 would experience highest strain and point P4 would be least strained which is observed in Figure 15. This matches with observed values of KAM, which provide an indication of post DRX deformation.Thus a qualitative model is proposed that with increase in strain-rate, the strain energy density would increase, which would trigger higher nucleation rate. Higher nucleation rate would result in lower grain size which is a direct measurable parameter and is seen to validate the above model. Moreover, higher strain-rate would mean larger post DRX deformation and thus larger KAM value. The measured KAM values show the above predicted trend thus further supporting the model. Finally, the inverse relation of pre-eutectoid ferrite with the grain size can be explained by the fact that the finer grains would have larger grain-boundary area (which is the site for pre-eutectoid ferrite nucleation) thus higher pre-eutectoid ferrite fraction.
5. Conclusions
1. It is seen that within a single hot compression sample, there exists large variations in grain size, and KAM values.2. The variation of grain size is seen to be inversely proportional to the pre-eutectoid ferrite fraction of that location.3. FEM simulations of the experiment also show that the local strain rates vary by an order of magnitude from one location to the other.4. The strain energy density calculations through FEM results show that the region with the highest strain energy density also has the smallest grain size.5. A model to explain all the observed results based on nucleation theory is proposed. This in mathematical form can be written as •ε ↑ ↔ E ↑ ↔ N ↑ ↔ G ↓ ↔ ff ↑, where E is the strain energy density, N is the nucleation rate, G is the Grain size and ff is the pre-eutectoid ferrite fraction.
References
| [1] | A. Abdollah-Zadeh, B. Eghbali. “Mechanism of ferrite grain refinement during warm deformation of a low carbon Nb-microalloyed steel”. Materials Science and Engineering A 457, 2007, p. 219–225. |
| [2] | Majid Meysami. “Study on the behavior of medium carbon vanadium microalloyed steel by hot compression test”. Materials Science and Engineering A 528, 2011, p. 3049–3055. |
| [3] | B. Eghbali. “Microstructural development in a low carbon Ti-microalloyed steel during deformation within the ferrite region”. Materials Science and Engineering A 480, 2008, p. 84–88 |
| [4] | D. K. Matlock, G. Krauss, J. G. Speer. “Microstructures and properties of direct-cooled microalloy forging steels”.Journal of Materials Processing Technology 117, 2001, p. 324–328. |
| [5] | A. Babakhani. “Investigation on the effects of hot forging parameters on the austenite grain size of vanadium microalloyed forging steel (30MnSV6)”. Journal of Alloys and Compounds 490 , 2010, p. 572–575. |
| [6] | Peter H. Wright, C. S. “High Strength Low Alloy Steel Forgings”. In ASM Handbook, Volume 1, Properties and Selection: Irons, Steels, and High Performance Alloys. ASM International. 2005, pp. 578-593. |
| [7] | R. D. Doherty, Hughes, J. J. Jonas, Humphreys. “Current issues in recrystallization: a review”. Materials Science and Engineering A238, 1997, p. 219–274. |
| [8] | B. Verlinden, J. Driver, I. Samajdar and R. D. Doherty. “Thermo-Mecanical Processing Of Metallic Metals”. Elsevier publication, UK. 2007, p. 85–108. |
| [9] | B. Eghbali. “Influence of deformation temperature on the ferrite grain refinement in a low carbon Nb-Ti microalloyed steel”. Journal of Materials Processing Technology 180 , 2006, p. 44–48. |
| [10] | B. K. Show. “Effect of vanadium and titanium modification on the microstructure and mechanical properties of a microalloyed HSLA steel”. Materials Science and Engineering A 527 , 2010, p. 1595–1604. |
| [11] | C. Garcıa-Mateo. “Influence of vanadium on static recrystallization in warm worked microalloyed steel”. Scripta mater. 42 , 2000, p. 137–143. |
| [12] | Hasan Karabulut. “Effect of vanadium content on dynamic strain ageing in microalloyed medium carbon steel”. Materials and Design 25 , 2004, p. 521–527. |
| [13] | Z. Wanga, X. Maoc, Z. Yanga. “Strain-induced precipitation in a Ti micro-alloyed HSLA steel” Materials Science and Engineering A 529, 2011, p. 459– 467. |
 Abstract
 Reference
 Full-Text PDF
 Full-text HTML