-
Paper Information
- Next Paper
- Previous Paper
- Paper Submission
-
Journal Information
- About This Journal
- Editorial Board
- Current Issue
- Archive
- Author Guidelines
- Contact Us
International Journal of Metallurgical Engineering
p-ISSN: 2167-700X e-ISSN: 2167-7018
2013; 2(1): 85-91
doi:10.5923/j.ijmee.20130201.13
Thermo-mechanical Processing and Process Modeling of Power Plant Materials
 Abstract
 Reference
 Full-Text PDF
 Full-text HTML
A.K. Bhaduri, Dipti Samantaray, Sumantra Mandal
Materials Development and Technology Group, Indira Gandhi Centre for Atomic Research, Kalpakkam, 603102, India
Correspondence to: A.K. Bhaduri, Materials Development and Technology Group, Indira Gandhi Centre for Atomic Research, Kalpakkam, 603102, India.
| Email: |  |
Copyright © 2012 Scientific & Academic Publishing. All Rights Reserved.
The paper discusses the details of process modelling for fabrication of components used in sodium-cooled fast reactors, in which 316LN austenitic stainless steel and modified 9Cr-1Mo steel are used as the major structural materials. For process modelling of thermo-mechanical processes, processing maps based on the dynamic material modelling approach have been developed for both the materials to visually represent their inherent deformation behaviour as a function of strain rate and temperature. Detailed microstructural investigations have also been carried out to validate the safe and unsafe domains of the processing maps. Based on these processing maps, microstructural studies and variation in activation energy, the parameters for the processing these materials have been optimised.
Keywords: 316Ln Stainless Steel, Modified 9Cr-1Mo Steel, Hot Isothermal Compression, Flow Behaviour, Processing Map, Activation Energy
Cite this paper: A.K. Bhaduri, Dipti Samantaray, Sumantra Mandal, Thermo-mechanical Processing and Process Modeling of Power Plant Materials, International Journal of Metallurgical Engineering, Vol. 2 No. 1, 2013, pp. 85-91. doi: 10.5923/j.ijmee.20130201.13.
Article Outline
1. Introduction
- In power plants, the structural materials used define the upper temperature limit of the thermal power cycle and, hence, the efficiency of the power plant. In nuclear power plants, apart from elevated temperature thermal and mechanical properties, compatibility with coolant and corrosion behaviour, the irradiation properties are also taken into consideration for selection of suitable structural materials. In sodium-cooled fast reactors (SFRs), in which the material is exposed to high fast neutron flux, sodium environment and elevated temperatures, austenitic stainless steels are chosen as the structural material for the in-core, primary and secondary circuit components, while chromium-molybdenum ferritic steel is chosen for the steam generators[1, 2]. Proper fabricability to the required product forms is the key to optimum utilisation of the chosen materials. The components of the reactor and steam generators are fabricated through various thermo-mechanical processes, like extrusion, rolling and forging, etc.[2]. During these forming processes, the material undergoes various microstructural changes, which affect the mechanical properties of the final component and in turn their in-service behaviour[2]. To ensure prolonged service life of the components control of the microstructural quality and soundness of the product is of paramount importance. As the microstructural quality of materials is dependent on the forming process parameters, strain rate and temperature[2, 3], attention has to be paid towards their optimization. For this purpose, process modeling has proven to be a powerful tool. Dynamic materials model (DMM)[4] is one such tool, and DMM-based processing map, which gives a visual representation of the inherent material behavior in the strain rate and temperature domain, are used as a guide to choose the suitable domain for thermo mechanical processing. This paper discusses DMM-based thermo-mechanical process modeling of 316LN austenitic stainless steel and modified 9Cr-1Mo steel, which are used as materials of construction of in-reactor components and steam generators, respectively, in SFRs.
2. Experimental
- The chemical composition (in wt-%) of 316LN stainless steel (SS) used in the present study is Fe-17.57Cr-12.15Ni-2.53Mo-0.025C- 0.14N- 1.74Mn- 0.20Si- 0.0041S- 0.017P, while that for the modified 9Cr-1Mo steel is Fe-8.95Cr- 0.91Mo- 0.102C- 0.059N- 0.37Mn- 0.23Si- 0.11Ni-0.03Al-0.182V-0.075Nb-0.003Ti-0.064Cu. Cylindrical specimens of 10 mm diameter and 15 mm length were fabricated from these steels. Uniaxial compression tests at constant true strain rates of 0.001, 0.01, 0.1, 1 and 10 s-1 were performed in the temperature range 1073-1423K for 316LN SS and 1123-1373K for modified 9Cr-1Mo steel. All the specimens were given 50% deformation after which they were quenched in water to freeze the microstructure. The experimental load-stroke data were converted to true stress–true plastic strain curves using the standard procedure[2, 3]. The water-quenched samples were cut along the longitudinal direction to prepare metallographic specimens. The diamond polished metallographic specimens of 316LN SS were electrolytically etched in 10% ammonium persulphate solution, while those of modified 9Cr-1Mo steel were etched with Villela’s reagent. Optical microscopic examination was carried out to study the microstructures in the maximum deformation zone of the samples.
3. The Approach
- In process modeling, the most important pre-requisite is to understand and represent the flow behaviour of the material as a function of strain, strain rate and temperature[2, 3]. Depending on the objective to be accomplished through process modeling, many models have been developed to represent this complex behaviour. DMM is one such model which is intended to visually represent the inherent dynamic behaviour of the material in a two-dimensional temperature-strain rate frame at specified strain levels. According to DMM, the work-piece subjected to hot deformation is a nonlinear dissipater of power[4]. The power (P) input to the work-piece at any deformation level consists of two complementary parts, viz. power content (G) and power co-content (J)[2-4]. The power content represents the fraction of the power lost through temperature rise and the power co-content represents the fraction used for microstructural changes, with the partitioning between the two being decided by the strain rate sensitivity parameter (m)[2-4] given by:
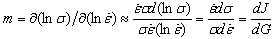 where σ is flow stress and is strain rate. The J content is represented as:
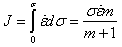 with J achieving a maximum value when m becomes 1. The dimensionless parameter, obtained by normalizing J with Jmax, is known as the efficiency parameter η[2-4]. The plot showing the variation of η with temperature and strain rate is known as power dissipation map. This map exhibits the different domains that can be correlated to the microstructural mechanisms operative in that domain which are responsible for the deformation behaviour of the material. Usually, dynamic recrystallization (DRX), dynamic recovery and super-plasticity are considered as the favourable microstructural mechanisms for better deformability of the material, while localized slips, shear band formation, wedge cracking and void formation at hard particles, and dynamic strain aging are considered as the mechanisms that promote flow instability[5] that lead to poor deformability. However, the power dissipation map alone cannot be used to identify the exact domains of instability. Therefore, a continuum instability criterion based on the extremum principles of irreversible thermodynamics as applied to large plastic flow[4, 5] is used to identify the exact regimes of flow instabilities. This instability criterion parameter is expressed as:
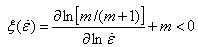 The variation in the instability parameter is plotted in temperature and strain rate windows to obtain the instability map, and the contour with
  = 0 is used as the boundaries between the safe and unsafe domains. The instability map superimposed on the power dissipation map constitutes the processing map[2]. The processing map visually represents the stable and unstable dynamic behaviour of the material at various combinations of strain rate and temperature, and is therefore directly used for choosing the processing domain as per the requirement. The results obtained from the processing map can also be substantiated by studying the variation of activation energy in that domain. It has also been seen that in stable domains of the processing map the apparent activation energy Q remains almost constant[2, 3]. Hence, variation of Q is used as an additional indicator for the optimum processing domain[2, 3]. The apparent activation energy Q for the material is given by:
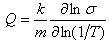
4. Results and Discussions
4.1. 316LN Stainless Steel
- The representative flow curves of 316LN SS obtained from compression tests are shown in Fig. 1, from which the effect of strain and temperature on the flow stress could be observed.As the strain rate sensitivity of the material plays an important role in power distribution between the J-content and G-content, the value of m has been calculated at various sub-intervals of strain rate and temperature. Over this entire domain, m varies between –0.019 and +0.35. For this steel, m is positive at all conditions except in the region bounded by 1073–1123K and 0.1–1 s-1. These values of m have been used for developing the processing map shown in Fig. 2. For ease of analysis, the map has been divided into six domains (a) to (f) as discussed below.Domain (a) in occurs at about 0.01 s-1 and 1123K, with the peak η being 35% and Q being ~200 kJ/mol. The representative microstructure of this domain, as given in Fig. 2(a), shows initiation of DRX in the microstructure with the characteristic of necklace structure. Though this domain is a safe domain, it cannot be considered for the thermo-mechanical processing because of its proximity to the unstable domain in the processing map.Domain (b) is spread over 0.001–0.01 s-1 and 1173–1273K, with the peak η being 45–30%. The representative microstructure of this domain (Fig. 2b) shows almost completely equiaxed DRX microstructure. Considering the microstructural quality this domain can be chosen for thermo-mechanical processing. However, the Q of this domain varies in the range of 100 to 500 kJ/mol. The rapid variation in both efficiency and activation energy indicates the sensitivity of grain size to the processing parameters. Therefore, this domain would not allow much flexibility for controlling the process parameters.Domain (c) is another safe domain bounded within 0.001–0.05 s−1 and 1350–1423K with peak η of 50%. The representative microstructure of this domain is shown in Fig. 2(c). Like domain (b), the microstructure corresponding to this domain also shows completely equiaxed DRX grains that are comparatively larger in size. In this domain, Q varies in the range of ~100–200 kJ/mol.Domain (d) occurs at about 0.1 s-1 and 1323K. This is the fourth safe domain with peak ηof 45%.The representative microstructures of this domain (Fig. 2d) corresponding to this peak η shows evidence of DRX. However, the microstructure consists of equiaxed DRX grains and elongated deformed grains. The Q of this domain varies between 100-500 kJ/mole. This domain is not suitable for thermo-mechanical processing because of its proximity to the unsafe domain.Domain (e) is an unstable domain bounded within 0.1–1 s-1 and 1073–1123K. This domain matches with the local negative strain rate sensitivity (LNSRS) domain of the material as the activation energy map of this domain shows negative values of Q. The microstructure obtained in this LNSRS domain (Fig. 2e) shows presence of some moderately distorted grains along with localised very heavily distorted grains (marked by arrows in the figure) without any evidence of DRX. These are clear indications of the occurrence of inhomogeneous deformation in the matrix.Domain (f) is the larger unsafe domain with positive m and ηvalues in the range 5–30%. The Q in this domain also showed a large variation from ~200 to 500 kJ/mol. The representative microstructure corresponding to this instability region, given in Fig. 2(f), does not show any sign of the conventional instabilities like adiabatic shear band, localized flow or inter-crystalline cracking. The small nucleated grains in the microstructure indicates occurrence of DRX. However, the microstructure is significantly different from the other DRX microstructures and consists of more number of elongated (~54 µm) deformed grains along with a few equiaxed DRX grains. The random bimodal distribution of the grains can be taken as the signature of instability for this steel in this domain as this can lead to inferior mechanical properties in the material.From the above analysis of the domains exhibited by the processing map and the microstructural observations, it can be concluded that the domain (c), which is bounded within the temperature range 1350–1423K and strain rate range 0.001–0.05 s−1 is the most suitable domain for hot working of this grade of 316LN SS with the variation in being moderate (average value of 150 kJ/mol) over a large domain (shown by a box in the map). In this domain, the efficiency variation is 45±5%.
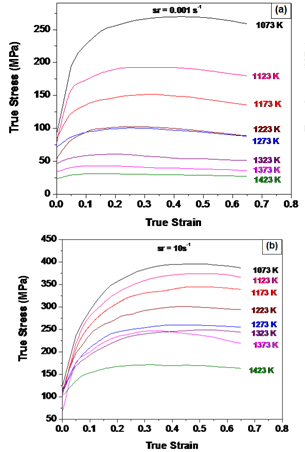 | Figure 1. Flow curves of 316LN SS at strain rates of (a) 0.001 s-1 and (b) 10 s-1 |
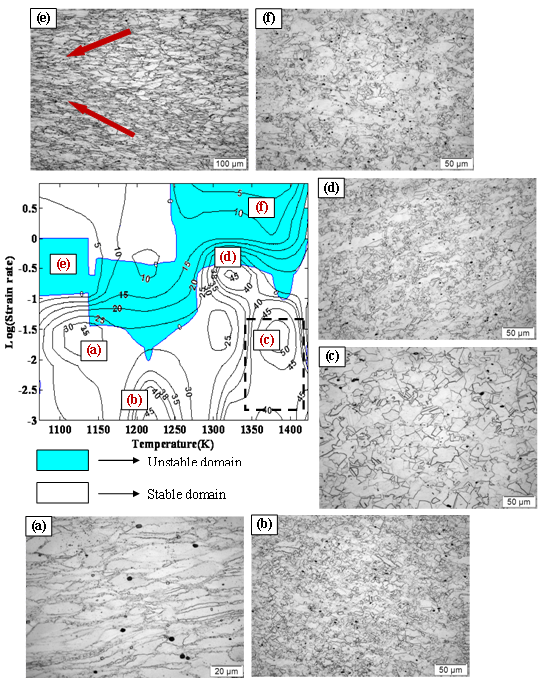 | Figure 2. Various domains of processing map of 316LN SS and their representative microstructures at: (a) 1123K, 0.01s-1; (b) 1223K, 0.001s-1; (c) 1373K, 0.01 s-1; (d) 1323, 0.1s-1; (e) 1123K, 1.0s-1 (f) 1373K, 1s-1 |
4.2. Modified 9Cr-1Mo (Gr-91) Steel
- Modified 9Cr-1Mo steel has a martensitic microstructure at room temperature and transforms to austenite over the temperature range of 1103–1143K[6]. The representative flow curves of the steel at different temperatures and strain rates, given in Fig. 3, shows that this material exhibits work hardening, thermal softening and strain rate hardening. The strain rate sensitivity parameter m for this steel varies in the range 0.04–0.3. The processing map for this material is shown in Fig. 4. The major domains exhibited in this map are discussed below.Domain (a) occurs at about 0.1 s-1 and 1123K and is an unsafe zone with an average η of 20%. In this domain, m varies from 0.08 to 0.15. The lower strain rate sensitivity indicates that the material has lower ductility attributable to phase changes occurring in this region. The microstructure corresponding to this domain, given in Fig. 4(a), shows low intensity initiation of localized slip identified. The Q in this domain is ~100 kJ/mol.Domain (b) occurs at low strain rates of 0.001–0.01s-1 and medium temperatures 1173–1223K, exhibiting a peak η of 38% with of ~200-500 kJ/mol. However, this domain is an unsafe’ region as the instability parameter is negative. The representative microstructure (Fig. 4b) of confirms the flow instability of the material in this region.
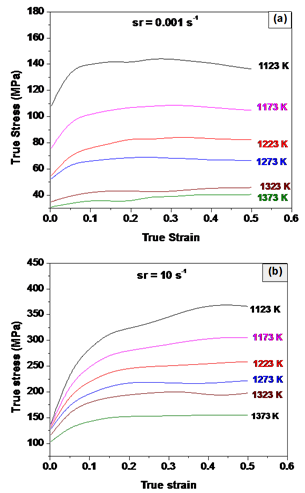 | Figure 3. Flow curves of Gr-91 steel at strain rates of: (a) 0.001s-1 and (b) 10 s-1 |
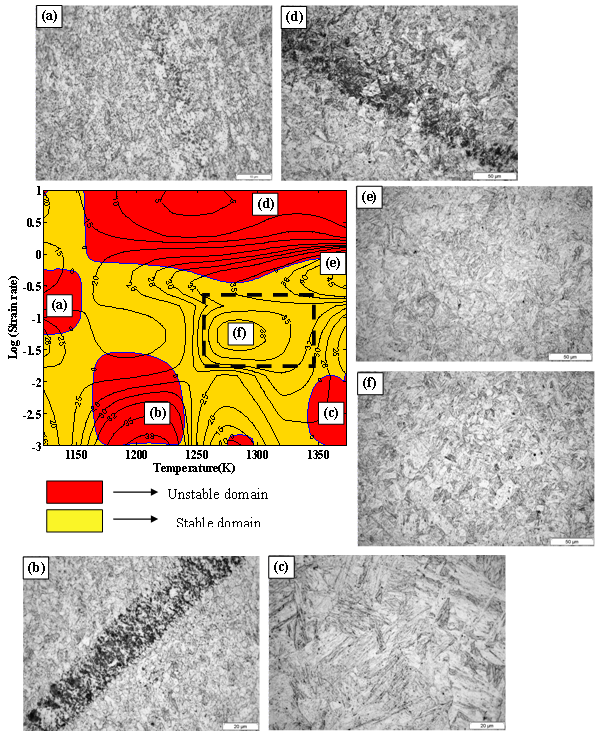 | Figure 4. Various domains of processing map for modified 9Cr-1Mo steel and their representative microstructures at: (a) 1123K, 0.1s-1; (b) 1173K, 0.001 s-1; (c) 1373K, 0.001 s-1; (d) 1323K and 1 s-1; (e) 1373K, 1 s-1; and (f) 1323K and 0.1s-1 |
5. Summary
- Thermo-mechanical process modelling has been carried our for optimising the processing parameters for 316LN austenitic stainless steel and modified 9Cr-1Mo ferritic steel. Dynamic materials based processing maps were developed for both the steels using experimental data, and their safe and unsafe domains were validated by microstructural investigations of the specimens tested in each domain. Based on analysis of the processing map, microstructural investigations and activation energy variation, the optimum hot-working domain was identified for the 316LN SS to be 1350–1423K and 0.001–0.05 s−1 strain rate, and for modified 9Cr-1Mo steel to be 1250–1350K and 0.015–0.3 s-1 strain rate.