-
Paper Information
- Next Paper
- Previous Paper
- Paper Submission
-
Journal Information
- About This Journal
- Editorial Board
- Current Issue
- Archive
- Author Guidelines
- Contact Us
International Journal of Metallurgical Engineering
p-ISSN: 2167-700X e-ISSN: 2167-7018
2013; 2(1): 47-51
doi:10.5923/j.ijmee.20130201.07
Influence of Boron on the Hardenability of Unalloyed and Low Alloyed Steel
 Abstract
 Reference
 Full-Text PDF
 Full-text HTML
Anjana Deva, Saikat K. De, Vinod Kumar, M. Deepa , B.K. Jha
R&D Centre for Iron and Steel, Steel Authority of India Limited, Ranchi-834002, India
Correspondence to: Anjana Deva, R&D Centre for Iron and Steel, Steel Authority of India Limited, Ranchi-834002, India.
| Email: |  |
Copyright © 2012 Scientific & Academic Publishing. All Rights Reserved.
Boron exerts a large influence on mechanical properties of steel through microstructural control. It increases the hardenability of steel by retarding the heterogeneous nucleation of ferrite at the austenite grain surfaces and the decomposition kinetics of austenite to ferrite transformation are governed by its location and chemical state. To understand the effect of boron (~ 25 ppm) on microstructural evolution and change in continuous cooling transformation (CCT) diagram , a systematic study has been carried out using Gleeble thermo-mechanical simulator in unalloyed (C: 0.05 wt%; Mn: 0.2 wt%) and low alloyed (C: 0.2 wt%; Mn: 1.2 wt%: Cr: 0.15 wt%) steels. CCT diagrams, plotted for the onset and end of pearlitic, bainitic and martensitic reactions, consisted essentially of two C-curves and a remarkable difference was observed on comparing the results for both steels. It is interesting to note that bainite and martensite are completely absent even at higher cooling rate of 70°C/sec in the unalloyed steel with boron addition. In contrast, the addition of boron was observed to promote significant bainite formation even at a slower cooling rate of only 20°C/sec in the low alloyed steel. These contradicting effects on hardenability can be explained by the effect of boron in shifting only the upper C curve to the right for reconstructive transformation.
Keywords: Boron, Cooling Rate, cct, Unalloyed, Low Alloyed, Hardenability
Cite this paper: Anjana Deva, Saikat K. De, Vinod Kumar, M. Deepa , B.K. Jha, Influence of Boron on the Hardenability of Unalloyed and Low Alloyed Steel, International Journal of Metallurgical Engineering, Vol. 2 No. 1, 2013, pp. 47-51. doi: 10.5923/j.ijmee.20130201.07.
Article Outline
1. Introduction
- The increase in grain boundary area per unit volume of austenite provides an increase in the number of potential nucleation sites for the subsequent austenite to ferrite transformation, which accelerates the transformation rate[1]. For the same cooling condition, a bigger austenite grain size results in decrease in the Ar3 temperature leading to decrease in the volume percentage of ferrite fraction, and the effect is manifested in terms of increased hardenability. It is well established that boron increases hardenability of steel by retarding the heterogeneous nucleation of ferrite at the austenite grain surfaces [2-4]. It is probable that this effect is due to the reduction in interfacial energy as boron segregates to the grain boundaries. This in turn makes grain boundary less effective as heterogeneous sites. However, boron effect is entirely different in low and high carbon steels, plain and alloyed steels, with low and high soaking temperatures, and more significantly with low and high cooling rates. Addition of boron increases the hardenability of quenched and tempered steels. However, the extent of hardening depends on transformation characteristics of austenite to ferrite and the presence of other alloying elements. A systematic study through thermo-mechanical simulator has been carried out in unalloyed and low alloyed steel to understand the boron effect on microstructural evolution and thereby change in continuous cooling transformation (CCT) diagram. Role of boron as a hardener under different soaking temperatures and cooling rates has also been examined.
2. Experimental
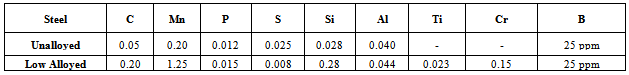
- Chemical composition of aluminium killed boron added low C-Mn steel used in the present study is shown in Table 1. Suitable test specimens were prepared from the crop ends of 32 mm transfer bar plates, collected after rough rolling of slabs. Specially designed tests were performed on the prepared specimens using Gleeble-3500C with fully integrated digital closed loop control thermal and mechanical system for understanding of processing conditions of hot rolling. Dilation tests aimed at determination of phase transformation temperatures. Easy to use Windows based computer software, combined with an array of powerful processors, provided an extremely user-friendly interface to create, run and analyze data from thermal-mechanical tests and physical simulation programs. Standards metallographic procedures were followed for material characterization which included optical microscopy. Scanning / transmission electron microscopy was used for characterizing low temperature phases and precipitates.
|
2.1. Dilatometric Study
- The austenite to ferrite transformation is accompanied by increase in atomic volume of the transformed-phase; resulting dilation in the test specimen is linked with the kinetics of transformation[5,6]. A number of dilation plots were generated by exposing prepared tubular specimens (85 mm long with 10 mm diameter) of unalloyed steel at different austenitising temperatures followed by cooling them through varied rates as shown schematically in Fig.1. While austenitising, specimens were heated at the rate of 3°C/sec and soaked in the range of 950 to 1200°C for 120 seconds to facilitate homogenization of chemistry and microstructure. These specimens were then cooled at different rates, ranging from 1 to 70°C/sec. The change in diameter of these specimens during cooling was recorded using an ultra-sensitive dilatometer provided with the gleeble 3500 C simulator and the output of the dilatometer i.e. “dilatation plot” was used in identifying start and finish temperatures of transformed phase.
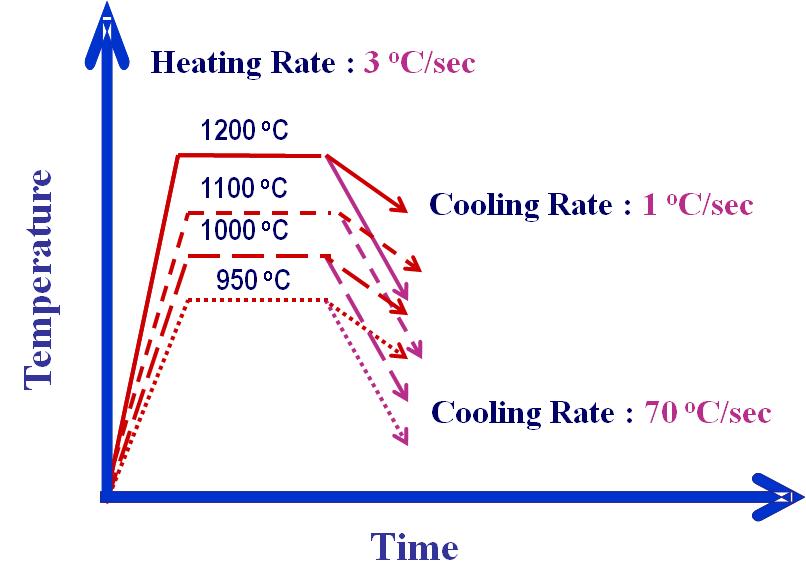 | Figure 1. Schematic depiction of thermal cycles of dilatation study (unalloyed steel) |
3. Results and Discussion
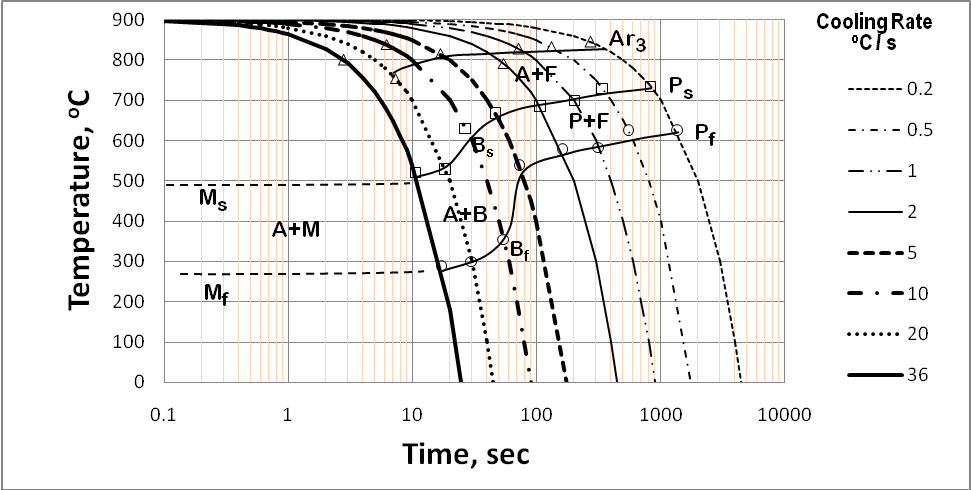
- Fig. 2 show a typical continuous cooling transformation (CCT) diagram of unalloyed boron added steel, constructed based on data generated on time taken for start to finish transformation for different cooling rates. It can be noted that with the increase in cooling rate, the onset of ferrite transformation shifted to a lower temperature.
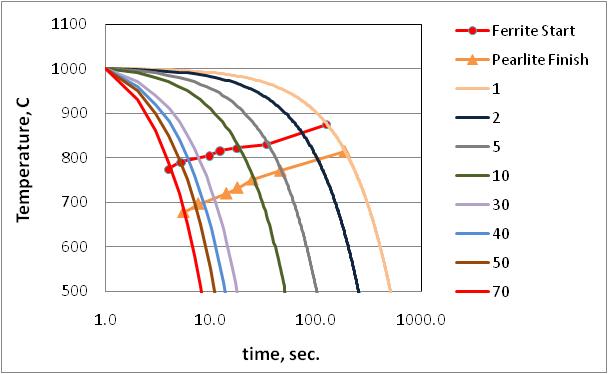 | Figure 2. Continuous cooling transformation diagram of unalloyed steel |
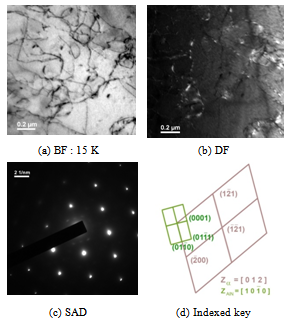 | Figure 3. Transmission Electron Micrographs depicting AlN precipitates |
 . Ferrite diffation pattern pertains to Z =[ 01 2 ]. To observe the microstructural evolution with much higher cooling rate, steel sample was heated to austenitisising temperature of 1200°C and subjected to very high cooling rate (~230°C/sec) in thermo-mechanical simulator and found that martensitic laths are present in steel (Fig. 4). It clearly indicates that there must be a critical cooling rate, above which bainite or martensitic transformation starts in low carbon unalloyed steel also which will depend on soluble boron content, austenitising temperature and cooling rate. It is interesting to note that the Ar3 temperatures of both the steels, when subjected to varied cooling rates, showed almost similar trend with the increase in cooling rate.
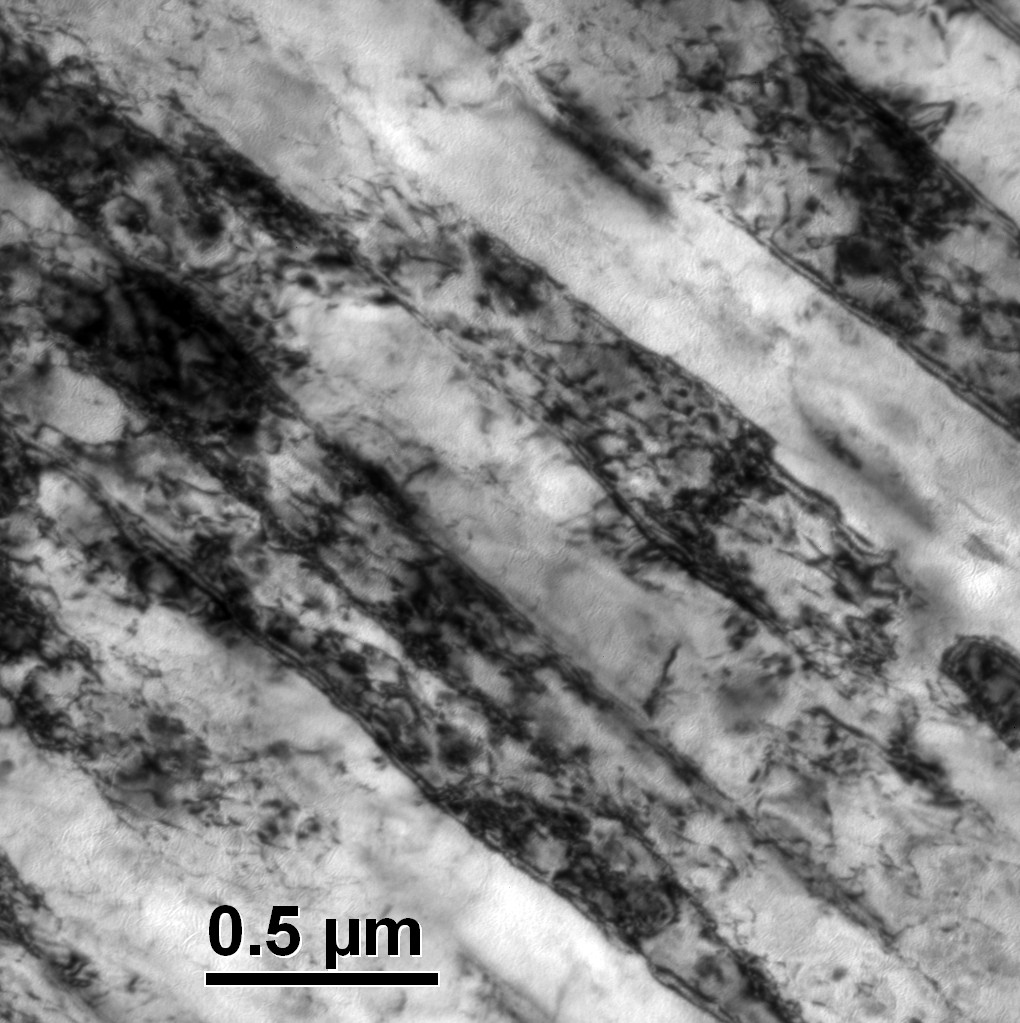 | Figure 4. Bright field image (8K) showing martensitic laths at higher cooling rate |
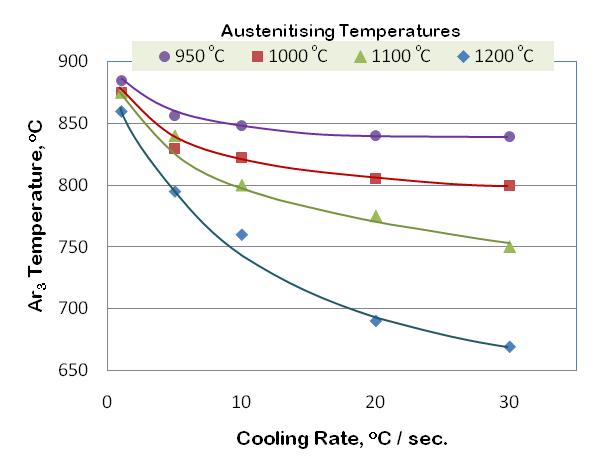 | Figure 5. Variation in Ar3 temperature of B-added steel with cooling rate for different austenitising temperatures |
 | Figure 6. Continuous cooling transformation diagram of low alloyed steel |
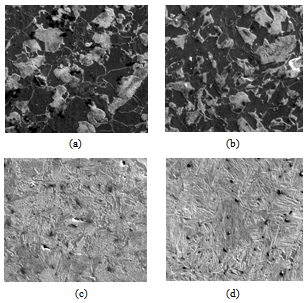 | Figure 7. Scanning electron micrograph from samples (a) 0.2°C/s (b) 1°C/s (c) 10°C/s (d) 20°C/s |
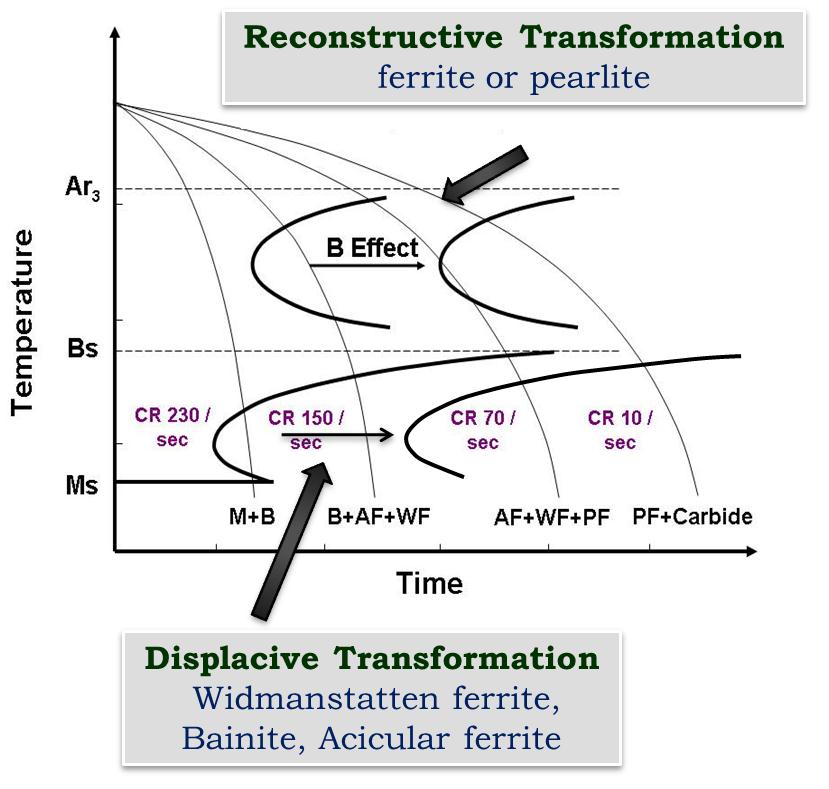 | Figure 8. Schematic representation of boron on pronounced effect of upper C curve |
4. Conclusions
- • Both austenitising temperature and cooling rate are critical in influencing the hardenability of boron added steel.• In unalloyed boron containing steel, no bainite/ martensite was formed even at cooling rate of 70°C/sec, whereas formation of theses phases occurred at much lower cooling rate of 20°C/sec in low alloyed boron added steel.• It is not boron alone but its synergistic effect in presence of carbon, manganese, chromium has resulted in significant change in hardening behaviour of steel.
ACKNOWLEDGEMENTS
- The authors thankfully acknowledge the guidance and support extended by the management of Research & Development Centre for Iron and Steel during the course of this work. Contribution by Ms Smriti Ojha, National Institute of Foundry and Forge Technology, Hatia, Ranchi during carrying out experiment is also acknowledged with thanks.