-
Paper Information
- Paper Submission
-
Journal Information
- About This Journal
- Editorial Board
- Current Issue
- Archive
- Author Guidelines
- Contact Us
International Journal of Metallurgical Engineering
p-ISSN: 2167-700X e-ISSN: 2167-7018
2012; 1(6): 130-134
doi:10.5923/j.ijmee.20120106.07
Nickel Stabilized Zirconia for SOFCs: Synthesis and Characterization
 Abstract
 Reference
 Full-Text PDF
 Full-text HTML
Ezzat S. Elshazly, Omar A. A. Abdelal
Metallurgy Department, Nuclear Research Center, Atomic Energy Authority, P.O.Box 13759, Cairo, Egypt
Correspondence to: Ezzat S. Elshazly, Metallurgy Department, Nuclear Research Center, Atomic Energy Authority, P.O.Box 13759, Cairo, Egypt.
| Email: |  |
Copyright © 2012 Scientific & Academic Publishing. All Rights Reserved.
Nanocrystalline tetragonal zirconia is commercially very significant material which finds extensive use as an anode material in SOFCs, as a catalyst oxygen sensor and structural material. Nanocrystalline zirconia powders for high performance anode of SOFCs have been synthesized by co-precipitation route. This technique is very helpful for the promotion of the stabilization of tetragonal phase of ZrO2 in nano level at moderate temperature. The main objective of this paper is to stabilize the t-ZrO2 through precipitation route using NH4OH solution. The processing features and the microstructural characteristics of NiO-ZrO2 have been investigated by DSC-TG, XRD, SEM, and IR spectroscopy.The concentration of nickel-salt plays an important role for the enhancement of stabilized tetragonal phase at moderate temperature. From XRD results it was found that the t-ZrO2 was more stabilized with 20 mol% nickel-salt concentration compared with 40 mol% Ni-salt at the same temperature.
Keywords: Ni stabilized ZrO2, Synthesis, Co-precipitation Route
Cite this paper: Ezzat S. Elshazly, Omar A. A. Abdelal, Nickel Stabilized Zirconia for SOFCs: Synthesis and Characterization, International Journal of Metallurgical Engineering, Vol. 1 No. 6, 2012, pp. 130-134. doi: 10.5923/j.ijmee.20120106.07.
Article Outline
1. Introduction
- Solid oxide fuel cells (SOFCs) are environmentally friendly energy conversion systems to produce electrical energy with minimal environmental impact[1-4]. The efficient operation of SOFC anode is strongly depends on its microstructural parameters such as particle size, composition and spatial distributions of the constituent phases. Most present SOFCs developers use yttria-stabilized zirconia (YSZ) as electrolyte, strontium-doped lanthanum manganite (LSM) as cathode and Ni-YSZ ceramic metallic composite (cermet) as supported anode materials[5-7]. Ni-YSZ cermet is an electronic conductive material formed during the SOFC stack operation by the reduction of NiO-YSZ used at the anode site during cell fabrication process. NiO-YSZ is an insulating material and its complete reduction to Ni-YSZ is necessary to assure good anodic performance. Ni-YSZ cermets have been used as SOFC anodes mainly due to their high electronic conduction, good electrochemical performance in the intermediate temperature range (750–850oC) and high catalytic activity in reform reactions and the comparatively low cost of nickel[7-8]. During the chemical reaction occurs between NiO and ZrO2, the ionic radius of Ni+2 being relatively small compared to the size of ZrO2 and this gives rise to a solid-solution of nickel oxide and zirconia. The particle size of nickel oxide has a great effect on the stabilization of tetragonal phase of zirconia[9-11]. The formation of the tetragonal solid-solution of NiO2-ZrO2 is believed to be due to the smallness of grains, hence, the enhanced surface reactivity and diffusion of the atoms at the surface. In general, the stabilization of tetragonal/cubic phase of zirconia has been found to be dependant on many parameters such as ionic size of dopant, valency, electronegitivity etc.[12]. The presence of the tetragonal phase is due to the effect of either the dopant concentration or the grain size of the dopant. The formation of the tetragonal solid solution of NiO-ZrO2 is believed to be due to the smallness of the grains, hence, the enhanced surface reactivity and diffusion of the atoms at the surfaces[13-14]. In general, stabilization of the tetragonal/cubic phase of ZrO2 has been found to be dependent on many parameters such as ionic size of the dopant, valence, and electronegativity[15]. Till today, so many works have been done to obtain the high temperature cubic phase and tetragonal phases in a thermodynamically stable at low temperature using different synthesis techniques like sonochemical, hydrothermal, chemical precipitation and sol-gel etc. In this paper, we are emphasis on the synthesis and stabilization of tetragonal zirconia by varying the Ni-salt concentration. Thermal, structural, microstructure analysis and as well as IR spectroscopy were carried out
2. Experimental Procedures
2.1. Synthesis
- Nano sized particles of Ni stabilized zirconia particles was prepared through co-precipitation technique using NH4OH solution. An aqueous solution of 1M (where M is the molarity) concentration of Zr-salt (ZrOCl2.8H2O) were prepared from high purity Zr-salt which is highly acidic in nature (having a pH=0.3), while the pH of NH4OH solution was found to be 12.83 which is highly basic in nature. NH4OH solution was added drop wise to a beaker containing 1 M(1-x) mol% Zr-salt and 1Mx mol% Ni-salt (NiCl2.6H2O)[where x = 0, 20 and 40] solution with constant stirring by a magnetic stirrer. A gel was formed and excess addition of NH4OH solution leads to precipitation was allowed to settle out. The precipitate was washed with hot water for several times to remove chlorine from solution. The precipitate was dried at 80℃ for 24 hours. The obtained dried sample was crushed and grinded to obtain very fine powder. The fine powder was calcined at 700℃, 800℃ and 900℃ for 1 hour. The whole preparation process is schematically illustrated in Fig.1.
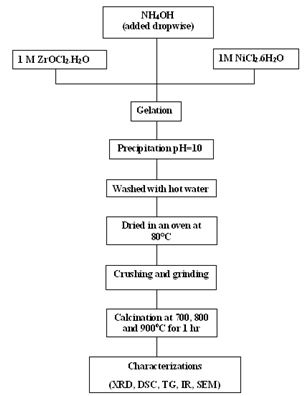 | Figure 1. Schematic diagram of the preparation of Ni-doped ZrO2 powder |
2.2. General characterization
- Thermal decomposition of ZrO(OH)2 gel to an amorphous ZrO2 powder followed by its reconstructive nucleation of t-ZrO2 nanoparticles were studied using thermogravimetric and differential scanning calorimetric (TG-DSC) by heating the sample at 100oC/min in N2 atmosphere in a thermal analyser (Netzsch, STA 449C). Alpha alumina was used as reference material. Phase analysis was studied using the room temperature powder X-ray diffraction (PW 1830 Diffractometer, Phillips, Netherland) with filtered 0.154 nm Cu Kα radiation. Samples are scanned in a continuous mode from 20o-80o with a scanning rate of 0.04o/sec. Microstructural features were studied using Scanning Electron Microscope (JSM 6480 LV JEOL, Japan). Size of the particles is usually obtained with the help of scanning electron microscopy (SEM). The size corresponds to the mean value of the crystalline domain size of the particles is determined from the X-ray line broadening using Debye-Scherrer formula with correction factor as given below,
 Where β is the angular line width of half maximum intensity, d is is the crystallite size, λ is the X-ray wavelength used, and θ is the Bragg’s angle in degree.
3. Results and Discussion
3.1. Thermal Analysis
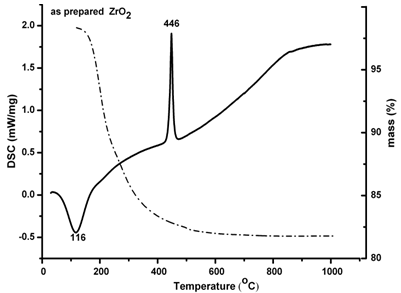 | Figure 2. DSC-TG of pure ZrO2 |
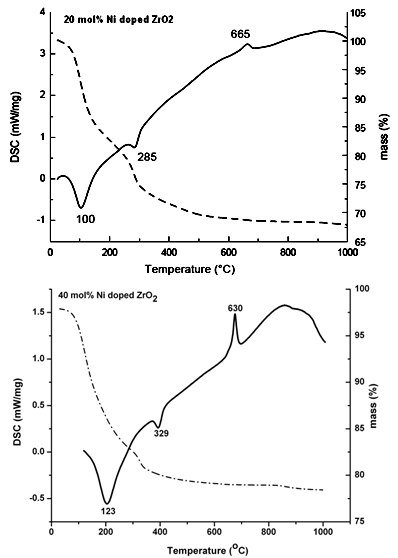 | Figure 3. DSC-TG of 20 mol%, and 40 mol% Ni doped ZrO2 |
3.2. X-ray Diffraction
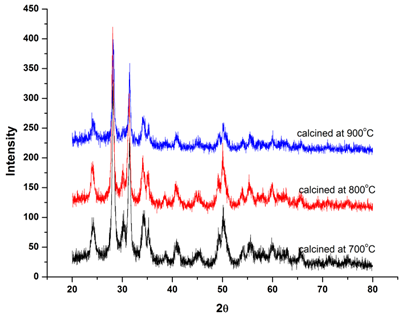 | Figure 4. XRD patterns of pure ZrO2 calcined at different temperatures |
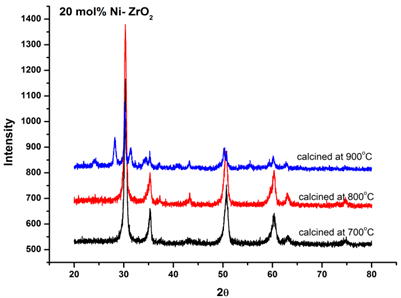 | Figure 5. XRD patterns of 20 mol% Ni doped ZrO2 calcined at different temperatures |
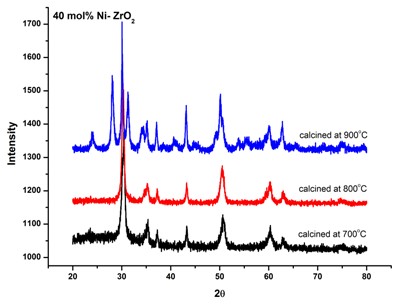 | Figure 6. XRD patterns of 40 mol% Ni doped ZrO2 calcined at different temperatures |
3.3. IR spectroscopy
- Infra-Red spectra in the range of 500-4000 cm-1 for the as-prepared ZrO2 as well as the Ni doped ZrO2 powders with different concentrations were observed. Figure 7 shows the typical IR spectra of both the as-prepared ZrO2 and that calcined at 800℃. On the other hand, figure 8 shows the IR spectra of both the as-prepared 20 mol% Ni doped ZrO2 and that calcined at 800℃. From the IR spectras, it is clearly shown that the as-prepared powders reveal that the ZrO2 nano powders have a significant amount of surface-adsorbed H2O molecules has been assigned at 3401and 3446 cm-1 for the as prepared and the calcined ZrO2 respectively. While the as-prepared ZrO2 as well as Ni doped ZrO2 that calcined at 800℃ shows Zr-O vibration as observed at 740 and 680 cm-1.The size, shape and agglomeration behaviour of Ni doped ZrO2 was obtained by using scanning electron microscopy (SEM). Fig. 9 (a), (b) and (c) show the microstructural SEM secondary and backscattered images of the as prepared ZrO2, 20 mol% Ni doped ZrO2, and 40 mol% Ni doped ZrO2 powder respectively. The particle size was found to be nearly spherical and agglomerate in nature.
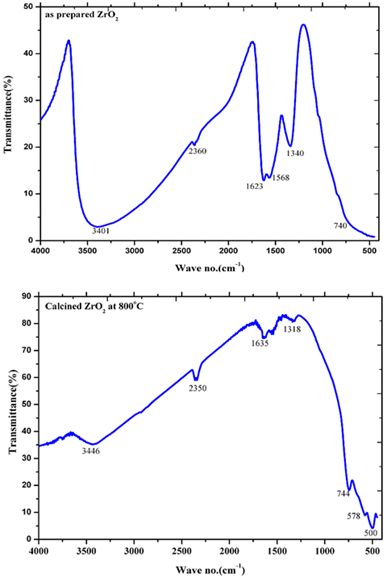 | Figure 7. IR spectra of as-prepared ZrO2 and calcined ZrO2 at 800℃ |
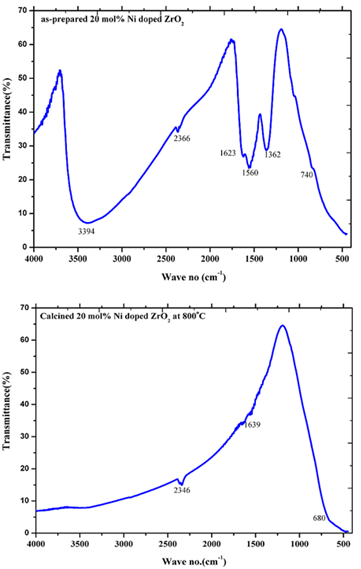 | Figure 8. IR spectra of as-prepared 20 mol% Ni doped ZrO2 and calcined 20 mol% Ni doped ZrO2 at 800℃ |
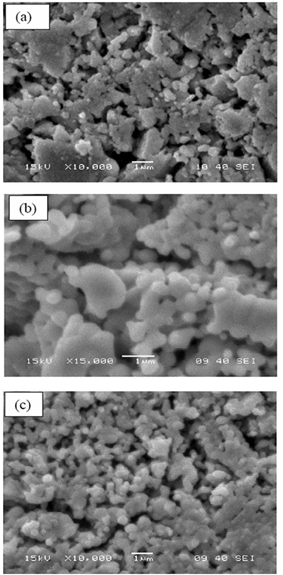 | Figure 9. SEM images of (a) ZrO2, (b) 20 mol % Ni doped ZrO2, and (c) 40 mol % Ni doped ZrO2 |
4. Conclusions
- Co-precipitation route using NH4OH has been successfully employed to synthesis nonocrystalline Ni-ZrO2 powder for SOFCs. Characterization by X-ray diffraction and IR spectroscopy confirmed the presence of nanocrystallite phases of NiO and ZrO2. Stabilization of metastable t- ZrO2 is observed at 20 mol% of nickel salt at a calcination temperature of 800℃. From XRD results it has been concluded that small crystallites (27.8 nm) stabilizes metastable t-ZrO2 at intermediate temperature range. Due to the presence of lattice strain above a certain concentration of nickel salt, there is decrease in tetragonal phase.