-
Paper Information
- Next Paper
- Previous Paper
- Paper Submission
-
Journal Information
- About This Journal
- Editorial Board
- Current Issue
- Archive
- Author Guidelines
- Contact Us
International Journal of Metallurgical Engineering
p-ISSN: 2167-700X e-ISSN: 2167-7018
2012; 1(6): 108-112
doi: 10.5923/j.ijmee.20120106.02
Energy Consumption in Indian Non-Ferrous Industries: Need for Bench Marking of Data
 Abstract
 Reference
 Full-Text PDF
 Full-Text HTML
M. Ghosh1, D. De Sarkar2, P. S. Banerjee1, H. S. Ray1
1Department of Metallurgy and Materials Engineering, Bengal Engineering and Science University, Shibpur, Howrah, 711 103, India
2Indian Copper Development Centre, Kolkata, 700 016, India
Correspondence to: M. Ghosh, Department of Metallurgy and Materials Engineering, Bengal Engineering and Science University, Shibpur, Howrah, 711 103, India.
| Email: |  |
Copyright © 2012 Scientific & Academic Publishing. All Rights Reserved.
Being an energy-intensive industry, the energy usage pattern in the non-ferrous metal industry merits close observation with the intention to bring down specific energy consumption for all metals. United Nations Industrial Development Organization (UNIDO) has taken up extensive programmes for international benchmarking, based on data available from individual industries of various countries. Major producers of non-ferrous metals across the globe have initiated measures to reduce energy consumption per unit weight of product at important production steps and have gained substantial benefits. Adoption of superior technology has been shown to also mitigate emission of toxic gases. Extensive Reports and Reviews, particularly from the European Union countries and organizations such as International Aluminium Institute, have made available extensive verifiable data on the energy usage by the member countries. However, although the non-ferrous metal sector in India has been on expansion mode, the industry in general is reluctant to publish data on energy usage in various plants and measures to mitigate emissions. The actions of concerned government agencies in this direction are neither transparent nor available in public domain. Extensive and verifiable data for each step of production can identify Best Practice Technology (BPT) as a first step, based on which subsequently benchmarking standards for energy consumption can be arrived at.
Keywords: Non-ferrous Industry, Energy Benchmarking, Best Practice Technology
Cite this paper: M. Ghosh, D. De Sarkar, P. S. Banerjee, H. S. Ray, "Energy Consumption in Indian Non-Ferrous Industries: Need for Bench Marking of Data", International Journal of Metallurgical Engineering, Vol. 1 No. 6, 2012, pp. 108-112. doi: 10.5923/j.ijmee.20120106.02.
Article Outline
1. Introduction
- There has been growing global concern on the rise in energy consumption in industrial sectors in particular, and the resulting adverse impact on environment. With current industrial growth average temperature of earth’s surface is expected to rise by 2°C by 2030 and the associated undesirable effects are unavoidable. This concern is reflected in a number of Energy Surveys based on statistical data collected from various industrial sectors conducted by individual countries. Special mention must be made on the survey conducted by United Nations Industrial Development Organization (UNIDO)[1] on global industrial Energy Efficiency in a number of specific manufacturing sectors, published in 2010. According to this Report, an energy usage of 127 Exo-joules (EJ=1018J) in 2007 can be used as a starting point to project the energy demand in the coming decades. Reports indicate that it is possible to save about 24 EJ in a year, provided adequate and in-depth information on energy usage in each sector is considered. Various surveys admit that adequate data is not available for specific industrial manufacturing sectors in many countries, including Indian non-ferrous metal extraction industries. Identifying the Best Practice Technology (BPT) at the beginning and its wide application can bring immediate benefits for each industry. Lack of adequate data base is a major obstacle for analysis of energy usage in a given industry and comparison between plants manufacturing similar products.The specific energy consumption (Gcal per ton of crude steel) for leading steel making companies in India can be found in reports and literatures[2]. These figures clearly provide a clear picture about the trends in energy consumption and other related issues. Unfortunately similar data is not available for Indian industries producing Al, Cu, Zn, Pb etc. although a major portion of energy is consumed through them.
2. Critical Importance of Need for Energy Reduction
- Extraction of Non-ferrous metals to obtain marketable products, because of the very nature of the mineral resources and thermodynamic stability of the compounds of the metals, involve energy intensive processes. On top of that, these industries are the sources of tremendous amount of direct pollution due to noxious gases due to the fact that many non-ferrous metals such as copper, lead, zinc and nickel are obtained from sulphide minerals; and indirect pollution in terms of CO or CO2 emitted. In addition, since unlike iron, the non-ferrous metals, except aluminium, are obtained from relatively lean ores, tremendous amount of energy consumption is involved in the mineral dressing circuit. Relatively less attention has been paid towards analyzing energy consumption pattern in individual steps such as in comminution and concentration circuits to produce concentrates from ores of non-ferrous metals. The EU sponsored Sector Report[3] on Non-ferrous metals industry, which gives break-up of GHG and CO2 emission, starts the analysis from processing of concentrates. Emissions and energy usage pattern in mineral dressing to produce the concentrate, has not yet been taken into account.Canadian Industrial Energy End-use Data and Analysis Centre (CIEEDAC)[4] has been performing remarkable task of collecting, collating and analyzing detailed industrial production data, including the usually neglected area of mining. According to CIEEDAC Report of 2011, comparison of data between 1990 to 2009 on energy usage and GHG emission shows that energy consumption had decreased by 10.6% with corresponding reduction of GHG emission by 9.5 % by proper energy survey and subsequent adaptation of the recommended measures. Such detailed data analysis, as reported by European paves the way for comparing energy usage data for plants with similar technology so as to identify the Best Practice Technology (BPT), which in turn, can be the basis of Benchmarking
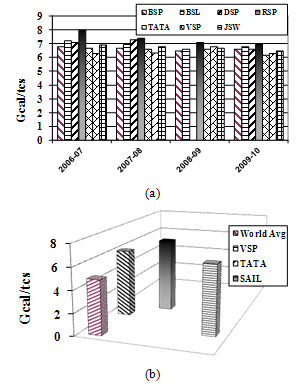 | Figure 1. Specific energy consumption trends in Indian Steel industries (b) Comparison of specific energy consumption levels of an image with acceptable resolution |
3. Technology Upgradation, GHG Emission and Non-ferrous Metal Industries
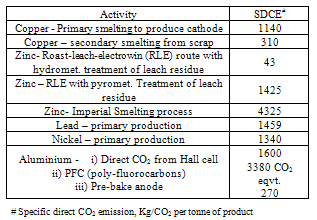
- Another fall out of increasing production of non-ferrous metals sector is the soaring carbon foot print. The Bureau of International Recycling (BIR), in its report in 2008[5,6] estimates a ‘carbon footprint’ of more than 1100 kilo tons of CO2 for non-ferrous metals sector. Similar data. presented elsewhere[3] show a larger scatter, which is expected because of difference in metal values in the concentrates, the fuel used, especially the usage of electricity, the technology used etc. It is interesting to note that the Imperial Smelting process (ISP), although an efficient process of treating lead-zinc sulphide concentrates after agglomeration, involves a high degree of CO2 emission because the smelting process involves carbothermic reduction. Table 1 shows specific direct CO2 emissions for various non-ferrous metals at different levels of their production.
|
4. The Scenario in India
4.1. The Prospect of Non-ferrous Industry
- There has been a spurt in the non-ferrous metal industry in India after the sector was thrown open for private enterprises. The increase in production of the four primary non-ferrous metals is shown in the following Table 2:
|
5. Steps Taken by the Industry to reduce Energy Usages
5.1. Aluminium
- Energy and alumina costs represent the largest components for the global aluminium industry. Energy costs represent around 30 per cent of the total smelting cost of aluminium and around one-third of total alumina production costs. Table 3 shows the cost of energy required for aluminium production in India. During 2002-06, energy costs have increased drastically due to increase in crude oil prices. In India, the energy cost represents 40 per cent of manufacturing cost for aluminium and 30 per cent for finished rolled products.
|
5.2. Copper
- Sterlite a major producer of copper, in its ‘Sustainability Report’ of 2010-2011[14] anticipated energy reduction steps, but details are not available.
5.3. Zinc
- Zinc production unit of HZL Vedanta Resources at Vizag reported specific energy consumption of 4400 kwh per tonne of zinc in 2006, which is lower than the figure of the year 2003-04 which was 4471 kwh per tonne of zinc. HZL had reduced energy consumption by (a) improvements in design in the cell house, adopting steps to reduce impurity content of leach liquor, straightening the anode, using spacers between anodes (b) better control of leaching circuit (c) making the motors, pumps and compressed air system more efficient by using better equipment, plugging leakages etc.An important initiative on Energy survey had been undertaken by Indira Gandhi Institute of Development Research, Mumbai[10], focusing on specific metal industry sector. It is noted that the steel industry in India, in general, has displayed awareness for energy assessment in different units in the line of the international practice. However, such a survey is required for the non-ferrous metal sector for which organized energy analysis is not adequate. It is hoped that the concerned Ministry of the Government of India, through the Bureau of Energy Efficiency (BEE) would obtain detailed and authentic data from each plant for the purpose of comparison so that Best Practice Technology (BPT) can be identified as a first step.
6. Conclusions
- The importance of energy survey as a basis of preparing a data base for determination of parameters of benchmarking cannot be over-emphasized. Reduction of overall energy consumption as well as “energy intensity” (the energy consumption per unit of output) is critical for India.In view of the prospect of upward swing in production of metals in India in the near future, emission of gases which pose health hazard to the public would also increase inevitably. In view of this, there should be complete transparency in the data base for energy usage, gaseous emissions, and solid and liquid wastes.The Government should ensure the active involvement of academic institutions and similar bodies in the national drive for energy consumption which has been proved to be effective in other countries, even though there may be initial reluctance of the industries