A. Kh. Embaby
Faculty of Engineering, Mining and Petroleum Dept., Al-Azhar University, Cairo, Egypt
Correspondence to: A. Kh. Embaby , Faculty of Engineering, Mining and Petroleum Dept., Al-Azhar University, Cairo, Egypt.
| Email: |  |
Copyright © 2021 The Author(s). Published by Scientific & Academic Publishing.
This work is licensed under the Creative Commons Attribution International License (CC BY).
http://creativecommons.org/licenses/by/4.0/

Abstract
In this investigation, the effect of time on variation of oil tank thickness using the geographic information systems (GIS) and geostatistical analysis. The variograms were created to describe the spatial variability of the tank thickness. The chosen models were used to create a corrosion map through creating many layers using GIS. ArcInfo 9.3 software package was used to achieve this study.
Keywords:
GIS technique, Corrosion, Variograms, Prediction modeling
Cite this paper: A. Kh. Embaby , Integrated GIS and Geostatistical Analysis for Evaluation of Corrosion in Oil Steel Storage Tank, International Journal of Materials Engineering , Vol. 11 No. 1, 2021, pp. 1-5. doi: 10.5923/j.ijme.20211101.01.
1. Introduction
Geographic Information Systems (GIS) are important aspects of spatial data infrastructure, and they are also a robust and integrated software system [1-3]. The GIS systematically combines sciences such as graphics, imaging, geology, geography, remote sensing, mapping, artificial intelligence, and computer science. GIS is used in many areas, including geology, oil, oceans, remote sensing, urban and regional planning, surveying, water supply systems, and management of communication facilities, gas, transportation, electric power, agriculture and irrigation, and extinction of fires. Epidemics, land resources, disaster monitoring, regional crops, trade, transport, tourism, ecology, environment and population subsystems. The role of GIS in these applications is to provide users and decision makers with effective tools to solve complex, disorganized or semi-structured spatial problems [4-8]. A steady supply of oil and gas for points of export or processing is required for the oil and gas industry. Lines and line components will suffer from material degradation changes in in fluid compositions, pressures and temperatures. This degradation of materials leads to the loss of mechanical properties, such as resistance, ductility, impact resistance, etc. This leads to loss of material, thickness, and sometimes to final destruction [9-12]. Corrosion of pipelines, pressure vessels and storage tanks is a major problem in the petrochemical and nuclear industries. In these industries, pipelines, pressure vessels, and tanks often transport hazardous or valuable liquids. The environmental and economic consequences of any leaks can have serious consequences. Structures requiring verification are often large and partially accessible [9]. Verification and maintenance strategies for damage detection can be costly, and economic planning is a must [13]. Recent advances in the GIS field will provide new possibilities for engineers to examine corrosion spatial distribution. Mineral thickness mapping is the key procedure for identifying ideas and hypotheses for this problem in different geographical regions.Additionally, proper visualization of spatial structure and corrosion can help managers to solve the problem and assess the safety factor. geostatistical analysis are used in GIS to evaluate unknown sample properties among known sampling points. The two most commonly used methods are kriging and conditional modeling. Both methods calculate sample property values based on specific weight values of sample values in close locations [13]. Great efforts have been devoted to develop engineering models to predict corrosion degradation in terms of determinism and probability. Sadawy et al. [9] studied the change in thickness of the oil reservoir as a single region using geostatic analysis. An attempt was made to study the change in the thickness of the oil reservoir by dividing the reservoir into three separate regions to study similarities and changes in different regions [13].
2. Experimental Work
2.1. Material
In the present study, a steel oil storage tank (T-3510A) used for oil to El-hamra terminal, Western desert, Egypt, was used. The tank consists of nineteen plates every pate has nine meters long and 2.4 meters width which was arranged through the tank shell in three courses. The tank having a chemical composition of C 0.21%, Mn 1.5%, S 0.045% and Fe balance.
2.2. Ultrasonic Measurements
The ultrasonic measurements were carried out by Krautkramer DM4 at fixed intervals of 1.2 m ×4.5 m (Figure 1). The ultrasonic thickness gauge was calibrated before reading by standard calibration block with variable thickness.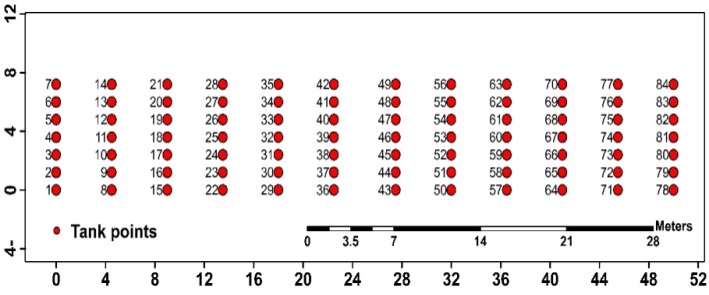 | Figure 1. Location map of tank points with point numbers |
2.3. GIS Database for Corrosion in Steel Storage Tank
The process of finding the locations that represent the different thicknesses of steel storage tank is important process in petroleum industry, which helps in the predication of the corrosion by using the optimum method. The database of corrosion in steel storage tank built in GIS ArcInfo 9.3 software. Whereas these maps are considered as the base map to which all thematic data are spatially linked. In This map, there are 84 tank point locations as shown in Figure. 1. The following steps were performed to achieve our study:1. The 84 tank point locations data associated with study storage tank is imported to Microsoft Excel 2012 software and exported in dbf (data base file) extension to ArcInfo 9.3 software. Then the point features (point locations) and associated tables are generated and converted to shape file.2. Creating interpolated TIN (Triangulated Irregular Network) for 84 tank point locations, which are consistent with the prediction of corrosion tank by using 3D Analyst menu.3. Converting the interpolated TIN for each year at 2004, 2006, 2008 and 2010 to raster. Then convert this raster to grid of points.4. The shape file of all converted points is created by join the grids of points of corrosion steel storage tank based on spatial location.5. Using GIS query to find the locations that high and low corrosion tank thickness.
3. Results and Discussions
3.1. Statistical Analysis
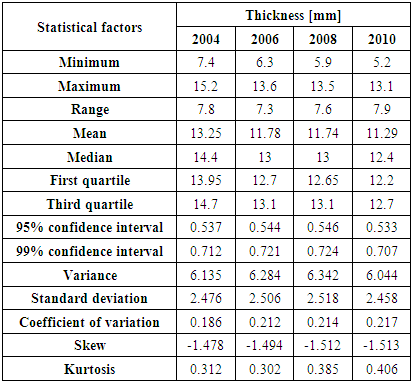
In order to obtain elementary knowledge about the thickness of steel tank and cheek the type of distribution and homogeneity, statistical analysis was carried out as shown in Table 1. The mean values of the data sets were 13.25, 11.78, 11.74 and 11.29 mm. for years of 2004, 2006, 2008 and 2010, which were close to the median values that were 14.4, 13.0, 13.0 and 12.4 respectively. The coefficient of skewness is relatively high (-1.47, -1.49,-1.512 and -1.513) for data set respectively, indicating that the histograms are approximately a symmetric for all yeas. The very high values of the coefficient of variation reflect the fact that the histograms have a tail of high values. This behavior represents the concentration of corrosive ions or water which allows increasing the electro chemical reaction in selective zone and hence increasing the corrosion rate.Table 1. Summary statistics of oil storage tank thickness measurements
 |
| |
|
3.2. Spatial Dependence Analysis
The semi variogram measures the regionalized spatial variability of  where
where  is the coordinate vector at each of the observation points
  for the variable
  The empirical semi variogram
  is defined as half the average quadratic difference between two observations of a variable separated by a distance vector h [9,13]:
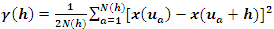 | (1) |
The commonly four theoretical semi variogram models were fitted to the experimental semi-variogram as measured below [9]:Spherical model: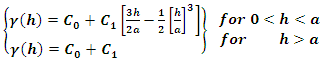 | (2) |
Experimental model: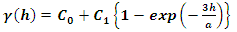 | (3) |
Gaussian model: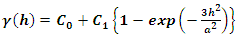 | (4) |
Power model: | (5) |
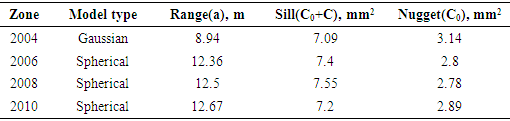
Estimation of the experimental variogram was undertaken for each sample at different time to enable identification of spatial variability in thickness. Different types of semi variogram models used to fit the data Figures (2-5). The Gaussian model had the best fits for year 2004 while Spherical model was the best for other years. Table 2 shows the parameters of the fitted models to the variograms constructed. It can be seen form Table 2 that all variograms have a nugget effect values and high range of influences. This behavior indicates that the variables under study have moderate spatial dependence and high continuity at long scale, but continuity tend to be less at short scale. Table 2. Parameters of spherical and Gaussian variograms models
 |
| |
|
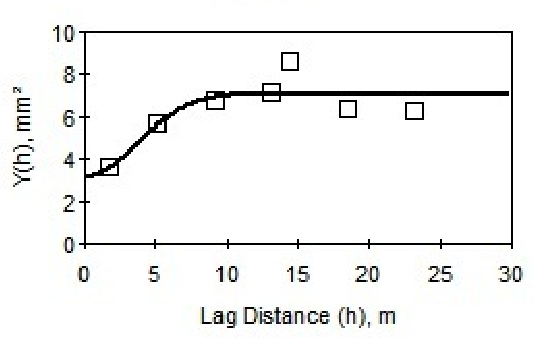 | Figure 2. Gaussian variogram model for oil steel tank thickness at year 2004 |
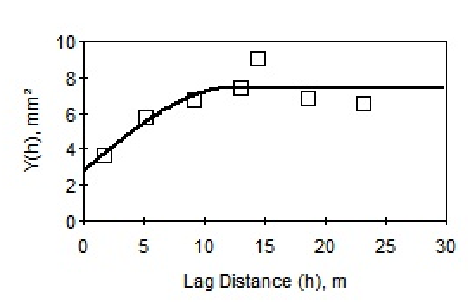 | Figure 3. Spherical variogram model for oil steel tank thickness at year 2006 |
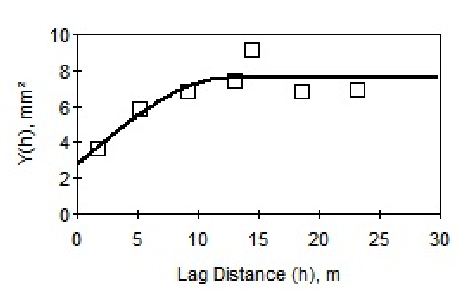 | Figure 4. Spherical variogram model for oil steel tank thickness at year 2008 |
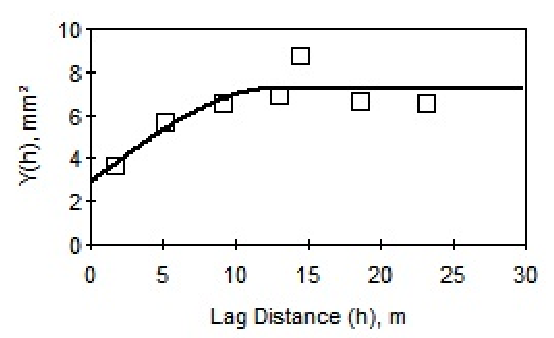 | Figure 5. Spherical variogram model for oil steel tank thickness at year 2010 |
4. TIN (Triangulated Irregular Network) Map of Corrosion Tank Map after 6 Year from 2004 to 2010
The obtained semi variogram models were used in GIS to estimate unknown sample properties between known sampling locations. Ordinary Kriging (OK) calculated sample property values based on weighting values assigned to sample values in nearby locations. The OK prediction,  is defined as [9]:
 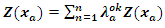 | (6) |
With the constraint that the weights,  sum to 1 to ensure an unbiased prediction:
 | (7) |
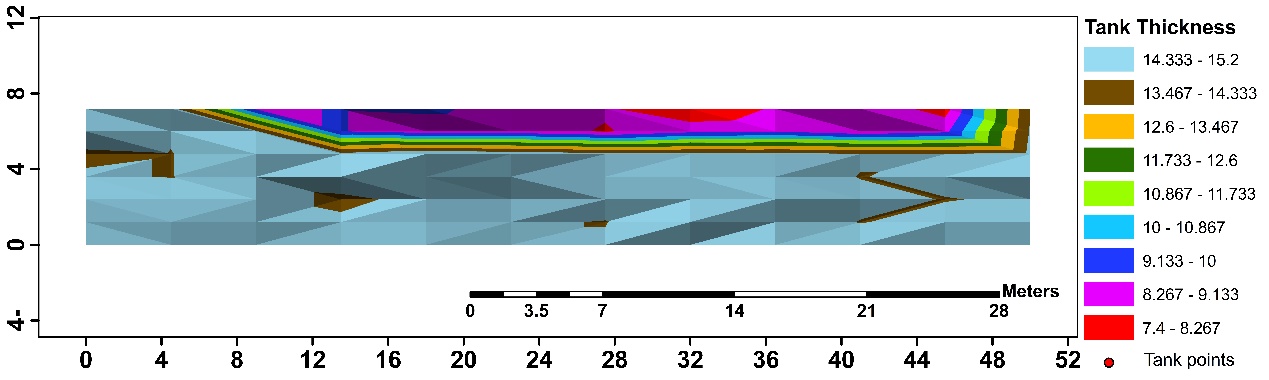
Figures. 6-9 indicates TIN maps of thickness in steel storage tank which was predicted by GIS during the periods of 2004-2010. The locations of high and low thicknesses in steel storage tank and their distribution in the tank body can be determined clearly. As shown in Figs. 6-9 the thicknesses of the tank varied with time from 2004 to 2010, indicating the selective corrosion in the different zones, especially in the zone ranged from 14.333 to 13.467 mm. This behaviour shows the concentration of the corrosive sulphur ions. Hence this can help project engineer to predict the high and low corrosion in steel storage tank as well as helping in decision-making if the tank will be necessary treatment or no.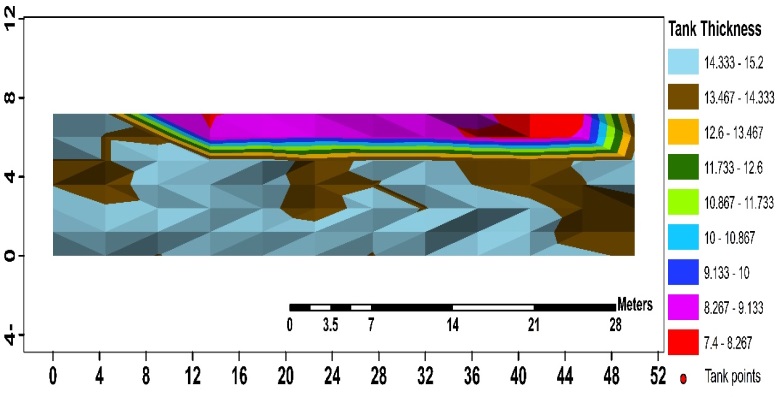 | Figure 6. Tank thickness at 2004 |
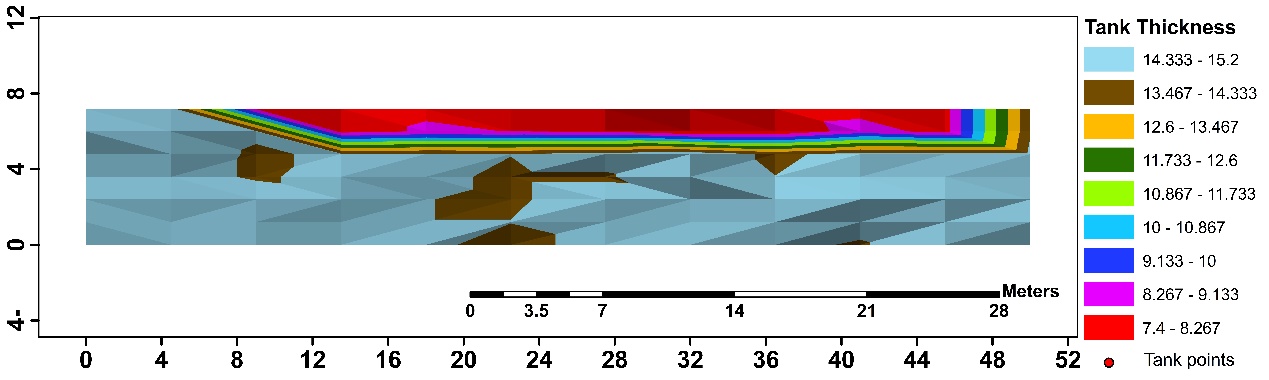 | Figure 7. Tank thickness at 2006 |
 | Figure 8. Tank thickness at 2008 |
 | Figure 9. Tank thickness at 2010 |
5. Conclusions
1- The integration of GIS-based approaches and geostatistical analysis are valuable when performing spatial studies for predicting corrosion in steel storage tank.2- Modeling the thickness of steel oil tank using geostatistical analysis and GIS indicated that TIN map of tank thickness satisfactorily matched the observed tank thickness values. 3- Characterization of spatial dependence by estimating the experimental and theoretical semi variograms indicated that the Gaussian model was generally the best for year 2004 while spherical model described the tank thickness for the other years.
ACKNOWLEDGEMENTS
The author would like to gratefully thank ass. Prof. M.M. Sadawy and Dr. H.A. Farag, staff members in mining and petroleum Dept., Faculty of Eng., Al-Azhar University, Egypt. Due to help me and guidance to complete and achieve this research.
References
| [1] | A.K. Abd ELRahem, B.Gomaa and M. El-Nokrashi. Creating Data Base For Um Salamah-Elsibaiyyah-East Nile Valley Phosphate Ore By Using Geographic Information System To Assist In Mining Process Management. Al-Azhar University Engineering Journal, AUEJ, ISSN 1110-6409, Egypt, volume 9, No. 33, October 2014, p.1548 – 1566. |
| [2] | Abdel Rahem Khalefa Embaby and Maqsad Gojamanov. Application of GIS technology to predict the iron ore deposit in the Nasser area of Egypt. Bulletin of the Kazakh National Technical University, Almaty, ISSN 1680-9211, Kazakhstan, July 2010, No. 4 (80), p. 75-79. |
| [3] | A. Kh. Embaby and A.F. Ismael "Chloride Distribution Modelling by Using GIS and Geostatistical Techniques for Ghorabi Mine Area". 13th International Conference of Al- Azhar Engineering, Cairo, Egypt, Dec. 23-25, 2014. |
| [4] | Yosha Ragbirsingh & Wendy Norville “A Geographic Information System (GIS) analysis for trace metal assessment of sediments in the Gulf of Paria, Trinidad” Rev. Biol. Trop. (Int. J. Trop. Biol. ISSN-0034-7744) Vol. 53 (Suppl. 1): 195-206, May 2005. |
| [5] | A. A. Arafat, and M. H.Gojamanov "Creating Information Systems for Leading Cadatstre of Mining Industry in Egypt". 11th International Conference on Mining, Petroleum and Metallurgical Engineering (MPM11), Sharm El-Sheikh, Egypt, pp682-693, 2009. |
| [6] | B. G. Mousa, A. Kh. Embaby and M. El-Nokrashy Osman. GIS technology for El Gedida iron ore to satisfy the requirements of Egyptian blast furnace. International Journal of Scientific & Engineering Research (IJSER), ISSN 2229-5518, Volume 6, Issue 9, September-2015, p.08 – 14. |
| [7] | Brad Maguire, Andrew Miller and Gennady Gienko. Elements of Geographic Information System (Gll-01), National Land Service under the Ministry of Agriculture, 2007. |
| [8] | Stuart Rich and Kevin H. Davis. Geographic Information Systems (GIS) for Facility Management. Ifma Foundation, USA, 2010. |
| [9] | M.M. Sadawy , M.A. El ashkar, "Prediction and modeling of corrosion in steel oil storage tank from nondestructive inspection," Journal of Al Azhar University Engineering Sector, 7(4) ( 2012), 42-53. |
| [10] | M.M. Sadawy, "Electrochemical evaluation of duplex stainless steel in sulfuric acid solutions,"International journal of pure and applied chemistry, 7(3) (2012), 255-259. |
| [11] | M.M. Sadawy, "Investigation of alloying elements and nonmetallic inclusions effects on the corrosion and electrochemical behavior of high alloying steel," Journal of Al Azhar University Engineering Sector, 3(9) (2008), 1143-1149. |
| [12] | M.M. Sadawy, T.U. Shirinov, R.G. Heseinov,"Corrosion and electrochemical behavior of martensitic-austenitic stainless steel in hydrochloric acid solutions," International journal of pure and applied chemistry, 6 (3) (2011), 855-861. |
| [13] | M. M. Sadawy, A. F. Ismael, M. A. Gouda. Geostatistical Analysis for Corrosion in Oil Steel Tank. American Journal of Science and Technology. Vol. 2, No. 2, 2015, pp. 38-42. |

 Abstract
 Reference
 Full-Text PDF
 Full-text HTML