Sinebe J. E.1, Chukwuneke J. L.2, Omenyi S. N.2
1Department of Mechanical Engineering, Delta State University, Abraka, Nigeria
2Nnamdi Azikiwe University, Awka, Nigeria
Correspondence to: Sinebe J. E., Department of Mechanical Engineering, Delta State University, Abraka, Nigeria.
| Email: |  |
Copyright © 2019 The Author(s). Published by Scientific & Academic Publishing.
This work is licensed under the Creative Commons Attribution International License (CC BY).
http://creativecommons.org/licenses/by/4.0/

Abstract
This paper evaluates the implications of interfacial energetics on mechanical strength of fiber reinforced polymer matrix. The methodology involved extracting fiber from plantain pseudostem by means of the manual scraper and was treated with nine (9) different probe liquids; acetone, acetylation, glycerol, methanol, mercerization (NaOH), MEKP, hydrogen peroxide, potassium permanganate, phosphoric acid. The fiber was prepared with the objective of molding cylindrical shape for mechanical test samples with continuous and unidirectional aligned fibers. Contact angle measurement was carried out in all the treated and untreated samples using two different probe liquid; water and glycerol. Matlab software tools were used in the mathematical analysis of the data generated from the experiments. The average surface energies for untreated fiber and all the treated fiber value are positive and the value of untreated fiber is greater than all the treated fiber. MEKP and mercerization treated fiber has the lowest surface energies (31.2428mJ/m2 and 31.5483mJ/m2 respectively) which mean that the treatment will have the best possible bonding. The average change in free energy of adhesion for untreated and treated fiber is all negative indicating that van der Waal force is attractive. MEKP and mercerization treatment has the higher energy of adhesion (-45.8592mJ/m2 and -46.1778mJ/m2 respectively) when compare with the untreated fiber (-40.3752mJ/m2) but phosphoric acid has value (-37.8042 mJ/m2) lower than untreated value which reveal low bonding mechanism and it show that the treatment chop up the fiber during treatment processes. Tensile test was conducted and the results reveal that untreated fiber has the average value of 171.29N/mm2 lower than all the treated fibers except phosphoric acid and potassium permanganate. This shows that tensile strength increases as the interfacial surface energy of adhesion increases. Decrease in surface energy corresponds to increase in hydrophobicity of the surface which in turn leads to increase in fiber/matrix bond and hence the enhancement of fiber/matrix integrity. The results of this work are very important in structures that are made with fiber reinforced composite materials, such as, aeroplane and car bodies.
Keywords:
Adhesion, Interfacial energetics, Mechanical strength, Plantain fiber, Polymer matrix
Cite this paper: Sinebe J. E., Chukwuneke J. L., Omenyi S. N., Implications of Interfacial Energetics on Mechanical Strength of Fiber Reinforced Polymer Matrix, International Journal of Materials Engineering , Vol. 9 No. 1, 2019, pp. 1-7. doi: 10.5923/j.ijme.20190901.01.
1. Introduction
In the last decade, much attention has been on fiber-reinforced polymeric matrix composites. These composite materials are both versatile and complex. Their versatility stems from a wide range of constituent materials available and from the variety of ways in which composites can be produced to provide a combination of desired properties (Li et al, 2007). They are complex by virtue of their chemical and mechanical nature and thus should not be regarded as a single material, but as a material system. Inherent in this multi-phase material system is the fiber/matrix interface which is the critical link that provides the structural integrity for the fibrous composites (Baley and Grohens, 2004).Generally, the adhesion at the interface can be described by a combination of physical adhesion (which also controls wettability of the fiber and the matrix), chemical bonding and mechanical interlocking created on rough fiber surfaces (Defoirdt et al, 2010). When only physical interactions are analyzed, then the interfacial strength of a composite can be related to the surface energies of the fiber and the matrix in a given system. Good interfacial adhesion initially requires a good wettability between the fiber and the matrix (Jeffrey et al, 2011), to achieve an extensive and proper interfacial contact; wettability mainly depends on the surface energy of the two materials (Poosforush et al, 2013). The fiber’s surface chemical composition also plays a vital role in obtaining a good fiber-matrix interface. However, the hydrophilic nature of natural fibers reduces their potential as reinforcing agents (Trujillo et al, 2010) due to low interfacial interactions with certain important hydrophobic thermoplastic matrices (Wambus et al, 2003), such as polyethylene and polypropylene, leading to poor interfacial strength (Lai et al, 2005).Previously, not much emphasis had been given to fibre/matrix interfacial free energy and surface energetic effects in the study of composites. Most researchers have used NaOH treatment of fibers (Siregar et al., 2010) to render the surface of the fiber hydrophobic (Ticoalu et al, 2010). Not much has been done to assess the usefulness of other treatment liquids in this regard. The measurement of hydrophobicity of the treated fibers relating this measurement to tensile strength of the composite and surface morphology will be addressed in this research. This paper is therefore aimed at determining the implications of interfacial energetics on microstructure and mechanical strength of fiber/reinforced polymer matrix.
2. Materials and Methods
2.1. Materials
The basic raw materials used in this research include the following:I. Plantain Fiber (Pseudo-stem): Plantain pseudo stem fibers used as obtained from a local plantation in Patani, Delta State, Nigeria. The pseudo stems were collected after the matured fruits of plants were harvested. The plants were about 10–12 months old, the roots and the plants were both healthy. The pseudo stem samples of each plantain plant were taken from the petiole and at 20cm above ground surface. After collecting pseudo stems, longitudinal sections were cut and the samples were unsheathed. During this operation, each layer is separated and core of the pseudo stem was discarded. This part (approximately about 26% of the total weight of the plant) corresponds to the floral stem, responsible for supporting the fruit (bunch). That part was discarded since it is non-fibrous and the material breaks during the extraction process.II. Polymer MatrixThe specific unsaturated polyester resin used for the study was manufacturedby NCS resins, a South African company. Its density was found to be 1.967g/cm3. Polyester resins are used predominantly with glass fibers in the production of SMCs or sheet moulding compounds, which are used in high volume compression moulding of components made with glass fiber reinforced polyester.
2.2. Methods
I. Plantain Pseudo-stem Fiber Extraction The fibres were extracted by means of the manual scraper method. This entailed slicing the stem into shorter lengths of about 60cm. The various layers or rings forming the plantain stems were peeled out in small strips about 2 cm wide and 60cm long. Using the blade of a blunt cutlass; each strip was held tightly against another plantain trunk (used as a work surface) and pulled sharply through. This stripped the non-fibrous part of the stem from the fibres, leaving them hanging free and clean. The process was repeated for each strip pulled from the stem, and the resulting fresh plantain fibres were bundled together. The fibres were then washed in water and dried out in the sun for three days. These are as depicted in colour in figure 1.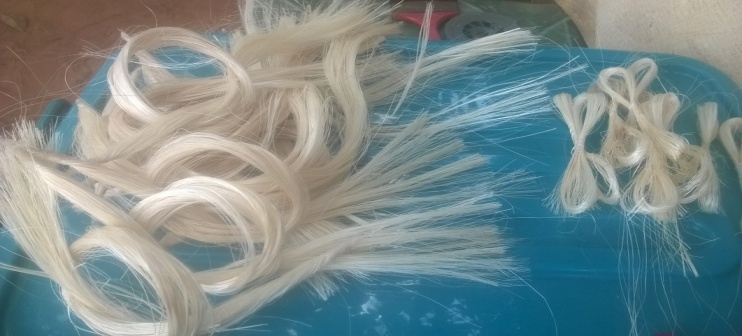 | Figure 1. Extracted Plantain Pseudo Stem Fiber |
II. Preparation of Fibers for TreatmentProcedure: The fibres were prepared with the objective of moulding cylindrical mechanical test samples with continuous and unidirectional aligned fibres. In order to achieve compatibility of results across method of treatment, the fibres were measured and cut to exactly the same length (50cm). Ideally, counting the fibres would be a perfect way of ensuring that all mechanical test samples contain the same number of fibres, and thus ensure that mechanical behaviours under load are comparable. So, the option was taken to weigh the fibre strands instead, and ensure that each fibre bundle for use in moulding mechanical test samples weighed the same. In each case, the fibres were bundled together until the desired weight of the bundle was achieved. The internal diameter of the polyethylene hose used as the mould is about 6 mm. The bundle was cut into a carefully measured length of 50cm, folded into a circle, placed on an acrylic plate, and weighed on the balance. The following measurement was recorded; weight of acrylic plate = 3.190g, weight of acrylic plate + fiber = 3.299g, and weight of fiber = 3.299g – 3.190g = 0.109 g. The rest of the fibers were then cut into lengths of 50cm, and fiber bundles of equal mass with the first set (0.109g) were weighed out. Each 0.109g bundle of plantain fiber had its ends fused together using hot plastic glue from the electric glue gun. A total of two sets of fiber bundles were weighed out for each fiber treatment category, as well as for the untreated control group of fibers. A little extra quantity of fibers was left aside for each treatment category, to be used for fiber tensile tests and photomicrography. Bundles were labeled and set aside for treatment. III. Fiber TreatmentsThe following treatment was carried out to render fiber surfaces hydrophobic to enhance bonding: Alkaline treatment (Siregar et al., (2010), Acetone treatment (Samal, (2012), Acetylation treatment (Dhanalakshmi et al., 2013; Bledzki et al, 2008), Hydrogen peroxide treatment, Methanol treatment (Aleksandra et al., 2011), Phosphoric acid treatment (Irene et al., 2012), Potassium permanganate treatment (Dhanalakshmi et al., 2013).IV. Fiber Contact Angle Measurements Procedure: Contact angle measurements were performed using a special digital microscope, essentially an apparatus consisting of an HD colour CMOS sensor, high speed DSP. The setup was designed to allow magnified pictures of single fibers to be taken using a digital microscope during the experiment. For liquid/fiber contact angle, the test was carried out using fabrication of a special slide made with acrylic sheet. A single fiber was taped onto the slide, over a hole drilled on the slide. A microliter syringe was used to apply a small drop of the liquid to the fiber sample, midpoint over the hole. The setup was placed under a special digital microscope and brought into focus. Micrographs were then taken. Each of water and glycerol was used as probe liquid for the study; the droplet volume was small enough to avoid impact effect on the surface and gravity effect was negligible. The process of spreading was captured with a high digital microscope and the images edited and printed. The contact angle was measured carefully with a protractor at the solid-vapour, solid-liquid and liquid interface. The matrix (unsaturated polyester resin) contact angle measurement was also carried out.
2.3. Mechanical Tests
I. Moulding of Tensile Test SamplesProcedure: A plywood board was leaned against a wall and pre-cut lengths of polyethylene hose were nailed vertically onto it—one nail at the top, and another at the bottom. A small piece of cloth was cut out using a pair of scissors and soaked with mould release wax (petroleum jelly). This cloth was tied to one end of the copper wire and the other end was inserted into the hose. Using this wire, the waxed piece of cloth was pulled through the hose from its other end, and thus the internal wall of the hose was coated with wax for easy release of the cylindrical polyester test piece. The bottom end of the hose was sealed using an electric glue gun, and after cooling, a mix of polyester resin and it’s activating agents (catalyst and accelerator: MEKP) were gradually injected (using a syringe) into the hose until it had been filled completely. The setup was left for 3 days to cure properly, after which the hose was cut up and the test piece extracted.II. Moulding of Test Samples of CompositeThe decision was made to mould cylindrical samples due to the greater potential for accuracy. Moulding of test samples containing treated and then untreated fibres follows the procedure: The fibre bundles were attached to another length of copper wire at their glued ends. The pultrusion funnel was inserted into the top end of the polyethylene hose nailed to the plywood board. The fibre bundle was then thoroughly wetted with activated polyester resin and pulled into the hose using the copper wire. The bottom end of the hose was then quickly sealed using hot glue from the electric glue gun, and the setup left to stand until the polyester cured. In a similar manner to the unreinforced polyester sample described earlier, the samples were extracted and prepared for mechanical tests after having been left to stand for at least three days.III. Tensile Strength MeasurementsTensile strengths were measured on the untreated, mercerized and acetylated plantain fibers to establish the strength at break, according to ASTM (D638) standard. IV. DensityThe densities of fibers were determined for untreated and modified fibers, using testing machine D638 according to the ASTM guidelines.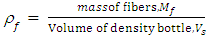 | (1) |
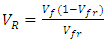
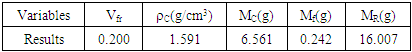
Volume fraction of plantain fiber was achieved as recorded on table 1 using the expressions below: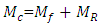 | (2) |
 | (3) |
 | (4) |
 | (5) |
 | (6) |
 | (7) |
Where: plantain pseudostem fiber density = 1.360 (g/cm3),  = mass of composite specimen, (g);
  = mass of plantain fiber, (g);
  = mass of resin, (g);
  = Density of plantain fiber = 0.129g/cm3;
  = Density of resin = 1.967g/cm3;
  = Volume of composite specimen (cm3);
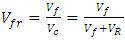
  = Volume fraction of fiber;
  = Volume of resin (cm3);
  = Volume of plantain fiber (cm3).
 Table 1. Masses of fiber and Resin data for Design volume Fraction
 |
| |
|
2.4. Theoretical Considerations
I. Interaction EnergiesInterfacial free energies are obtained from the contact angles using Young’s equation | (8) |
Where;  and
and  refer to the interfacial energies of the liquid/vapour, solid/vapour and solid/liquid interfaces.Fowkes relates the Young’s equation (8) for the calculation of surface free energies and proposed that;
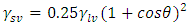 | (9) |
Equation (9) can be used for the calculation of interfacial free energies.Neuman’s equation of state (Neumann et al 1983), derived from the fundamental thermodynamics relations is given by;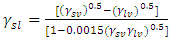 | (10) |
The free energy of adhesion of fiber (f) to the matrix (m) can be written as:  | (11) |
Where f = fiber and v = vapour (air), m= matrixThe interaction energy, in terms of the Hamaker Coefficient can be expressed as; | (12) |
Since there is no liquid between matrix and fiber in a composite, the actual surface energies of matrix and fiber in air will be used. Thus, assume that fiber and matrix have made such a contact that the distance is of molecular dimension then a small distance δo = 1.820 Å will be used.Since fiber is cylindrical, surface area of fiber is; | (13) |
If there are n fibers, total surface area is; | (14) |
Therefore; total adhesive energy; | (15) |
3. Results and Discussion
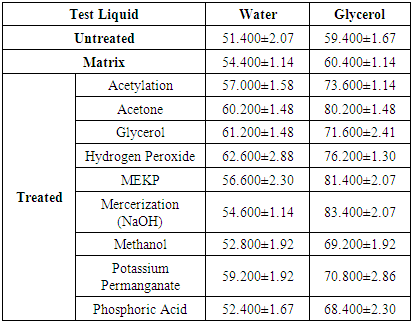
The average contact angles for treated and untreated fiber using nine (9) different treatment liquids for each test liquid are listed in table (2).Table 2. Average Contact Angle data for Treated Fiber, Untreated Fiber and Matrix
 |
| |
|
The results summarized in table (2) clearly indicate that treated fiber has higher contact angle than the untreated fiber for a given fiber treatment, showing that fiber treatment has the tendency to increase the hydrophobicity of the fiber; that is that the treated fibers are poorly wetted. Since the fiber treatment increases the contact angle, it is therefore valid to suggest that fiber treated surface is hydrophobic. Table (2) summarizes the effects of different treatments on the contact angles of fibers. The fiber treated with hydrogen Peroxide gave the highest fiber – water contact angle (62.600±2.88) while phosphoric acid treated fiber gave the lowest fiber – water contact angle (52.400±1.67) but higher than the untreated fiber – water contact angles (51.400±2.07) at about 1.9%. The difference between the highest and lowest fiber – water treatment is about 16.3%. The fiber – glycerol treated contact angles are higher than the fiber – glycerol untreated contact angles at about 18%. Mercerization (NaOH) treated fiber – glycerol gave the highest contact angles (83.400±2.07), followed by MEKP with (81.400±2.07) while Phosphoric Acid gave the lowest fiber – glycerol contact angles (68.400±2.30) but higher than the untreated fiber – glycerol contact angles (59.400±1.67) at about 13.2%. The values of matrix – water and matrix – glycerol contact angle are (54.400±1.14 and (60.400±1.14) respectively. However, treated fiber has higher contact angle than the untreated fiber.
3.1. Surface Free Energies
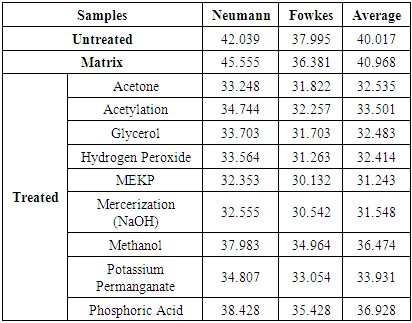
The surface energy is a measure of work done on the surface. When the surface energy is high, the contact angle is usually low for wetting for polar surfaces. But when the surface energy is low, contact angle is usually very high for non-wetting surfaces. The surface free energies determined from contact angle data using equations (10 & 11) for both treated and untreated fiber are summarized in table (3). This averaging is informed by the fact that surface energy is actually independent of the liquids used. Table 3. Summary of Average Surface Energies (mJ/m2)
 |
| |
|
Table (3) shows that the average surface free energies of treated fibers are lower than the surface free energy of untreated fiber (40.017 mJ/m2). That is to say that fiber treatment has the surface energy reducing capacity. The average surface free energies of treated fibers range from 36.928mJ/m2 for Phosphoric Acid treatment to 31.243 mJ/m2 for MEKP treatment. Compared with untreated fiber, MEKP treatment reduced the surface energy of the fiber by 21.84% and that of Phosphoric Acid treated fiber by 7.72%. Mercerization (NaOH) treatment which has frequently been reported in the literature reduced the surface energy of the fiber by 21.16%. Though MEKP has the greatest potential as surface free energy reducing agent (most tendency to render surface hydrophobic), it is not very widely used. This research shows that it hasalmost similar potential as mercerization.
3.2. Change in Free Energy of Adhesion
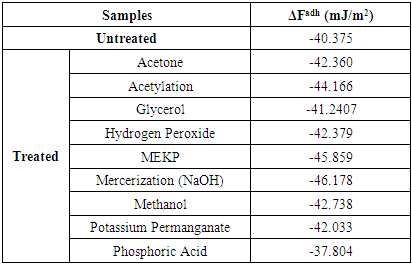
The change in free energy of adhesion was calculated with the average surface free energy data of table 3 in conjunction with the Neumann equation of state (eq.10) and eq. 11. The data are listed in table 4. When the change in free energy of adhesion is negative, the adhesion is thermodynamically favourable. Adhesion is therefore governed by attractive van der Waal forces and hence increases in contact angles. When polyester attaches itself to the surface of the fiber, there is the tendency of the fiber – polyester to be bonded. However, more adhesion leads to more depletion of the fiber and thus, increases in contact angle. Results obtained using different models for the ten samples are shown in table (4). Equations (13) were used to calculate free energy of adhesion and total surface free energy of adhesion.Table 4. Average Change in Free Energy of Adhesion, ΔFadh
 |
| |
|
Table (4) shows that the average change in free energies of adhesion is all negative indicating that the net van der Waals forces are attractive, and gives idea of the strength between the bonding of fiber to the matrix. It is higher for all the treated fibers than untreated fiber showing that treating the fibers to make them hydrophobic increases the bonding between the fiber and the matrix, and probably also the strength of the composite. Treatment with MEKP and NaOH will produce the greatest bond while treatment with Phosphoric Acid will produce the least bonding. Note that the treatments led to the reduction in lignocelluloses and hemicelluloses properties of the fibers. As fiber treatment increases the van der Waals forces of attraction, it minimizes the surface area at the phase boundary. The treatment liquid molecules at the surface will try to reduce the free energy by interacting with the composite particles at the adjacent phase and hence the decrease in surface energy.
3.3. Contact Angle Discussion
Surface energy, change in free energy of adhesion and Hamaker Coefficient are interrelated having been calculated from contact angle data. But in actual sense, the nature of the surface is the determining factor. From the on-going analysis, the fiber – treated surface seems to be hydrophobic “low energy” and this gives rise to increase in contact angles irrespective of the liquid used. Figure (2) explained this relationship. The change in free energy of adhesion increases with increase in contact angle and decrease in surface free energy. The Hamaker coefficient increases with decrease in surface energy. The energies of interaction could be shown in figure (2).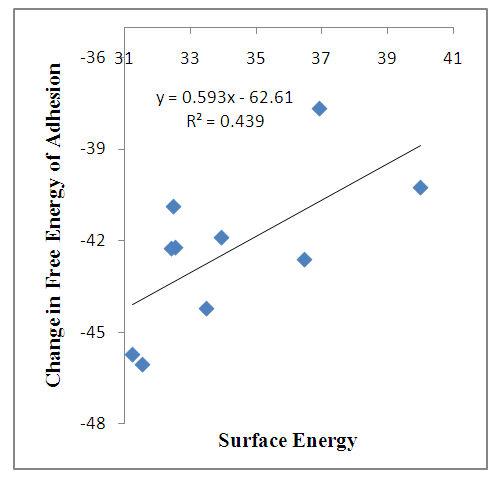 | Figure 2a. Change in Free Energy of Adhesion against Surface Energy |
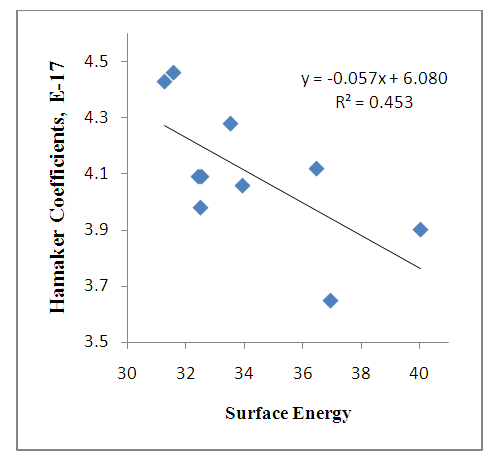 | Figure 2b. Hamaker coefficients against Surface Energy |
Figure (2a) shows that the change in free energy of adhesion increases as the surface energy decreases for untreated fibers. For treated fibers, there is increase in interaction because of the treatment which enhances the bonding between fibers – matrix. Figure (2b) shows that the Hamaker coefficient increases as surface energy decreases for untreated fibers. Here, there is increase in interaction because of the additive(s), which improved the bonding. The energies of interactions tend to decrease at a higher contact angle.
3.4. Strength Analysis
The tensile strength of untreated and treated fibers were determined and presented as shown in table (5) and figure (3). Table (5) shows the effect of strength on all the treated, untreated and unreinforced polyester. It is noted from table (5) that the mercerization MEKP treated samples have the maximum ultimate tensile strength, and from table (4), they also have the highest free energy of adhesion. These results show that the adhesive bonding also leads to increase in tensile strength. Phosphoric Acid treated samples have the lowest tensile strength in agreement with the result of table 4 which gives it the lowest freer energy of adhesion.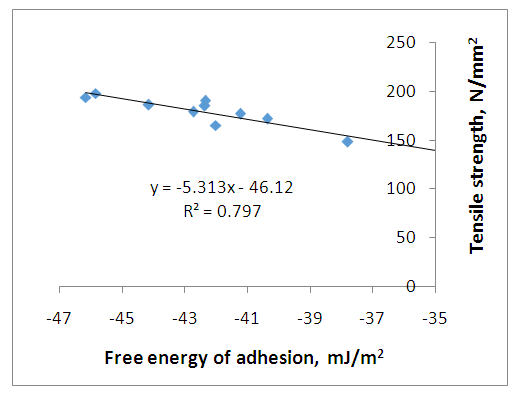 | Figure 3. The effect of adhesive bonding on tensile strength of composite |
Figure (3) shows a plot of the tensile strength as a function of the free energy of adhesion. It is obvious from this figure that increase in free energy of adhesion leads to an increase in tensile strength of the composite. The more negative the energy of adhesion the more the strength of the composite. This is as expected because increase in bonding between fiber and matrix leads directly to increased strength of the composite.Figure (3) shows a plot of the tensile strength as a function of the free energy of adhesion. It is obvious from this figure that increase in free energy of adhesion leads to an increase in tensile strength of the composite. The more negative the energy of adhesion the more the strength of the composite. This is as expected because increase in bonding between fiber and matrix leads directly to increased strength of the composite.Table (5) shows the average relationship among the strength, surface energy and change in free energy of adhesion for the entire treated and untreated specimen. The untreated fiber surface energy gives the highest possible energy. The change in free energy of adhesion is higher in untreated fiber than all the treated fiber. This result reveals possible increase in bonding and energy of adhesion. The negative sign of change in free energy of adhesion shows that there is attraction between the fiber and reinforcement. The decrease in surface energy after treatment reveals that treated fiber reduces the surface of the composite, thereby increases the strength with improved bonding.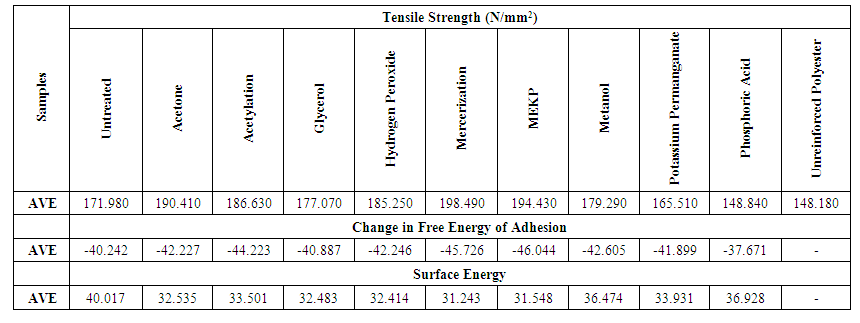 | Table 5. Average Tensile Strength, change in Free Energy of Adhesion and Surface Energy for both Treated and Untreated Fiber |
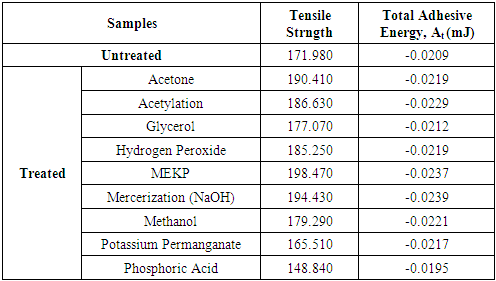
The free energy of adhesion of a particle, originally suspended in the liquid, to the solid/liquid interface is  and since there is no liquid between matrix and fiber, but air before they were brought together. Then, the use of actual surface energies of matrix and fiber in the analysis is important. Thus, assumes that fiber and matrix have made such a contact that there is no space between them, or such a distance is of molecular dimension. Equation (17) was used in the analysis of total adhesive energy for all the treated and untreated fiber composite.Table (6) reveals the interaction effect between the total adhesive energies for both treated and untreated composite with corresponding tensile strength of its composite. The total free energies of adhesion increases as tensile strength increased which revel that improvement in bonding mechanism of the composite is possible and this shows that the bonding mechanism of the composite is relative to the surface properties of the bonding which lead to the determination of the adhesive/bonding strain rate.
Table 6. Summary of Average Total Adhesive Energy (mJ)
 |
| |
|
4. Conclusions
In this study, the contact angle analysis, surface energetic and mechanical tests were carried out on the composite specimen developed showed that interfacial energy can be improved significantly with plantain fiber reinforced polyester composite. Application of Neumann and Fowkes models were used to model for interfacial energy and Hamaker coefficient with their correlation. The mechanical properties of plantain fiber reinforced polyester have been extensively studied and the following are the findings: The plantain fiber reinforced polyester has the average tensile strength of 171.980N/mm2 for untreated and 190.410N/mm2 for acetone, 186.630N/mm2 for acetylation, 177.070N/mm2 for glycerol, 151.62 for hydrogen peroxide, 198.49N/mm2 for mercerization, 194.430N/mm2 for MEKP, 165.510N/mm2 for methanol, 165.510N/mm2 for potassium permanganate and 148.84N/mm2 for phosphoric acid while 148.18N/mm2 for unreinforced fiber polyester. The change in free energy of adhesion shows negative values and increases for all the treated fiber reinforced polyester. It means that the presence of additives as a result of treatment increases van der Waals attractive force and mostly for MEKP and mercerization. The change in free energy of adhesion increases as surface energy decreases. It was observed that Fowkes model gave higher change in free energy of adhesion for both treated and untreated fiber reinforced composite when compared with Nuemann model. The energies of interactions expressed as Hamaker coefficient are all positive and this also validates the claim that the treated fiber adhesion occur between the treatment and fiber.
References
| [1] | Defoirdt N, Biswas S, De Vrise L, Tran N, Van Acker J, Ahsan Q, et al. (2010). Assessment of the tensile properties of coir, bamboo and jute fibre. Composite Part A: ApplSci Manufacturing, 41(5): 588-95. |
| [2] | E. Trujillo, L. Osorio, A.W. Van Vuure, J. Ivens, I. Verpoest, (2013). Composites week @ leuven and texcomp-11 conference: 16-20. |
| [3] | Wambua, P, Ivens, J & Verpoest, I (2003). 'Natural fibres: can they replace glass in fibre reinforced plastics?', Composites Science and Technology, 63(9): 1259-64. |
| [4] | Bledzki A.K., Mamun A.A., Lucka-Gabor M. and Gutowski V.S., (2008). The effects of acetylation on properties of flax fiber and its polypropylene composites, Express. Polym.Lett., 2(6): 413-422. |
| [5] | Siregar J.P., Sapuan, S. M.,Rahman, M. Z. A., and Zaman, H. M. D. K., (2010). The effect of alkali treatment on the mechanical properties of short pineapple leaf fiber (PALF) reinforced high impact polystyrene (HIPS) composites. Journal of Food, Agriculture & Environment. 8(2): 1103-1108. |
| [6] | Samal, S. K., Mohanty, S., and Nayak, S. K, (2012). Banana-glass fiber-reinforced polypropylene hybrid composites: Fabrication and performance evaluation. Polymer- Plastics Technology and Engineering, 48(4): 397–414. |
| [7] | Dhanalakshmi S., Ramadevi P., Srinivasa C. V. and Bennehalli, B., (2012). Effect of chemical treatment on water absorption of areca fiber. Journal of Applied Sciences Research, 8(11): 5298-5305. |
| [8] | Li, Xue; Tabil, Lope g. & Panigrahi, S. (2007). Chemical treatments of natural fiber for use in natural fiber- reinforced composites: A review. J. Polym. Envoron, 15(1): 25-33. |
| [9] | C. Baley and Y. Grohens. (2004). Application of interlaminar tests to marine composites: Relation between glass fiber/polymer interfaces and interlaminar properties of Marine Composites. Applied Composite Materials, 11(2): 77-98. |
| [10] | Jeffrey, K. J. T., Tarlochan, F., & Rahman, M. M. (2011). Residual strength of chop strand mats glass fiber/epoxy composite structures: Effect of temperature and Feasibility study of natural fiber composite material for engineering application water absorption. International Journal of Automotive and Mechanical Engineering, 4: 504-519. |
| [11] | Poostforush M., Al-Mamun M. and Fasihi M., (2013). Investigation of Physical and Mechanical Properties of High Density Polyethylene/Wood Flour Composite Foams, Res. J. Engineering Sci., 2(1), 15-20. |

 Abstract
 Reference
 Full-Text PDF
 Full-text HTML