Carol C. M. e Ferreira1, Hudson C. dos Santos1, Richard Cuevas2, Fernando R. Stucchi2
1Graduation Program in Materials Engineering, Instituto Federal do Piauí, Teresina, Piauí
2Civil Engineer, Escola Politécnica da Universidade de São Paulo, São Paulo, São Paulo
Correspondence to: Carol C. M. e Ferreira, Graduation Program in Materials Engineering, Instituto Federal do Piauí, Teresina, Piauí.
| Email: |  |
This work is licensed under the Creative Commons Attribution International License (CC BY).
http://creativecommons.org/licenses/by/4.0/

Abstract
This study aims to present the description of the Wöhler’s Curve in CA-60 bars which have 8mm of diameter and are used in reinforced concrete for construction, in three levels of stress fluctuation. There are few studies in the experimental analysis of bars through “air bar” testing, especially because there is a lack of Brazilian normative references. It is important to highlight that the CA-60 steel is produced through a cold treatment resulting in a resistance increase to the demands and hardness. This way, this work will contribute to the development of the normative considerations to the dimensioning of reinforced concrete structures. This research is already expanding with the collaboration of tests being carried out at the Escola Politécnica da USP for experimental investigation of the fatigue behavior of this type of bars and steel mesh manufactured in the Southeast region of the country, as well as experimental research of the fatigue behavior of slabs, with or without pre-slabs, using CA-60.
Keywords:
Fatigue, CA-60, Bars, Steel mesh, Slabs
Cite this paper: Carol C. M. e Ferreira, Hudson C. dos Santos, Richard Cuevas, Fernando R. Stucchi, Experimental Investigation to Determine the Wöhler’s Curve in CA-60 Steel 8mm Bars for Application in Slabs, International Journal of Materials Engineering , Vol. 8 No. 2, 2018, pp. 17-22. doi: 10.5923/j.ijme.20180802.01.
1. Introduction
Under a repeated load, the resistance of a sample is reduced and its resistance to failures can be inferior to the static capacity. If a sample group is submitted to flexural stresses with repeated loads, the resistance reduction is proportional to the logarithm of the cycles until failure [1].Among the various structural materials and systems used in engineering in which fatigue occurs, the joint research intends to analyze the behavior of bridge slabs in reinforced concrete using CA-60.Dantas [2] highlights that the researches related to the fatigue effect have been gaining more importance in national and international scenarios. For example, France started to verify fatigue resistance only through Eurocode 2, in 2005, "Design of Concrete Structures", being a demand only in 2010, in a recent update of Eurocode. In Brazil, the consideration of this limit state started to be approached in 1967, at EB3 - "Barras e fios destinados a armaduras de concreto armado", until the latest adaptations at NBR 6118 [3] - "Projetos de Estruturas de Concreto". Although the NBR 6118 [3] brings references about CA-50 steel, that is used in reinforced concrete structures due to its marketing in bigger diameter gauges. CA-60 steel does not have its own normative approach that features its behavior in relation to this fatigue effect, studied here. Other complementary features of CA-60 steel can be found in norms, such as, NBR 7480 [4], and NBR 7478 [5].Fatigue is the structure’s weakening, which, after the application of variable loads in time, cannot resist the acting demands. Around 1850, Wöhler invents the first investigation system through an experimental analysis rotation flexion through the curve S-N (that relates the resistance and the cycle number to the variation of the acting loads). Wöhler’s research was based on the analysis of railway axes that fractured after many kilometers at work. He described that the failure made through fatigue happened in nominal low tension situations in elements with cyclic variations of loads. Wöhler’s Curve is nowadays the main base of analysis of the cyclic load phenomenon [6].The generation of Curves S-N with a reliable degree is from numerous fatigue tests, due to the great dispersion of the results that are usually found. This way, it is possible to observe, the difficulty to make experimental analyses regarding this phenomenon.ACI 215 [7] affirms that bars submitted to fatigue present different behaviors according to diverse features, such as: bending, diameter, splices and tensions. The diameter’s increase ends up reducing the steel’s resistance to fatigue, due to the tension effects in relation to the acting area, and the probability of increasing the defects in the equipment (difference observed better in performing axial tests).The fatigue failure effect is an ultimate limit state (ULS) that depends on the fluctuation of the loads used in service of a reinforced concrete structure. Addressing steel, it usually occurs in inferior resistances to its flow limit. Thus, if a structure has the performance of mobile loads, it can present a failure if it has been verified and dimensioned, considering only the static loads. Caixeta [8] describes that a project which has elements subjected to the fluctuation demands a specific scaling that includes the possible variations of demands until the reliability verification of the steel and concrete materials. It is been observed that experimental studies related to the theme are valid to a better knowledge of materials and to this phenomenon, which has significant incidence in tension fluctuations, both in machines and in structures.In practice, fatigue-related problems did not lead large buildings to ruin, even though they may have variable loads of high intensity and frequency. However, some of its structural elements may be damaged due to their dimensions and connections with the rest of the structure. For this reason, the bridge slab is one of the objects of study.Bridge slabs are structural elements sensitive to high magnitude cyclic loading that can lead to failure or even breakage. Its importance in bridges and viaducts grows due to the greater structural participation in the variable loading to which they are submitted.The tests performed and analyzed in the Northeast region brings important results for comparison purposes and elaboration of design criteria. These results served as a starting point for the tests conducted to complete the study.
2. Objectives
2.1. General Objective
The general objective of this work is to study the behavior of CA-60 steel bars of 8mm diameter, produced in Teresina-PI city. These bars were tested under the cyclic loading action, allowing a comparison between their fatigue resistances. As a complement, this work has as objective to deepen the study of the fatigue behavior of bridge slabs, with or without pre-slabs, of reinforced concrete with CA-60 bars or steel mesh.
2.2. Specific Objectives
• To determine the fatigue resistance to the proposed bars through cyclic tests, produced in Teresina-PI, considering three levels of fluctuation to the active stress variations, according to these initial cyclic numbers : 105, 1x10⁶ e 2x10⁶;• To calculate the coefficient K to CA-60 steel, studied here, that define the drawing that generates the curves;• To expand the experimental investigation of the fatigue behavior of CA-60 steel in the Southeast region of the country;• To investigate the fatigue behavior of concrete and steel in slabs with or without pre-slabs;
3. Materials and Methods
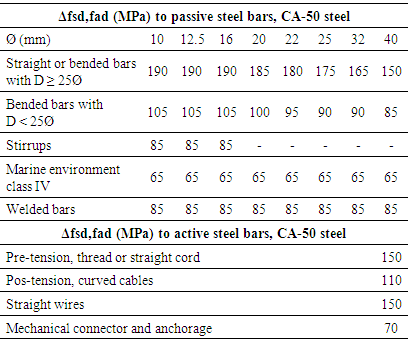
There is no Brazilian norm that guide fatigue tests on air bars to reinforced concrete bars. Researches made in Brazil were elaborated by researchers from USP regarding the fatigue resistance of CA-50 steel. This material has a lower resistance and a higher ductility than CA-60 steel. Due to the lack of researches and norms, a great initial difficulty to fatigue testing is determining the right variation of cycling to be analyzed.NBR 6118 [3] recommends tension variation numbers to a parameter of 2.000.000 cycles. Although, its reference is determined to CA-50 steel, involved by reinforced concrete. (Table 1).Table 1. Fatigue tension variation of CA-50 steel
 |
| |
|
To elaborate the Wohler’s Curve, it will be taken as the basis for the resistance that will define the variation’s amplitude. Based on researches like Dantas [2], the definition of the maximum tension amount will be 80% of the flow featured resistance of the steel statically tested (Figure 1).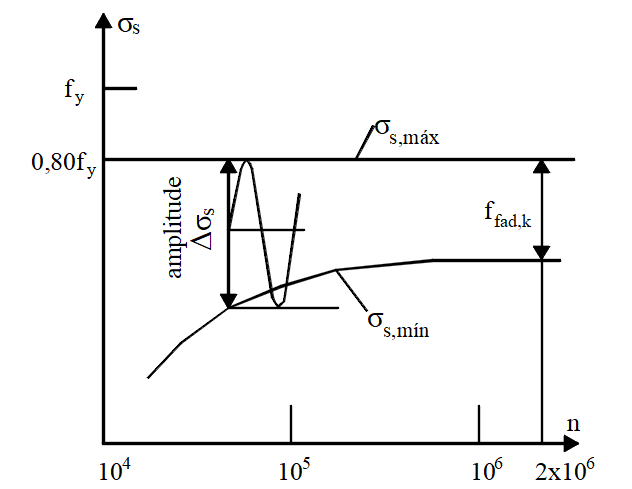 | Figure 1. Tension variation schema |
The recommendation for the adopted frequency to tests in air bars is up until 10Hz. Buelta [9] highlights that the natural frequency of steel vibration is way superior to 10 Hz, justifying the usage of this frequency maximum limit. NBR 6118 [3] also brings this coming graphic related to the number of cycles with applied tension variation, in scale log.log, to CA-50 steel. It describes the Wohler’s Curve graphic defined by two coefficients ‘k’ that determine the curve’s inclination. It is observed a change of ‘k’, in straight, bended bars, or in stirrups, in 1 million cycles. k1 defined to the first inclination zone is 5, according to the Brazilian norm. On the other hand, k2 is 9. This description can be observed in Figure 2, that will be the basis to analyze CA-60 steel studied here, searching for inclination ‘k’ coefficients and for the characteristic of Wohler’s Curve: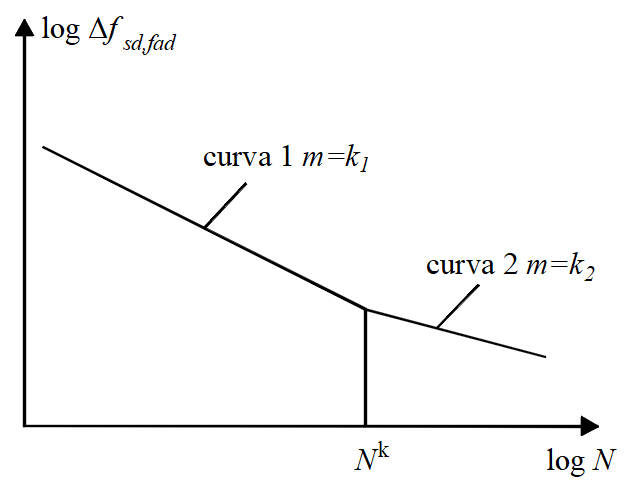 | Figure 2. Curve S-N according to NBR 6118 |
Tests to calculate the CA-60 steel tension variation were made based on the definition of a constant 'k' for the three levels of cycling: 105, 1x10⁶ e 2x10⁶. These fatigue failure tests were made by analyzing initially the prediction of the closest variations to the proposed initial cycling, with the execution of tests that allowed the initial analysis of the 8mm bars of CA-60 steel. With the variations described in the table below (Table 2), it is possible to predict the closest variations of the suggested cycling. Table 2. Fatigue test – Variation tests
 |
| |
|
The tests described were necessary because there was not any normative reference exclusive to variations (and coefficients ‘k’) recommended to CA-60 steel. The coefficients used by Dantas [2] in his research, based on recommendations from the “Bulletin D'Information N 188” [10], were destined to steel with similar characteristics to CA-50 steel. Due to the lower ductility of CA-60 steel, despite its higher resistance, it observed that the adopted variations found in very different levels of fatigue failure.Therefore, 3 variations were adopted to estimate the next failures to the cycling proposed. Addressing the fatigue machine from IFPI, the maximum frequencies permitted to the utilization of each test were analyzed. The testing materials used had 30cm, and the distance between the jaws was 20cm, enabling a little higher frequencies adopted to be found, as the initial length was not very extensive.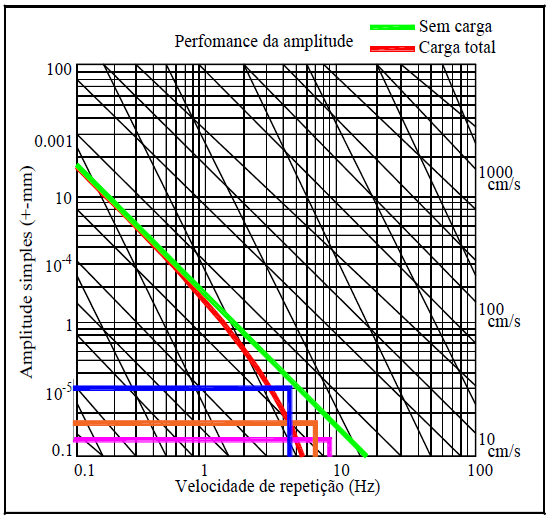 | Figure 3. Fatigue machine graphic |
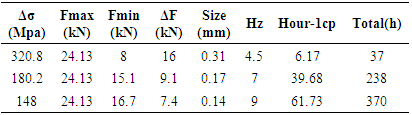
In the graphic of figure 3, it is highlighted in blue the amplitude and the frequency to the variation of 320.81 Mpa (per 10,000 cycle), in orange, to the variation 180.16 Mpa (per 1,000,000 cycles), and in purple to 148 Mpa (to 2,000,000 cycles), that were adopted to the beginning of the tests. In table 3, there is the calculus of the characteristic machine amplitude stretching.Table 3. Adopted variations and its respective frequencies
 |
| |
|
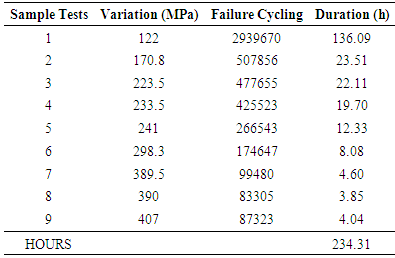
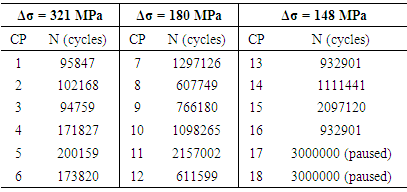
Considering that CA-60 steel has the pattern flow limit of 600MPa = 60 kN/cm². The maximum tension to analyze fatigue is 80% of its flow tension, which corresponds to 48 kN/cm² or 480MPa. To 8mm bar of CA-60 steel, the maximum load to be applied is approximately: As=50.265mm²; Pmax =50.265 x 480 = 24,127 N or 24.13 kN.For the predictions on the initially predicted cyclings, and the permitted frequencies, there is a testing execution total time of 1291.01 horas, if considered uninterrupted, it is approximately 54 days. Although, it is known that the exchange of proof bodies does not have this non-interruption efficiency, due to the necessity of a technician’s constant presence to help the assembly and disassembly of the samples, because of its weight. Besides, during the tests, there were many unexpected problems, even after the definition of the cheeks and the beginning of the tests, due to: power runouts, machine maintenance, producer’s delay in the grant of samples, hydraulic pump repair, difficulties to access the laboratory on weekends and holidays, among others.On Table 4, there are the variations adopted as patterns, cited above, to define the three cycling points that will allow the drawing of the Wöhler’s Curve, and its respective failure results. The variation to the fatigue failure prediction of 2 million cycles still has undetermined characteristics, as it is observable a huge difference and the non-following of proximity patterns in other adopted variations, among the results found. This table presents the failure results to the bars.Table 4. Bars fatigue tests
 |
| |
|
4. Results and Discussions
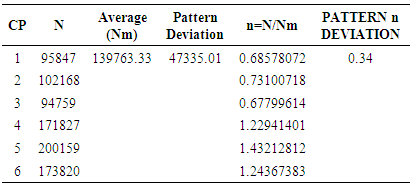
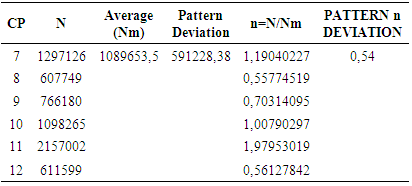
To the data analysis, addressing each adopted variation tension, the average of cycles (Nm) and pattern deviations (S) were calculated, besides the dispersion of data found, through the relation between the average cyclings and the failure cyclings, with the respective pattern deviation.Table 5. Result to the variation of 320 MPa
 |
| |
|
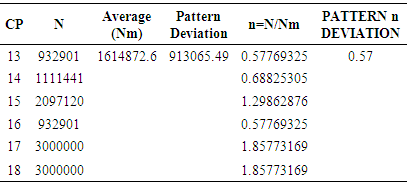
The same analyses were performed to other two adopted variations, observing a higher variation between the results while the number of cycles to verify the fatigue failures of AC-60 bars increased.Table 6. Result to the variation of 180 MPa
 |
| |
|
Table 7. Result to the variation of 148 MPa
 |
| |
|
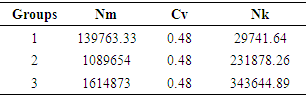
The average to the pattern deviations found to the three groups tested was 0.48. According to the results found, the variability among the fluctuations found in the fatigue tests for CA-60 steel is high. To determine the Wöhler’s curve, the equation highlighted by Dantas [2] to obtain the characteristic amount of cyclings (Nk), was used 95% reliability, which considers the average cycling (Nm) and the variation coefficient: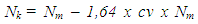 | (1) |
As the variations presented a very high deviation pattern, the Nk result was very low to generate the reliability of 95%. Table 8. Values for Nk to the 3 groups of bars
 |
| |
|
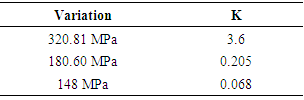
Addressing the coefficients ‘k’ found in the adopted variations, according to the CEB-FIP Model Code 1990 [11].Table 9. K Numbers
 |
| |
|
It is observed that, adopting the formula from CEB-FIP Model Code [11], which indicates to AC-50 steel a ‘K’ of 11.2, CA-60 steel represents way lower values. That happens because of the lower ductility they present. On figure 4, there is a drawing of the Wöhler’s Curve to all tested bars, comparing the results of the Average Curve and Characteristics.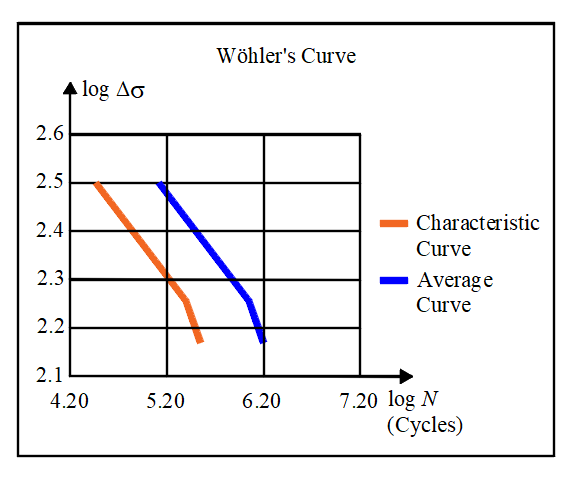 | Figure 4. Wöhler’s Curve for CA-60 |
On figure 5, there is the comparison with the Wöhler’s Curve brought by NBR 6118 [3], that approaches only CA-50 steel. It is observed that the results found have lower resistance values, already expected but that describe an important comparison that will be verified and confirmed with the complementary tests that are being carried out at the University of São Paulo.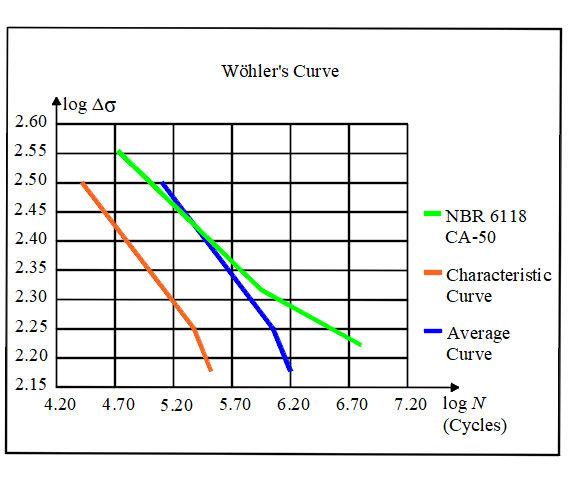 | Figure 5. Wöhler’s Curve CA-60 compared to NBR 6118 |
To check the fatigue of the reinforcement in the bending of the slabs, 18 tests with a loading frequency of 5 Hz are foreseen, whose samples will be divided into slabs with bars and slabs with meshes.Also, 9 shear tests should be performed to verify the fatigue of the concrete, so that a portion will be assembled according to Brazilian practice and another according to previous European tests. These tests will be done at a frequency of 5 Hz.
5. Conclusions
The results of the dynamic tests indicate, until now, a very high pattern deviation, higher than the ones found by Dantas [2] in his tests with the same sample amount of CA-50 steel. The values found for ‘K’ are way inferior to the ones from CEB-FIP Model Code 1990 [11]. Based on the variations adopted, and on the failure cyclings found, it was possible to draw the Wöhler’s curve to the bars. This great variation provided a very big reduction in the results of the characteristic cyclings, considering a reliability factor of 95% for the results. This way, the comparison between the results of the Average Curves and the Characteristic ones of bars, with NBR 6118 [3] which brings the curve to CA-50 steel, the results observed were inferior to the normative guidelines, showing the necessity of greater attention to the behavior of these steel in structures that suffer dynamic loads. Normally, as CA-60 steel is marketed in small gauges, and structures with dynamics loads request steel areas to use higher diameter gauges, there is no usage spread of this typology in large scale. Therefore, it is highlighted the need for broader research on this steel in dynamic structures settings to verify the real necessity of calculus direction, and considerations about this kind of structure scaling. Thus, in order to verify the variability of the behavior of the CA-60 steels obtained in this first step, more tests with this type of steel are being made, based on the proposed cycling, as well as larger cycling using other samples from region and the use of other equipment. Fatigue behavior verification tests on reinforced concrete slabs using CA-60 bars and screens, with or without pre-slab, will also be performed.
References
| [1] | LOYD J. P., LOTT J. L., KESLER C. E. “Fatigue of concrete”. Engineering Experiment Station – Bulletin 499. University of Illinois – College of Engineering. Illinois, 2007. |
| [2] | DANTAS, J. P. R. “Experimental Investigation on fatigue of reinforced bridges Slabs with welded bars or screens.” São Paulo, 2010. Dissertation (Master’s degree) – Polytechnic School from the University of São Paulo. Structure and Geotechnical Engineering Department. |
| [3] | BRAZILIAN ASSOCIATION OF TECHNIC NORMS. “NBR 6118: Concrete Structures Project – procedures”. Rio de Janeiro, 2014. |
| [4] | BRAZILIAN ASSOCIATION OF TECHNIC NORMS. “NBR 7480: Steel destined to armors of concrete structures”. Rio de Janeiro, 2007. |
| [5] | BRAZILIAN ASSOCIATION OF TECHNIC NORMS. “NBR 7478: "Fatigue testing method in steel bars to reinforced concrete”. Rio de Janeiro, 1982. |
| [6] | MENEGHETTI, Leila Cristina. “Fatigue behavior analysis of reinforced concrete beams reinforced with glass, carbon and aramid PRF”. Thesis (Doctorate degree) – Federal University of Rio Grande do Sul. Post graduation Program in Civil Engineering. Porto Alegre: 2007. |
| [7] | AMERICAN CONCRETE INSTITUTE. “ACI 215R-2”: Considerations for Design of Concrete Structures Subjected to Fatigue Loads. Michigan: 1997. |
| [8] | CAIXETA, E. C. “Fatigue experimental Investigation in bridge slabs with or without pre-slabs”. – Dissertation (Master’s degree) – Polytechnic School from the University of São Paulo. Structure and Geotechnical Engineering Department. São Paulo: 2010. |
| [9] | BUELTA, M. A. B. Fatigue Tests in bars made of steel AC-50 of ½ inch to reinforced concrete. São Paulo: EPUSP/LEM, 2001. (Technical Report nº 01/026). |
| [10] | COMITE EURO-INTERNACIONAL DU BETON. Bulletin 188: Fatigue of concrete structures: state of art report. Lausane: 1991. |
| [11] | COMITE EURO-INTERNACIONAL DU BETON. Bulletin 188: Fatigue of concrete structures: state of art report. Lausane: 1991. |

 Abstract
 Reference
 Full-Text PDF
 Full-text HTML