Paulo Ricardo Santos Coimbra1, Andréa de Souza Almeida2, Tiago Hendrigo de Almeida2, Diego Henrique de Almeida1, Eduardo Chahud3, André Luis Christoforo1, Francisco Antonio Rocco Lahr4
1Centre for Innovation and Technology in Composites – CITeC, Department of Civil Engineering (DECiv), Federal University of São Carlos, São Carlos, Brazil
2Department of Science and Materials Engineering, University of Sao Paulo, São Carlos, Brazil
3Department of Civil Engineering, Federal University of Minas Gerais (UFMG), Belo Horizonte, Brazil
4Department of Structural Engineering (SET), University of Sao Paulo, São Carlos, Brazil
Correspondence to: André Luis Christoforo, Centre for Innovation and Technology in Composites – CITeC, Department of Civil Engineering (DECiv), Federal University of São Carlos, São Carlos, Brazil.
| Email: |  |
Copyright © 2018 Scientific & Academic Publishing. All Rights Reserved.
This work is licensed under the Creative Commons Attribution International License (CC BY).
http://creativecommons.org/licenses/by/4.0/

Abstract
Wood is widely used in many sectors of civil construction as a structural material. Brazilian code ABNT NBR 7190:1997 Design of Timber Structures governs the method of project design as well as the characterization of wood for structural design. In this aspect the code considers wood as an orthoptic material, however is well known that the organic origin provides great anatomical complexity to its. This work aims to study the distribution of normal stresses in a Tauari wood beam subjected to the elastic regime, and to ascertain the current position of the Neutral Line during test. For this purpose, a four-point static bending test and subsequent compression and tension to the grain tests were performed to determine the modulus of elasticity and calculate the normal stresses by recording deformations and applying Hooke's Law. The data were statistically analyzed to define bests adjusts to Stress vs. Strain diagrams, and thus determine the location of the Neutral Line. It was verified that the position of the Neutral Line was a normal distribution variable, being located at 1,07cm above the geometric center of the board. Finally, the comparison between values of normal tension obtained experimentally and through the theoretical method was determined and similarities were verified in these data, being also plausible the theory for the calculation of the normal tensions of the wood beams, when it is in the elastic regime.
Keywords:
Wood Beams, Static Bending, Strain, Stress
Cite this paper: Paulo Ricardo Santos Coimbra, Andréa de Souza Almeida, Tiago Hendrigo de Almeida, Diego Henrique de Almeida, Eduardo Chahud, André Luis Christoforo, Francisco Antonio Rocco Lahr, Stress Distribution in Tauari Wood Beam, International Journal of Materials Engineering , Vol. 8 No. 1, 2018, pp. 5-11. doi: 10.5923/j.ijme.20180801.02.
1. Introduction
Wood is a widely used material in civil construction, but still has great potential to be exploited, mainly dealing with it in a most rational way aiming better applications as structural material. However, for the design of timber structures, an important factor is the knowledge of the mechanical properties, because wood is a natural material that presents anatomical complexity making difficult to know its exact performance [1-5].In this aspect, the normative guidelines regarding the design of timber structures are based on ABNT NBR 7190: 1997 "Design of Timber Structures" in its Annex B "Determination of wood properties for structure design", using for this purpose, free defect samples and therefore reduced dimensions, as well as considering wood as an orthotropic material [6-8].However, according to Chahud [9], the inhomogeneity and the high degree of disorder cause complex behavior when compared to the homogeneous materials. Due to the natural origin of this material, wood is subject to several factors of variability such as soil and growth conditions and moisture content, could not be considered homogeneous. In addition, the behavior of wood subjected to the bending is affected by the three different axes of symmetry of the material (radial, tangential, longitudinal) and by the different strengths of the wood to the tension and compression. [10, 11].For the equation of the wood normal stresses distribution in bending, elastic theory is used, which is the most feasible for this purpose. The theory was based up to certain limits of proportionality between stresses and strains, and has three hypotheses to be obeyed: sections remain flat after flexion; material obeys Hooke's Law; and the material should have a linear distribution of Stresses in any cross section, presenting null values in the Neutral Line (NL) and maximum values at the extremities [12]. Thus, the expression for calculating the stresses is given by Equation 1 and the to calculate the modulus of elasticity in four-point bending can be done using equation 2 that are following: | (1) |
 = Normal Stress of tension or compression in the considered cross section;M = Current bending moment;I = Moment of inertia;y = Distance from the fiber to the NL.
 | (2) |
F = Applied force;I = Moment of inertia;fmáx = Maximum deflection;L = Length;a = Distance between points of force application.Genus Couratari trees belonging to the family Lecythidaceae includes several species that have similar anatomical characteristics, color and density. Couratari oblongifolia, Couratari guianenses and Couratari stellate species are called Tauari. These trees have diameter between 45cm and 75cm, being able to reach up to 40m in height. Their trunks have the heartwood and sapwood indistinct by color, presenting coloration between yellow and white. It is a medium density wood, and in addition, it has moderate brightness, slightly bitter taste, medium texture and generally barely noticeable smell. In general, Tauari wood presents medium mechanical strength, moderate smoothness to the machining and presents good finishing and good workability, being favorable the use of these species of wood in depth studies of this material behavior when subjected to stresses [13-15].This work aims to analyze the distribution of normal stresses in Tauari wood beams and study the position of the NL during the elastic phase in four-point bending. In this way, we tried to contribute to the knowledge of the wood elastic constants and to the behavior of the wood beams, and thus, contribute to the evolution of its efficient use.
2. Material and Methods
Tests were carried out at the Wood Laboratory and Timber Structures (LaMEM), Department of Structural Engineering (SET), School of Engineering of Sao Carlos, University of Sao Paulo. The equipment used was the AMSLER Universal Testing Machine with 25000kgf capacity. In addition, 0.001 mm precision deflectometers were used for static bending, compression and tension parallel to the grain tests. Finally, to calculate and analyze results the software Microsoft Excel was used.Sample was a board of Tauari wood presenting dimensions 337.5cm x 37cm x 5.6cm (larger dimension in the longitudinal). It was acquired through supplying wood companies for civil construction in the region of Sao Carlos, being transported to the laboratory at 12% moisture content. This board was subjected to 317.5cm length four-points bending, and the force was applied at two points apart 80cm from each other, and 40cm from the length center as shown in figure 1.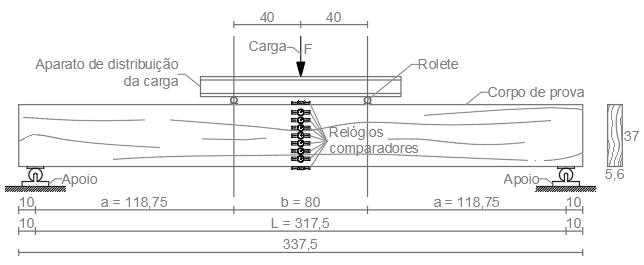 | Figure 1. Bending test setting scheme (Dimensions in centimeter) |
In order to verify possible differences in the modulus of elasticity values obtained on two sample sides, preliminary test was carried out with the maximum deflection limit bring the ratio L/400 (L = 317.5cm), ensuring that the test occurs in the elastic regime. The maximum force applied was 42198N. Then, the test was divided into thirteen stages, starting with 3246N. Force was applied continuously on both sides at 10MPa/min, the deflection values were taken through deflectometers during the thirteen defined stages.After verification of the homogeneity for modulus of elasticity, the beam was subjected to the four-point bending test following the same configuration to determine the position of the NL and the distribution of normal stresses. Nine deflectometes were installed at the length center of the sample according Figure 2, and the Figure 3 shows the test apparatus.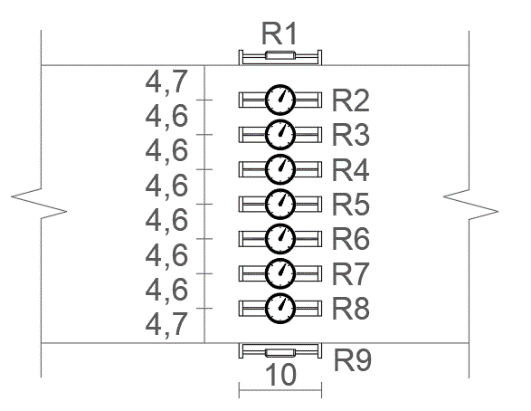 | Figure 2. Deflectometers dispositon (Dimensions in centimeter) |
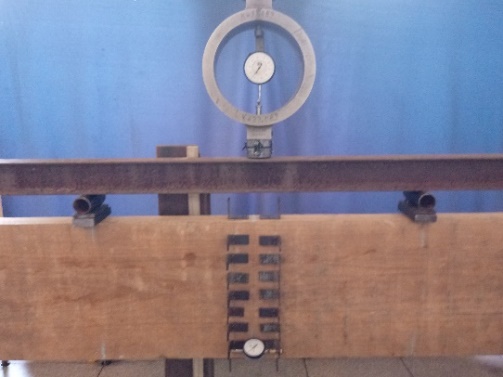 | Figure 3. Test apparatus |
After bending tests were carried out, specimens were removed from the central region of the board to perform the tension and compression parallel to the grain tests. From the upper part, compressed zone, four samples were taken for compression test, while for the tension test, five samples were taken at the lower part. These samples were tested according to the Brazilian code for the determination of the average values of the modulus of elasticity and the Strength values. Figure 4 shows the compression and tension parallel to the grain tests.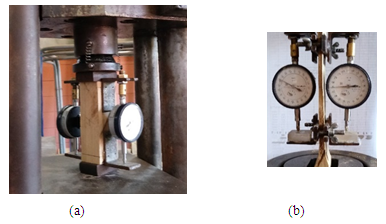 | Figure 4. Samples in Compression (a) and Tension (b) parallel to the grains tests |
Thereafter, the elongation or shortening values measured through the deflectometers in the four-point bending test were combined, and Hooke's Law was used to calculate the normal stresses in the sample at the position of each deflectometer. For this, the average elasticity modulus in compression was used at the locations where there was shortening and the average modulus of elasticity in tension at the locations where there was elongation. Then, the values obtained were related to the deflectometer positions to construct diagrams of the experimental normal stress distribution along the cross section for each of the thirteen stages.Defining the horizontal axis as the normal stresses and the vertical axis as the distance to the center of gravity of the board, we have a graph were negative values of stress are observed for compression and positive values of stress for tension. Moreover, with this conformation the point (0;0) coincides with the sample axis of symmetry.Least squares method was used to propose an adjusted line describing the normal stresses along the sample cross section, and the linear coefficient of the adjusted function representing the distance from the NL to the sample axis of symmetry, and through these values, it was possible to determine the NL current position for all stages. Finally, the normal stress distributions for each test were compared with the theoretical normal stresses values (calculated using Equation 1).
3. Results and Discussion
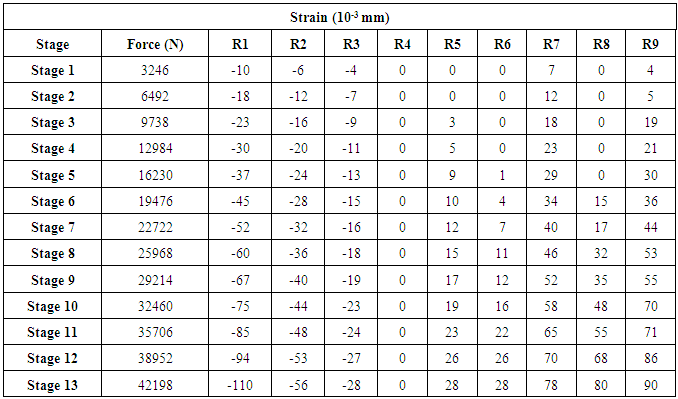
Preliminary tests were carried out to verify possible differences in the values of the modulus of elasticity obtained on both sides of the sample. Through Equation 2 the modulus of elasticity in four-point bending for the two sides were calculated, resulting in 14623MPa and 14574MPa, therefore, both sides of sample had less than 1% of difference in modulus of elasticity.After the preliminary test, deflectometers were placed according to methodology. Table 1 shows the results of the elongation or shortening recorded in the nine deflectometers for each stage. Table 1. Strain recorded in the 100 mm static bending test
 |
| |
|
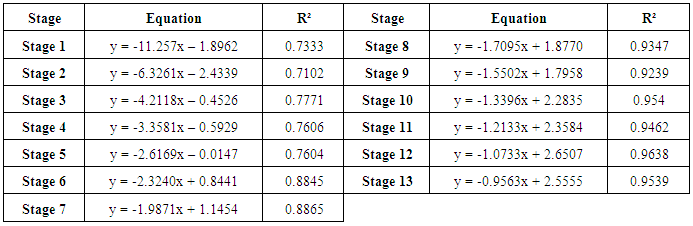
There was an unusual behavior of the deflectometers 6 and 8, which recorded null values of elongation during the first four stages. However, this did not occur with deflectometer 7, despite repeated measurements. This fact may have occurred due to the accommodation of the fibers during the initial stages, since the elongation occurred later with the application of greater forces.Four specimens were removed from the compressed zone of the sample to perform the compression parallel to the grain tests, as well as were removed 5 samples from the tension zone for the tension parallel to the grain tests according to the Brazilian code. The average values of modulus of elasticity and strength were 18384MPa and 52.8MPa, respectively to the compression tests, and 142.5MPa and 19643MPa, respectively to the tension tests.Stress distribution data were grouped for the thirteen stages. Figure 5 represents the distribution of stresses for the Stage 6 (as an example) for all deflectometer positions, calculated using the average modulus of elasticity in tension or compression and the Hooke's Law. It was replicated for all stages. Negative signals indicate compression stresses, positive signals indicate tension stresses and the position of the deflectometer is given from the sample axis of symmetry (0,0). Compilating the data, in Table 2 is shown the equations and the coefficient of determination (R²) of each stage.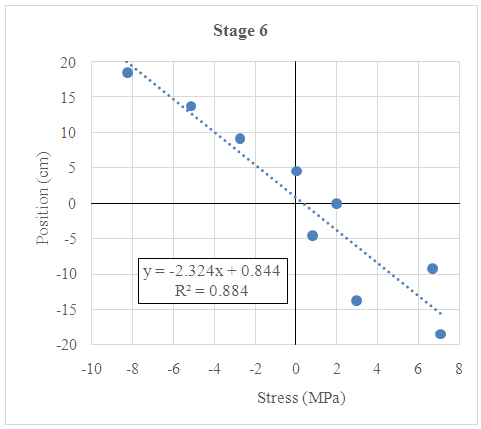 | Figure 5. Stage 6 Stresses distribution |
Table 2. Summary of results for all stages
 |
| |
|
Assuming the values of the linear coefficients for the thirteen stages, we obtained the distribution of the NL position. Figure 6 shows the results of the Anderson-Darling normality test on the NL position values along the cross-sectional height of the sample. 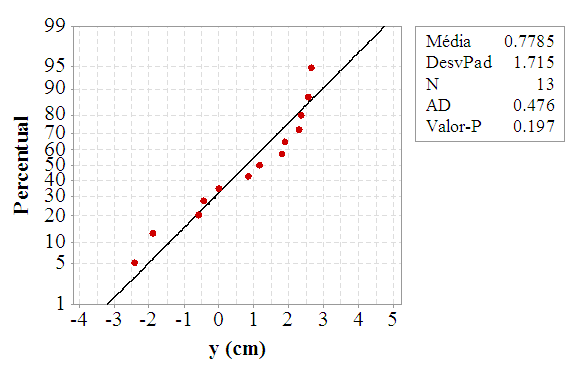 | Figure 6. Anderson-Darling normality test result to current NL location to all thirteen stages |
Then the normality in the NL position distribution along the cross-sectional height (P-value> 0.05), of average equal to 1.07cm, has been proven. The confidence interval [CI] (95% confidence) for this respective probability distribution resulted in IC = (0.14; 1.99 cm), as shown in Figure 7.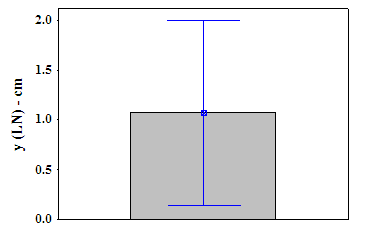 | Figure 7. NL average value and confidence interval (95% confidence) |
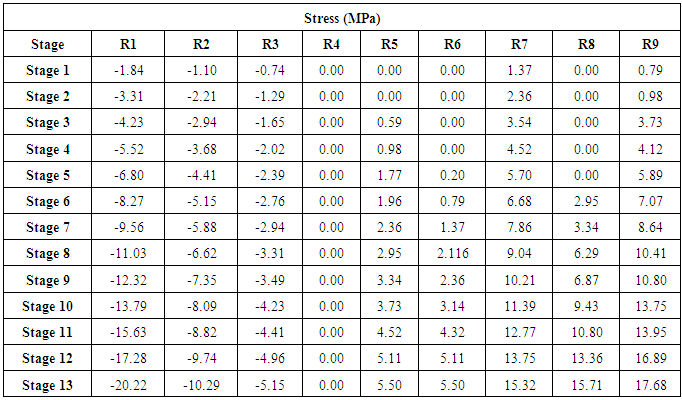
In order to compare the methods of determining the normal stresses in the positions of the deflectometer, Tables 3 and 4 were constructed to show the experimental (calculated by Hooke's Law – Table 3) and theoretical (calculated by equation 1 – Table 4) normal stresses values, respectively.Table 3. Experimental normal stresses for all deflectometer positions
 |
| |
|
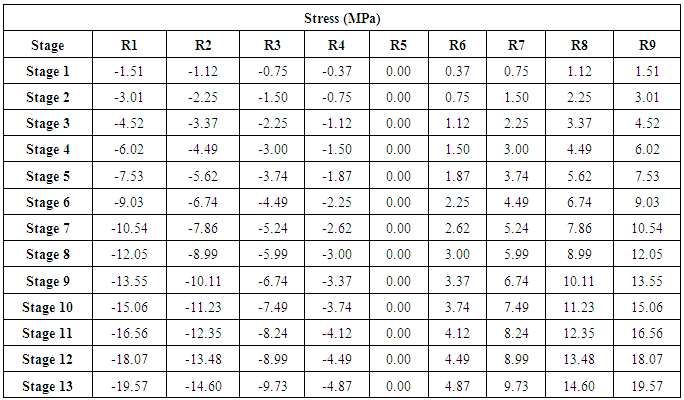
Table 4. Theoretical normal stresses for all deflectometer positions
 |
| |
|
It was observed that the theoretical values were very close to the obtained experimentally, especially for the compressed region of the sample, where in only 5.7% of the cases the experimental values were greater than the theoretical values. It is of real importance to note that for the experimental values R4 remained null while for the theoretical values the R5 (at the sample axis of symmetry) is the one that presented null values, and this can be explained by the difference between the values of the modulus of elasticity in compression and in tension that causes the displacement of the NL upwards.
4. Conclusions
Based on the methodology employed, as well as the results achieved, it was possible to conclude that:- through statistical analysis it was verified that the position of the Neutral Line presented as a normal distribution variable, being located at 1,07cm above the sample axis of symmetry. Thus, it is evident that the position of the Neutral Line is very close to the geometric center of the cross section;- the variation of the position of the Neutral Line upwards seems to be a tendency, since wood presents modulus of elasticity in tension greater than the same parameter in compression;- comparison between the values of normal stresses obtained experimentally and theoretically was verified showing similarity in the data, being also plausible the theory for calculation of the normal tensions of the wood beams, when in the elastic regime, since for most of cases, the experimental values were lower than the theoretical values.
ACKNOWLEDGEMENTS
Authors thank to CAPES for the financial support and the Wood Laboratory and Timber Structures (LaMEM) of the Engineering of Structures Department (SET) of the Engineering School of Sao Carlos - University of Sao Paulo.
References
| [1] | Pigozzo, J. C.; Arroyo, F. N.; Cavalheiro, R. S.; Christoforo, A. L.; Pletz, E.; Lahr, F. A. R. Aspects of mechanical stress grading for structural timber. International Journal of Materials Engineering, v. 6, p. 119-125, 2016. |
| [2] | Lahr, F. A. R.; Arroyo, F. N.; Almeida, D. H.; Almeida Filho, F. M.; Mendes, I. S.; Christoforo, A. L. Full characterization of Erisma uncinatum Warm wood specie. International Journal of Materials Engineering. 6(5): 147-150, 2016. |
| [3] | Almeida, T. H.; Almeida, D. H.; Araújo, V. A.; Silva, S. A. M.; Christoforo, A. L.; Lahr, F. A. R. Density as estimator of dimensional stability quantities of Brazilian tropical woods. BioResources, 12 (3): 6579-6590, 2017. |
| [4] | Almeida, T. H.; Almeida, D. H.; Christoforo, A. L.; Chahud, E.; Branco, L. A. M. N.; Lahr, F. A. R. Density as estimator of strength in compression parallel to the grain in wood. International Journal of Materials Engineering, 6(3): 67-71, 2016. |
| [5] | Christoforo, A. L.; Silva, S. A. M.; Panzera, T. H.; Lahr, F. A. R. Estimative of wooden toughness by the apparent density and bending strength. International Journal of Materials Engineering, 4(2), 49-55: 2014. |
| [6] | ABNT NBR 7190:1997. Design of timber structures. Rio de Janeiro, 1997. |
| [7] | Calil Junior, C.; Lahr, F. A. R.; Dias, A. A. Timber elements design. Manole, 2003. |
| [8] | Calil Junior, C.; Molina, J. C. Coberturas em estruturas de madeira: exemplos de cálculo. São Paulo: Pini, 2010. |
| [9] | Chahud, E. Madeira: módulo de elasticidade longitudinal e proposta para o cálculo de peças fletidas. Tese (Doutorado) – Escola de Engenharia de São Carlos, Universidade de São Paulo, São Carlos, 1989, 148 p. |
| [10] | Forest Products Laboratory - USDA. Wood Handbook: Wood as an Engineering Material. Madison: Forest Products Laboratory - USDA, 2010. |
| [11] | Stolf, D. O.; Bertolini, M. S.; Almeida, D. H.; Silva, D. A. L.; Panzera, T. H.; Christoforo, A. L.; Lahr, F. A. R. Influence of growth ring orientation of some wood species to obtain toughness. Revista Escola de Minas, 28 (3): 265-271, 2013. |
| [12] | Timoshenko, S.; Goodier, J. N.. Teoria da elasticidade. 3. ed. Rio de Janeiro: Guanabara Dois, 1980. |
| [13] | Procópio, L. C.; Secco, R. S. A importância da identificação botânica nos inventários florestais: o exemplo do “tauari” (Couratari spp. e Cariniana spp. - Lecythidaceae) em duas áreas manejadas no estado do Pará. Acta Amazonica, v. 38, n. 1, p. 31–44, 2008. |
| [14] | Garcia, F. M.; Manfio, D. R.; Sansígolo, C. A.; Magalhães, P. A. D. Rendimento no desdobro de toras de Itaúba (Mezilaurus itauba) e Tauari (Couratari guianensis) segundo a classificação da qualidade da tora. Floresta e Ambiente, v. 19, n. 4, p. 468-474, 2012. DOI: 10.4322/floram.2012.059. |
| [15] | Steege, H.; Vaessen, R. W.; López, D. C.; Sabatier, D.; Antonelli, A.; Oliveira, S. M.; Pitman, N. C. A.; Jorgensen, P. M.; Salomão, R. P. The discovery of the Amazonian tree flora with an update checklist of all known tree taxa. Scientific Reports, 6(29549): 1-15, 2013. |

 Abstract
 Reference
 Full-Text PDF
 Full-text HTML