Julio César Pigozzo1, Mariano Martinez Espinosa2, Carlito Calil Junior3, Felipe Nascimento Arroyo4, André Luis Christoforo4, Francisco Antonio Rocco Lahr3
1Department of Civil Engineering, Technology Center, State University of Maringá (UEM), Maringá, Brazil
2Department of Statistics, Federal University of Mato Grosso (UFMT), Cuiabá, Brazil
3Department of Structural Engineering, São Paulo University (EESC/USP), São Carlos, Brazil
4Centre for Innovation and Technology in Composites – CITeC, Department of Civil Engineering (DECiv), Federal University of São Carlos, São Carlos, Brazil
Correspondence to: André Luis Christoforo, Centre for Innovation and Technology in Composites – CITeC, Department of Civil Engineering (DECiv), Federal University of São Carlos, São Carlos, Brazil.
| Email: |  |
Copyright © 2017 Scientific & Academic Publishing. All Rights Reserved.
This work is licensed under the Creative Commons Attribution International License (CC BY).
http://creativecommons.org/licenses/by/4.0/

Abstract
The statistical experiment design is an indispensable tool to the searching front the multivariable situations. Whichever the design statistical adopted or simply response of random variables, the technique of multiple regression for situations with normal distribution can be used to determine or to develop more adequate the statistical model. This model allows to infer on the experimental data. The estimates of the mean response of this model sufficiently are used in real applications of project, however in the structural applications the estimate of the response in the 5% down percentile is necessary, called characteristic value of the response. In this research, present the experimental strength results of bonded-in steel rods in timber in angle 45º between the rod and the direction of the grain, the estimates of the mean strength by analysis of multiple regression, the confidence interval of 90% and the characteristics response. The independent variables were used: anchorage area of steel bar surface, moisture of the wood and density. All combination of variables presented were six replicate. The wood used was Corymbia citriodora, dry to the air, with CCA treatment; were used galvanized threaded steel bars CA-50 and compound adhesive gel epoxy resin. This research results in the mean anchorage force, response of the analysis of multiple regression, the determination of the confidence interval and the estimate of the characteristic values for the variables combination, in the edges and inside of the interval of the experiment.
Keywords:
Multiple regression, Percentile, Anchorage strength, Bonded-in steel rods
Cite this paper: Julio César Pigozzo, Mariano Martinez Espinosa, Carlito Calil Junior, Felipe Nascimento Arroyo, André Luis Christoforo, Francisco Antonio Rocco Lahr, Characteristics Value Estimate of Steel Bar Anchor Strength by Mean Response Confidence Interval, International Journal of Materials Engineering , Vol. 7 No. 6, 2017, pp. 111-116. doi: 10.5923/j.ijme.20170706.02.
1. Introduction
The multiple linear regression technique for observations with normal distribution can be used to determine or develop more adequate statistical models, in view of multivariable situations, that allow infer on the experimental data. With experiments statistical planning, a tool indispensable to researcher, it is possible initially, with a reduced number of observations, understand the tendency of variables behavior and in sequence, add complementary information without prejudice the previously work performed. Whatever the statistical planning adopted, the statistical model obtained will allow infer a mean response for each combination of variables. These mean answers have applications in projects, but in structural applications are necessary the answers estimates in lower percentile 5%, denominated answers characteristic values [1].In this research are presented the study results of bonded steel bars anchoring strength in pliable structural elements of Eucalyptus citriodora (Corymbia citriodora) treated with CCA, with mean density of 1000 kg/m3 at 12% moisture, which after statistical treatments, will allow obtain the characteristic values for any combination of independent variables assuming values, inside and at the margins, of the experiment interval.The bonded steel bars use in structural wood elements began with the necessity to fix screws, which could receive axial, lateral or combined loads, in certain wooden structures positions. This connection type has received attention and recognition by presenting excellent performance when well designed and executed, due to its aesthetic appearance and low cost. Its main advantages are: glued-bar connections allow higher strain transfer levels than conventional connections; they resist great bending moments; the holes used do not weaken the structural parts as with the bolted connections; the structural parts become more aesthetic avoiding apparent connectors like toothed plates or screws; are easily protected against fire; are potentially cheaper than the "finger-joint" system since they do not require special machines to do; presents less material and lower production cost when compared to bolted connections [2].[3] report that there are still no general technical standards governing the glued steel bars use in wood structures, although they have been used for more than 20 years in some Scandinavian countries and Germany, however, the performance requirements and project regulations differ between them. Due to the uncertainties behavior of these connectors and the general methods lack of reliable calculations, they have not yet been introduced into the main part of European standard [4].The structural synthetic resins most commonly used in wood structures are classified into three groups: phenol resorcinol formaldehyde (PRF), polyurethanes (PUR) and epoxies (EP), hat have been undergoing continuous development, presenting better properties and fewer defects over time. Many information and results obtained a few years ago no longer apply to new existing resins [2]. The results obtained by [5], which tested several adhesives in the development of structures reinforcement systems of glued laminated timber, show some resins properties available at the time, such as: the PRF does not present good penetrability (ability to fill faults), presents considerable retraction properties and requires hot cure; the EP has high strength, good penetrability and no retraction, and is relatively expensive. Currently the PRF does not require a hot cure and has fewer retractions, the EP with many options, it is cost competitive compared to other resins. Previously there were restrictions for EP use as structural resin, it was suspected that it could present fragile ruptures with temperature increase or against long loads. With the development, this adhesive became the most suitable for anchoring steel bars in structural wood pieces. A significant change appears when the EP is no longer considered as a resin set, with uniform behaviors, denominated only as epoxy, but it happens to compare different brands and manufacturers [2, 5].[6] compared results on woods with strength classes C24 and C30 and concluded that the influence of wood density on wood anchorage strength of bonded bars, was lower than that considered in the equation adopted by [4], Part 2, item A.2.2, and there were no differences in mean anchorage strength using PUR and PRF. In the case of epoxy, the series C24 mean was 7% lower compared to the C30 series. [7, 8] found no significant influence of wood density on cast bars anchoring strength.The bars used as connectors are preferably threaded, galvanized and high strength bars. Bars with deformed surfaces (streaked surfaces, girls or fillets) with high strength are also used. The anchorage adhesion, initially, is formed by chemical and mechanical adhesion combination. From a solicitation level, chemical adhesion breaks, remaining only mechanical adhesion [2].[9] concluded that bars with deformed surfaces had lower anchoring strengths, resulting in more cracking ruptures than bars with threaded surfaces. The bars means anchor strength with deformed surfaces was 80% of bars means with threaded surfaces. It also presented important information regarding the stresses distribution along the anchoring length.The specimens used for bonded steel bars analysis may be ordered on one side or on two sides. [8], analyzing the two request modes on specimens using Norway spruce (Picea abies), concluded that anchorage tests, requesting the specimen on two sides, produced higher strength than the specimens tests requesting of one side, due to the compression or tensile stresses that arise perpendicular to the bars axis, depending on request form. Comparing results with PE and PUR, the differences were accentuated.[10] reviewing link breaking experiments due to improper blends and/or misapplications of epoxy adhesives "in loco", concluded that the entire gluing operation should be done in factory environment with adequate quality control, by specialized people.The main research goals for studies development of bonded steel bar anchorage are: calculation models development; test method for adhesives; effects on axial strength, the distances between bars and between bars and wood ends; moisture contained on axial strength effect; load duration tests on bars with different adhesion surfaces; fatigue effect; test methods for production control and standards project design.The objective of this research was to estimate the characteristic value in multivariate situations, based on statistical results obtained with the statistical models, developed by means of multiple linear regressions on experimental data, and can also present different applications in products derived from wood.
2. Material and Methods
2.1. Regression Equations
The regression equations can be used for several purposes and one of main objectives is to predict or estimate a response or dependent variable, denoted by Y as a function of another independent variable (Equation 1), denoted by x [11]. The equation 1 can assume a great variety of forms: linear, parabolic, exponential, etc. | (1) |
For the general case of n observations of a response variable Y and k independent variables x1, x2, ..., xk, the multiple linear regression model is given by Equation 2 [12], | (2) |
being that:  are the model parameters, also called regression coefficients, and
  are the random errors. The
  are random variables with the following assumptions:1 - the
  mean is zero and its variance
  is unknown and constant, for
  2- the
  are uncorrelated;3 - the
  distribution in normal, for
  In order to estimate the model parameters, given by Equation 2, it is preferable use the matrix notation, since it facilitates the calculations and can be written as:
 | (3) |
Being that:  , X is a matrix n x k, with n rows which represent the n experimental tests, k is independent variables number,
  is a vector k x 1 of unknown parameters and are random errors.
2.2. Mean Response Confidence Interval
A confidence interval can be constructed under the mean response to a specific value of  denoted by
  with
with  . This is a range around
  and is often called the confidence interval around regression equation, whereas it is possible to obtain a point estimate of
 from estimated model [13], given by Equation 4.
 | (4) |
From Equation 4,  is a non-additive point estimator of
  , since
  is non-additive estimator of
  , and the variance of
  is expressed by Equation 5.
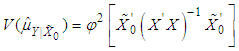 | (5) |
A confidence interval  under mean response
  at point
 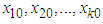 is expressed by Equation 6.
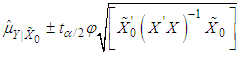 | (6) |
Being that:  is determined from a t Student distribution, with
 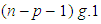 and a significance level
  and
and 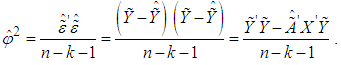 The confidence interval given by Equation 6 can estimate characteristic value of the different independent variables conditions considered [14, 15]. Note that the extreme boundaries values of these intervals are functions of the sample data, which have a known probability of containing the true parameter value (characteristic value), this probability being called confidence interval coefficient. For the percentile confidence intervals, confidence levels of 90% are generally considered. It should be noted that the lower limit of a 90% confidence interval is equivalent to 5%, which corresponds to lower 5% percentile of the probability distribution that best adjusts to values obtained in tests performed on specific conditions of different variables considered. The confidence interval is based solely on the data used to regression model estimate, not on future observations, outside the experimental range [13].
2.3. Prediction Interval
An important model application given by Equation 3 is the extrapolation or value prediction of the dependent variable for a new observation  corresponding to an observations vector
 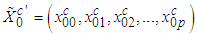 with
with  , outside experimental values region of independent sample variables. In this way, the new or future point estimator values of
  response at
  point is expressed by Equation 7.
 | (7) |
Note that this new observation is independent of observations used to develop regression model. Therefore, a prediction (IP) interval  for a future observation outside the experimental interval is given by [16], as follows:
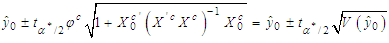 | (8) |
being that:  is determined from a t Student distribution, with (n – p) freedom degrees and a significance level, with variance given by:
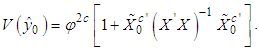
2.4. Experimental Procedure
Six Corymbia Citriodora pliable beams treated with CCA, diameters of 20-25 cm, apparently air-dried, obtained twelve specimens in the central region, two in each beam, with lengths of 30 cm each as Figure 1. In these specimens, CA-50 steel bars with diameters of 6.3 and 10.0 mm were cast in holes with diameters of 9.5 and 13.0 mm, respectively, forming the specimens series 1 and 2, with thicknesses of 1.6 and 1.5 mm glue lines, respectively.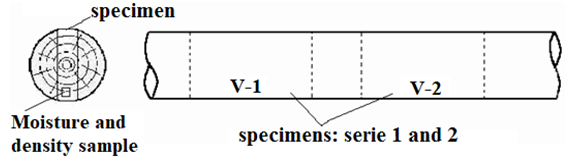 | Figure 1. Specimens obtaining |
The epoxy resin used was compound adhesive gel resin, manufactured by company Otto Baungart. The bars were positioned according to Figure 2a and the one-sided test specimen anchor tests were performed using a steel support. The anchoring lengths were 6.5 and 9.0 cm, corresponding to mean anchorages surfaces of 13.2 and 29.3 cm2, respectively. Table 1 summarizes experimental results obtained. | Figure 2. (a) Bonded bars position and, (b) anchorage test form at 45° |
3. Results and Discussion
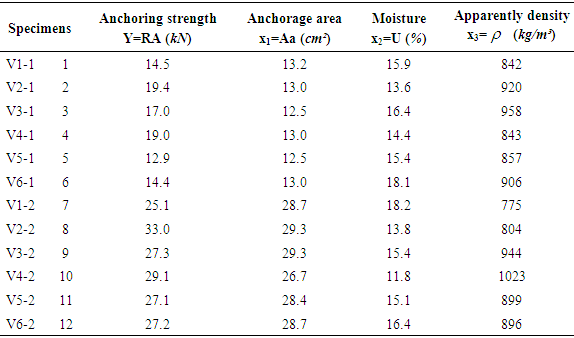
Table 1 resents the results of anchor strength, anchorage area, moisture and density of Corymbia citriodora wood specie.Table 1. Anchor strength, anchorage area, moisture and density of Corymbia citriodora wood
 |
| |
|
The model given by Equation 3 was obtained in order to determine the independent variables effects (Table 1 data), with the aid of Minitab 13® program. The statistical model response is presented in Equation 9. | (9) |
From Equation 9, the response represents the anchoring strength (kN);  represents the anchorage area in (cm²),
  is the moisture content (%) and
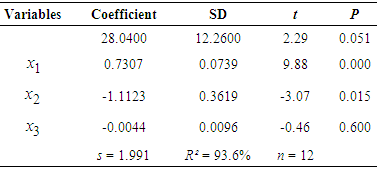
  is the wood apparent density in (kg/m³).This model has a residual standard deviation (SD) of 1.968 and a determination coefficient R2 93.6%. In addition to these values, the independent variables coefficients, with their respective standard deviations, t ratio value, probability (p) and observations number (n) are presented in Table 2. The t value shows the variable significance in model corresponding to the probability (p), if the p value is less than or equal to 5%, the variable is accepted as significant at the 5% level.
Table 2. Independent variables regression coefficients, SD, t, p, s, R² e n
 |
| |
|
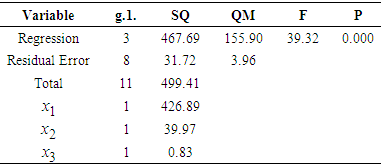
Table 3 presents the variance analysis: freedom degrees (g.1.), squares sum (SQ), average squares (QM), F Test (F) and probability (p) for Equation 9 model data and the squares sum for each variable. The F test statistically proves the regression existence at 5% significance level, when 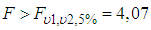 through F Snedecor distribution table or when p<0.05.
Table 3. Variance analysis and squares sum (SQ) of independent variables
 |
| |
|
The residue analyzes in relation to x1; x2 and x3 variables. Figures 3 and 4 show that the variance is constant and that there is no correlation between residuals and independent variables, which is observed by points around zero uniform dispersion, confirming the hypotheses 1 and 2, presented in Equation 2, the normality test of residues in Figure 5 confirms hypothesis 3 that residues and consequently the responses present a normal distribution, also confirming the model adequacy given by Equation 9 and indicating that the tests used for analysis are adequate and possible to be used.Therefore, the model: RAestiamte = 28.0400 + 0.7307Aa - 1.1123U - 0.0044 allows estimate the mean and characteristic values presented in Table 4. Equation 9 can be replaced by equation: RAestiamte = 23.0190 + 0.7336Aa - 1.0427U, when in regression analysis the apparent density variable, revealed as non-significant, is disregarded.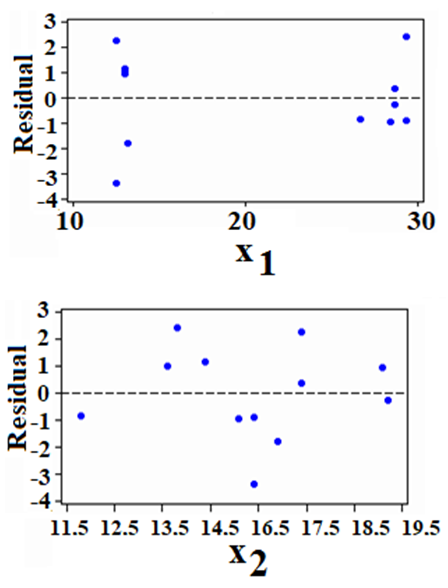 | Figure 3. Residuals graphs against independent variables x1 and x2 |
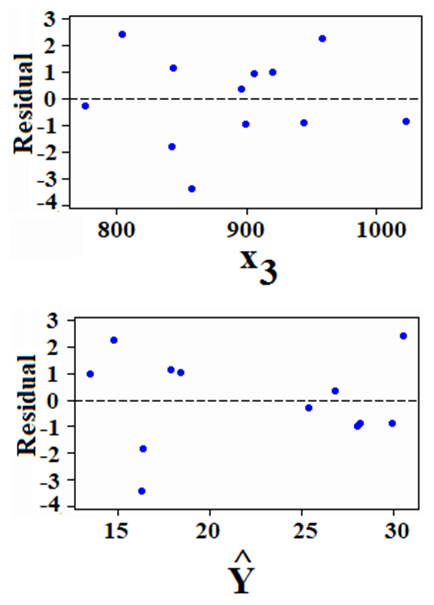 | Figure 4. Residuals graphs against independent variable X3 and estimated values Y |
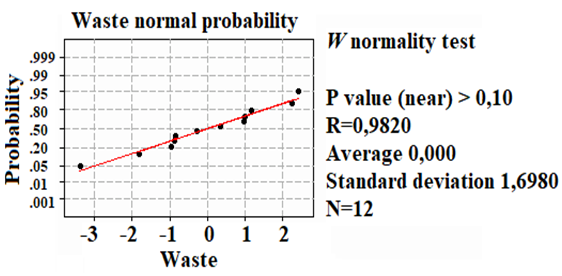 | Figure 5. Residuals normal probability plot |
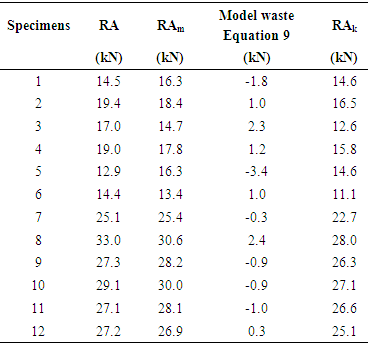
Table 4. Test specimens, anchorage strength: RA experimental values, RAm estimated values by Equation 9 and RAk characteristic values by Equation 6 for different conditions of independent variables
 |
| |
|
4. Conclusions
By estimated model, it can be verified that: anchorage area and moisture content is statistically significant in anchoring strength. Thus, first variable effect linearly increases the anchoring strength and second variable effect linearly reduces this property. On the other hand, it can be observed that the effect of apparent density variable is not statistically significant in fitted model.Further characteristic values can be obtained by the mean response, given by Equation 9, within experiment (anchorage area ranging from 12 to 30 cm 2 and moisture content ranging from 11 to 19%. For any combination of independent variables, the characteristic value will correspond to lower limit of confidence interval at 90% level for the mean response and may be automatically obtained through a statistical program with multiple linear regression analysis features.
References
| [1] | Christoforo, A. L.; Arroyo, F. N.; Lopes, D. A.; Panzera, T. H.; Lahr, F. A. R. Full characterization of Calycophyllum multiflorum wood specie. Eng. Agr-Jaboticabal, v. 37, p. 637-643, 2017. |
| [2] | Pigozzo, J. C.; Arroyo, F. N.; Christoforo, A. L.; Calil Junior, C.; Lahr, F. A. R. Pull out strength evaluation of steel bars bonded-in to 45° in round timbers of Corymbia citriodora treated with CCA. International Journal of Materials Engineering, v. 7, p. 25-32, 2017. |
| [3] | Bainbridge, R. J.; Mettem, C. J. Bonded in rods for timber structure: a versatile method for achieving structural connections, The Structural Engineering, v77, n15, p 24-27, 1999. |
| [4] | EUROCODE 5. Design of timber structures – Part 1-1: General rules and rules for buildings, ENV 1995-1-1, European Committee for Standardization, Brussel, Belgium, Dec, 110p, 1993. |
| [5] | Gardner, G. Reinforced glued laminated timber system epoxy/steel timber composite material, Pacific Timber Engineering Conference, p 548 – 557, 1994. |
| [6] | Aicher, S.; Gustafsson, P.; Wolf, M. Load displacement and bond strength of glued-in rods in timber influenced by adhesive, wood density, rod slenderness and diameter, 1st International RILEM Symposium on Timber Engineering, Stockholm, Sweden, Sep. 13–14, p 369–381, 1999. |
| [7] | Buchanan, A.; Moss, P. Desin of epoxied steel rods in glulam timber, Pacific Timber Engineering Conference, Rotorua, New Zeland, March p 286 – 293, 1999. |
| [8] | Bengtsson, C.; Kemmsies, M.; Johansson, C. J. Production control methods for glued-in rods for timber structures, 6th World Conference on Timber Estructure, p 7.4.1, 2000. |
| [9] | Buchanan, A.; Deng, J. Strength of epoxied steel rods in glulam timber, International Wood Engineering Conference, p 4-488–4-495, 1996. |
| [10] | Barchelar, M. L., Mcintosh, K. A. Structural joint in glulam, 5th World Conference Timber Engineering, Montreux, Switzerland, V1, p 289-296, 1998. |
| [11] | Chatterjee, S.; Price, B. Regression Analysis by example, John Wiley and Sons, Inc, New York, 228 p, 1977. |
| [12] | Draper, N. R.; Smith, H. Applied Regression Analysis, John Wiley & Sons, Inc, New York, 668 p, 1998. |
| [13] | Montgomery, D. C.; Runger, G. C. Applied Statistical and Probability for Engineers, John Wiley & Sons, Inc, New Y, 1994. |
| [14] | Martínez, M. E.; Calil, C. J. Determinação do Valor Característico da Resistência da Madeira: Distribuições de Probabilidades Simétricas e Assimétricas, Revista Madeira: Arquitetura e Engenharia, Ano 1, n, 2/ ISSN: 1516-2850, p, 25-30, 2000. |
| [15] | Martínez, M. E. Desenvolvimento de um Modelo Estatístico para Aplicação no Estudo de Fadiga em Emendas Dentadas de Madeira, São Carlos, SP, Tese de Doutorado - Escola de Engenharia de São Carlos/Instituto de Física de São Carlos/Instituto de Química de São Carlos - Universidade de São Paulo, 2001. |

 Abstract
 Reference
 Full-Text PDF
 Full-text HTML