F. I. Alo1, P. O. Atanda1, A. A. Daniyan1, O. W. Abodunrin2, K. M. Oluwasegun1
1Department of Materials Science and Engineering, Obafemi Awolowo University, Ile-Ife, Nigeria
2Physics Department, Joseph Ayo Babalola University, Ikeji, Nigeria
Correspondence to: A. A. Daniyan, Department of Materials Science and Engineering, Obafemi Awolowo University, Ile-Ife, Nigeria.
| Email: |  |
Copyright © 2017 Scientific & Academic Publishing. All Rights Reserved.
This work is licensed under the Creative Commons Attribution International License (CC BY).
http://creativecommons.org/licenses/by/4.0/

Abstract
This study reports an assessment of imported and local constructional steel in Nigeria. The analysis was carried out using one-way ANOVA. The result showed that, Federated steel has the highest hardness value of 126.3 HV and Impact value of 149 HV among all the sizes of the iron rod followed by Land Craft Industrial with 190 HV. Ukraine has the least hardness of 130 HV. While Brazil has the least Impact value of 35.02 J. Federated steel has Ultimate Tensile strength (UTS) of 799.49MPa, Land Craft Industrial steel has 708.30 MPa, Brazil steel has 538.51MPa followed by Ukraine with 544.81 MPa. The yield strength for the Federated steel is 660MPa, Land Craft Industrial steel is 510 MPa, and Brazil has 440 MPa. Ukraine Steel with 420 MPa. ANOVA test confirmed the results at 95% confidence and further showed that there was significant difference between the four samples. There existed significance difference between land craft and Ukraine, as well as between land craft and Brazil (mean differences = 326. and 512. respectively, at p<0.05) Further analysis on the interaction effect within the locations revealed that significant difference existed between Federated and Ukraine as well as between Federated and Brazil (mean differences = 340. and 526. respectively, at p<0.05).
Keywords:
Mechanical, Properties, ANOVA, Steel and Strength
Cite this paper: F. I. Alo, P. O. Atanda, A. A. Daniyan, O. W. Abodunrin, K. M. Oluwasegun, An Assessment of Imported and Local Constructional Steel in Nigeria: Analysis by One-Way ANOVA, International Journal of Materials Engineering , Vol. 7 No. 3, 2017, pp. 45-51. doi: 10.5923/j.ijme.20170703.01.
1. Introduction
Steels are the major components of machineries used in the industries. Mild steel is one the major construction materials, which is extensively used in chemical and allied industries for the handing of acid, alkali and salt solution [1]. Steel is an alloy of iron and carbon with iron being the major constituent. The various grades of steel produced in the country and currently used for construction works are largely structural steels (Mild steels).Over 500 million tonnes of low carbon steels are produced yearly around the world; they are used for most of the engineering applications. Low carbon steels are utilised to produce cars body panels, tubes, domestic appliance side panels and other engineering applications because they are readily available, workable and weldable [2]. In addition, the mechanical properties of low carbon steel such as strength formability, ductility, fatigue strength and surface hardness, amongst others enhances its performance in service. Studies have also shown that failure of carbon steels can result from production methods, use of substandard material, poor design, manufacturing errors due to poor machining, or failure from a phenomenon called fatigue [3, 4]. Steel exhibits a wide range of mechanical characteristics of which the strength factor is the dominant property. Engineering strength is however, evaluated in terms of yield strength, ultimate tensile strength (UTS), modulus of elasticity (E), percentage elongation and impact strength. Any increase in the strength characteristics of steel will enhance the reliability and durability of the structure/machine in which it is used [5]. Conversely, low strength characteristics often result in short life span of structures, warpage, undesirable deflection and even failure/collapse. Mild steel mostly used for structural purposes contain 0.15-0.30 percent carbon [6], the quality of molten steel depends on the charge characteristics. These include levels of deoxidation, inclusions, slag composition and cleanliness. Sulphur and phosphorus are the two major deleterious elements that must be controlled [7].It has been identified that the use of inferior and substandard steel rod are among the causes of construction collapse and failures [8]. Therefore, the production of the steel bars to meet service requirements and estimation of the mechanical properties are very imperative [9, 10].Since the rate of building is on increase since early 90s, many researches have been conducted on the reinforcement steels in the constructional building. [11] Investigated the yield strength of steel reinforcing bars used in Nigerian concrete structures and concluded that the test results of 12mm and 16mm reinforcing bars adopted for structural purposes within Lagos State environment which have experienced the most cases of building collapse in Nigeria. A total of 433 samples from sites located in 10 Local Government Areas of Lagos State were analysed with statistical tools. About 42% of the 12mm bars and 46% of 16mm bars failed to meet the BS code prescription of 460N/mm yield strength and about 28 % and 33% of 12mm and 16mm bars, respectively, failed to meet the Nigerian’s professional’s prescription of 410N/mm.
2. Experimental Procedures
The experimental procedures were carried out as follows:
2.1. Materials and Sample Preparation
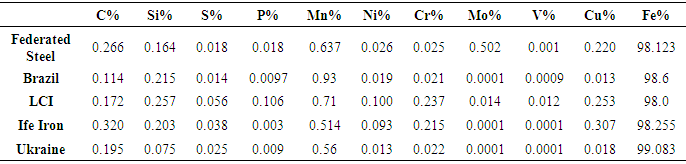
The steels were commercially obtained and the chemical compositions of the steels were analyzed at Nigerian Foundries Limited, Ilupeju, Lagos State, Nigeria. The result of the analysis is shown in Table 1.Table 1. Elemental Composition of Steel Used (Mass fraction, wt. %)
 |
| |
|
The mild steels were sectioned into 30 mm × 20 mm × 5.0 mm with Buehler Isomet 4000 linear precision saw and were successively grinded on Buehler Automatic polisher with series of SiC abrasive papers (240, 320, 600 and 800). Tensile strength testing of all specimens were conducted as per ASTME 8 standard [12]. Three identical tests specimen for each section thickness per sample were tested at room temperature with a strain/ loading rate of 5 mm/mm using a computerized Instron Testing Machine (model 3369). Load displacement plots were obtained on an X – Y recorder and ultimate tensile strength, yield strength and percentage elongation values were calculated from this load displacement diagrams. For the Hardness testing, the cut sample from different steel manufacturing company were subjected to the microhardness Vicker tester, model FM-800, serial no: FMS 8033 according to ASTM/A29M-15 [13]. The Impact testing for all the specimens was done based on ASTM E23 [14]. These test specimens were tested for section thickness. The tests were carried out using Izod Impact Testing method on Hounsfield Impact Testing Machine. Specimen was notched at an angle of 45º from 28 mm end length of 75 mm. The amount of Impact energy absorbed by the specimen was read off on the calibrated scale attached to the machine as a measure of impact strength in Joules.The Universal Testing Machine (UTM) was used to determine the mechanical properties of the specimens. Each specimen was subjected to tension in accordance with the BS4449:1997 [15] ASTME8 standard provisions, and after fracture, the average Yield Strength (YS), average Ultimate Tensile Strength (UTS) and the Percentage Elongation (%E) were obtained according to the Expressions:Yield Strength (N/mm2) = Yield Force / Original Cross Sectional Area (1)Ultimate Tensile Strength (N/mm2) = Maximum Force the Specimen can withstand / Original Cross Sectional Area (2)Percentage Elongation (%) = (Final Length – Original Length) / Original Length (3)Steel serves as a suitable reinforcement material because its coefficient of thermal expansion (5.8 x 10⁻⁶ to 6.4 x 10⁻⁶) is nearly the same as that of concrete (5 x 10⁻⁶ to 7 x 10⁻⁶). This means that there will be no relative movement between embedded bars and concrete in the reinforced concrete work due to temperature changes [16]. [17], in her work on assessment of the Microstructure and Mechanical Properties of 0.26% Low Carbon Steel under Different Cooling Media via one-way ANOVA confirmed the results at 90% confidence. Many authors had used Anova for statistical analysis like [18-20].
3. Result and Discussions
From Figure 1, it could be seen that Federated, Land craft industrial steel, Ukraine and Brazil steels are in the same range with the standard, only Ife iron steel has a very low Brinell hardness value. The reason may be due to the low carbon contents and this is in agreement with the work of Valeria [21].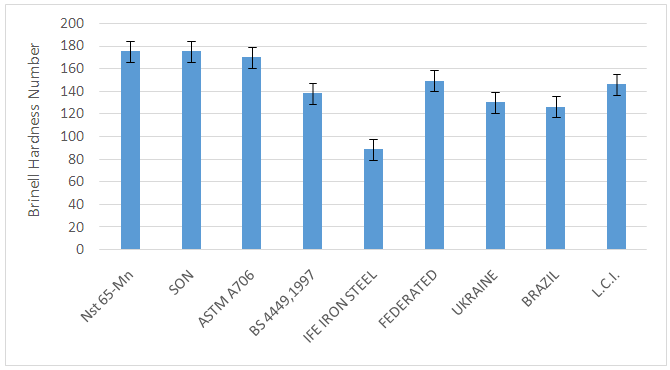 | Figure 1. Comparison of Brinell Hardness Number of Ife Iron steel, Federated steel, land Craft industrial steel, Ukraine steel and Brazil steel compared with enable standards |
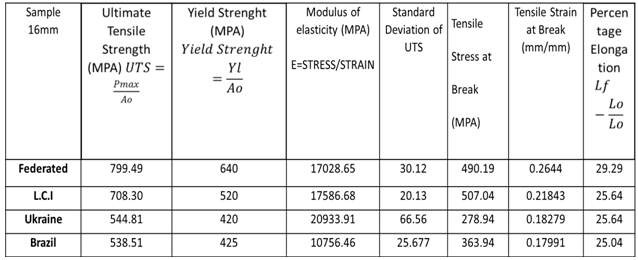
The summary result for 16 mm steel is presented in Table 2. Federated steel has Ultimate Tensile strength (UTS) of 799.49MPa, land craft industrial steel has 708.30MPa, Brazil steel has 538.51MPa followed by Ukraine with 544.81MPa. The yield strength for the Federated steel is 660MPa, Land Craft Industrial steel is 510MPa, and Brazil has 440MPa. Ukraine Steel with 420 M Pa. The stress-strain graphs for 16 mm steel are shown in Figure 2.Table 2. Stress Strain Result for 16mm Steel
 |
| |
|
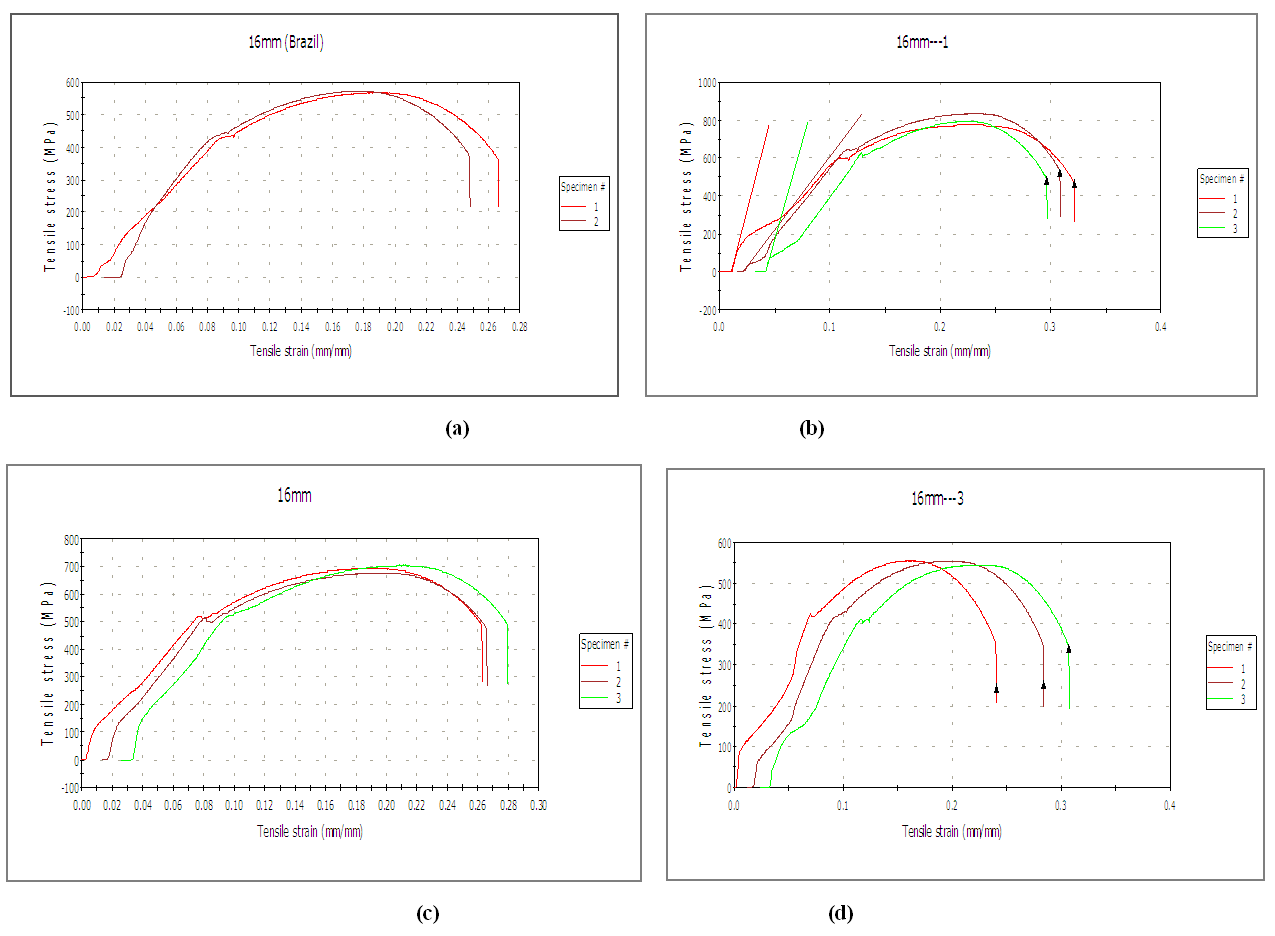 | Figure 2. Stress Strain Result for 16mm Steel (a) Brazil, (b) Federated, (c) Land Craft Industrial and (d) Ukraine |
In Figure 3, Federated steel has the highest hardness value of 126.3 HV and Impact value of 149 HV amongst all the sizes of the iron rod followed by Land Craft Industrial with 190 HV. Ukraine has the least hardness of 130 HV. While Brazil has the least Impact value of 35.02 J. | Figure 3. Comparison of Impact and Micro hardness Values of different of Steel |
3.1. Statistical Analysis
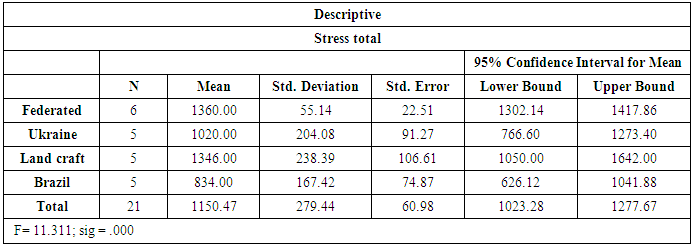
Stress Total for Four Different LocationsAnalysis of variance (ANOVA) was carried out to consider the effect of location on the stressTOTAL, it was discovered that location had statistically significant effect on the stressTOTAL (f = 11.311 @ p<0.05) (Table 3), this implied that stress MTOTAL for the 4 locations were not the same, this can be confirmed from their mean values which ranged between 1360 and 834 (Table 3). Federated has the highest mean value (1360) followed by land craft (1346), Ukraine (1020) with the lowest being Brazil (834).Table 3. ANOVA result with the mean values for stresstotal
 |
| |
|
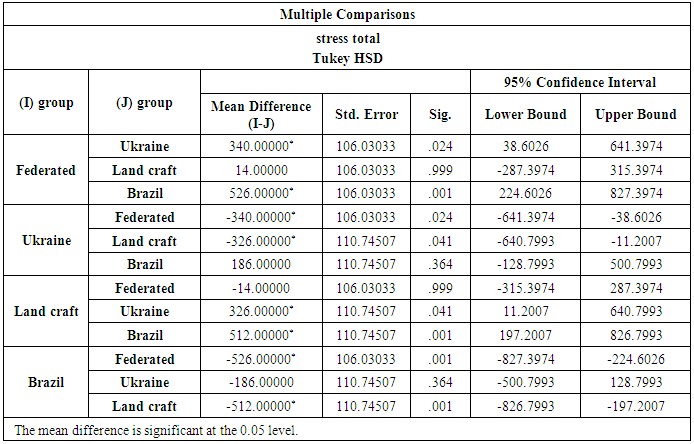
If the decision rule is the higher the stress TOTAL, the higher the performance, this result therefore implied that the stress TOTAL from the location with the highest mean has the highest performance. Hence stress TOTAL from Federated will perform best followed by land craft, Ukraine and Brazil with the lowest performance.Further analysis on the interaction effect within the locations revealed that significance difference existed between Federated and Ukraine as well as between Federated and Brazil (mean differences = 340 and 526. respectively, at p<0.05) (Table 4) whereas no significance difference existed between Federated and Land Craft (mean difference = 14 at p<0.05). Table 4. Result of Tukey HSD Test for the 4 locations for stresstotal
 |
| |
|
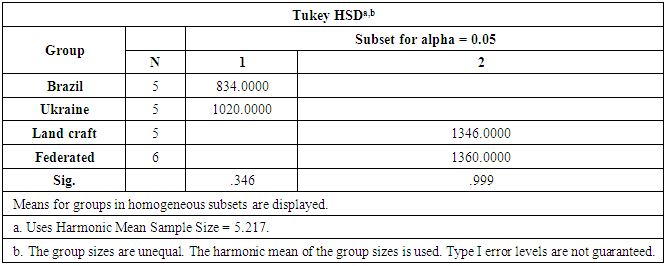
It was also shown from the Table that mean stress TOTAL for the Federated was higher than that of Ukraine, Land Craft and Brazil (mean differences being positive); mean difference between Federated and Ukraine and that of Brazil were large which implied that their means would not be close and confirmed significance difference in their means. In the same vein, there existed significance difference between Land Craft and Ukraine, as well as between Land Craft and Brazil (mean differences = 326. and 512. respectively, at p<0.05). It was also shown from the Table that mean stress TOTAL for Land Craft was higher than that of Ukraine and Brazil, also mean stress TOTAL for Ukraine was higher than that of Brazil (mean differences being positive). It is worth noting that no statistically significance difference existed between Ukraine and Brazil (mean difference = 186 at p<0.05) with Ukraine having higher mean stress TOTAL than Brazil.The result of Tukey (HSD) test (Table 5) also revealed that Brazil and Ukraine belong to subset 1 while, land craft and Federated shared subset 2; this is an indication that the effect of locations within the same subset on MTOTAL was not statistically significant whereas effect of the locations sharing different subsets on MTOTAL was significant. This is an indication that samples from brazil and Ukraine will behave the same way while samples from land craft and Federated will behave the same way but different from the previously listed locations.Table 5. Tukey Hsd test Result for Stress Total
 |
| |
|
The profile plot of steel samples (Figure 4) showed that stress TOTAL for Federated and Land Craft were very close while a very wide divergent occurs in stress TOTAL for Brazil compared with others which also confirm the above result.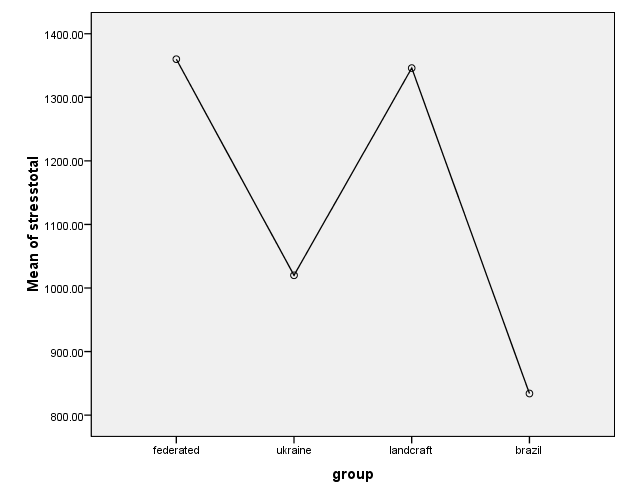 | Figures 4. Profile Plots for Stress Mtotal |
4. Conclusions
This study shows that Federated steel has the highest hardness value of 126.3 HV and Impact value of 149 HV among all the sizes of the iron rod followed by Land Craft Industrial with 190 HV. Ukraine has the least hardness of 130 HV. While Brazil has the least Impact value of 35.02J Federated steel has Ultimate Tensile strength (UTS) of 799.49MPa, Land Craft Industrial steel has 708.30MPa, Brazil steel has 538.51MPa followed by Ukraine with 544.81MPa. The yield strength for the Federated steel is 660MPa, Land Craft Industrial steel is 510MPa, and Brazil has 440MPa. Ukraine Steel with 420MPa. ANOVA test confirmed the results at 95% confidence and further showed that there was significant difference between the four samples. There existed significance difference between land craft and Ukraine, as well as between land craft and Brazil (mean differences = 326. and 512. respectively, at p<0.05).
ACKNOWLEDGEMENTS
I wish to acknowledge the management of Tshwane University of Technology, Chemical metallurgical and material engineering Department, Pretoria, South Africa, for the usage of their equipment.
References
| [1] | Shetty, S.D. Shetty P., Nayale, H.V., Serb, S. J. Chem. Soc, 71 (10) (2016) 1073. |
| [2] | Fish, P.M. Woodhead Pub, ltd, Cambridge, (1995). |
| [3] | Ajayi, J. A., Joseph O. O., Oloruntoba D. T., Joseph O. O. Int. J. Metall. & Mat. Eng. 3 (2013) 85. |
| [4] | Joseph O. O., Abidakun O. A., Aniyikaye A. O., Folorunsho O. O. Industr. Eng. Lett. 3 (2013) 46. |
| [5] | Lakhtin, Y. (1988), Engineering physical metallurgy and heat treatment, Mir publishers, Moscow, Russia, pp. 71-78. |
| [6] | Tarsuro, et al (2001), Microstructure and Mechanical Properties of hot rolled bars for machine use, pp.241-256. |
| [7] | Sanmbo, B., David, E., Adeosun, S. and Olatunde, S. et al. (2009): “Challenges of Pproducig Proerties Construction Steel Bars in West Africa”. Journal of Materials and Materials Characterization and Engineering. Vol. 8, No. 4, pp 283-292. |
| [8] | Ayininuola, G.M. Olalusi. O.O (2004), Assessment of building failures in Nigeria: Lagos and Ibadan case study. African Journal of science cue and technology (AJST). Science and engineering series vol, 5, no 1. pp.73-78. |
| [9] | Williams D.B (1984), Practical Analytical Electron Microscopy in material science Verlag Chemic International, Weinheim. |
| [10] | Llwellyn, D. T. (1992), “Low-carbon structural steels.” steels, metallurgy and applications, pp 64-119. |
| [11] | Anthony Nkem Ede (Ph.D), Emmanuel Oluwabukunmi, Egunjobi Gideon, Olukunle Bamigboye and Jadesola Ogundeji, Assessment of Quality of Steel Reinforcing Bars Used in Lagos, Nigeria. |
| [12] | American Society for Testing of materials. Standard Test Methods for Tension Testing of Metallic Materials. ASTM E8 / E8M - 16a. |
| [13] | American Society for Testing of materials (2015), Standard Specification for general requirements for steel bars, Carbon and alloy. ASTM/A29M-15. |
| [14] | American Society for Testing of materials. Standard Test Methods for Impact Testing of Metallic Materials. ASTM E23. |
| [15] | BS 4449:1997. Specification for Carbon steel bars for the reinforcement of concrete: British Standards Institution. |
| [16] | Rao K.L. (1961), Calculation, Design and Testing of Reinforced Concrete; Isaac Pitman Ltd.; London; pp.1 – 21. |
| [17] | Joseph O.O. F.I. Alo (2014), An Assessment of the Microstructure and Mechanical Properties of 0.26% Low Carbon Steel under Different Cooling Media: Analysis by One-way ANOVA. Industrial Engineering Letters, ISSN 2224-6096 (Paper) ISSN 2225-0581 (online) Vol.4, No.7. |
| [18] | Saavedra, J. T., Naya, S., Fernández, M. F., Artiaga, R., Beceiro, J. L. (2011), “Application of functional ANOVA to the study of thermal stability of micro–nanosilica epoxy composites”, Chemometrics and Intelligent Laboratory Systems 105 (1), 114-124. |
| [19] | Ulusoy, U. (2008), “Application of ANOVA to image analysis results of talc particles produced by different milling”, Powder Technology 188 (2), 133-138. |
| [20] | Classification under non-normality, Journal of Statistical Planning and Inference 89 (1-2), 269-285. |
| [21] | Valeria L. de la Concepciona, Hernan N. Lorussoa, Hernan G. Svaboda (2015), Effect of carbon content on microstructural and mechanical properties of dual phase steels. International Congress of science and technology of Metallurgy and materials, SAM_CONAMET 2013, Procedia Materials Science 8 (2015) 1047 - 1056. |

 Abstract
 Reference
 Full-Text PDF
 Full-text HTML