| [1] | Kuriakose, S., Patowari, P.K. & Bhatt. J. (2017). Machinability study of Zr-Cu-Ti metallic glass by micro hole drilling using micro-USM. Journal of material processing technology. 240; 42-51. |
| [2] | Wang, J., Feng, P., Zhang, J., Cai, W. & Shen. H. (2016). Investigations on the critical feed rate guaranteeing the effectiveness of rotary ultrasonic machining. Ultrasonic. 74; 81-88. |
| [3] | Li, G., Yu, Z., Song, J., Li. C., Li. J. & Natsu, W. (2016). Material removal mode of quartz crystals by Micro USM. Procedia CIRP. 42; 842-846. |
| [4] | Lin, Y.C., Hung, J.C. Chow, H.M. Wang, A.C. & Chen, J.T. (2016). Machining characteristics of a hybrid process of EDM in gas combined with ultrasonic vibration and AJM. Procedia CIRP. 42; 167-172. |
| [5] | Khairay, A.B.E. (1990). Assessment of some dynamic parameters for the ultrasonic machining process. Wear. 137; 187-198. |
| [6] | Choi, J.P., Jeon, B.H. & Kim, B.H. (2007). Chemical-assisted ultrasonic machining of glass. Journal of material processing technology. 191; 153-156. |
| [7] | Guzzo, P.L., Shinohara, A.H. & Rasian, A.A. (2004). A comparative study on ultrasonic machining of hard and brittle materials. Journal of material processing technology. 26; 56-61. |
| [8] | Hofy, H.E.L. Advanced Machining Process. Second ed. Mcgraw- Hill, Egypt; 2012. |
| [9] | Jatinder, K. & Khamba, J.S. Modeling. (2010). The material removal rate in ultrasonic machining of titanium using dimensional analysis. International journal of advanced manufacturing technology. 48; 103-119. |
| [10] | Lee, T.C. & Chan, C.W. (1997). Mechanism of ultrasonic machining of ceramic composites. Journal of material processing technology. 71; 195-201. |
| [11] | Singh, K. & Ahuja, I.P.S. (2014). Ultrasonic machining processes review paper. International journal for multi-disciplinary engineering and business management. 2; 57-66. |
| [12] | Singh, K. & Singla, V.K. (2014). Finite element analysis of ultrasonic machine tool. International journal of engineering research & technology. 3; 1647-1650. |
| [13] | Singh, R. & Khanba, J.S. (2008). Comparison of slurry effect on machining characteristics of titanium in ultrasonic drilling. Journal of material processing technology. 197; 200-205. |
| [14] | Singh, R. & Khamba, J.S. (2007). Taguchi technique for modelling material removal rate in ultrasonic machining of titanium. Materials science and engineering. 460-461; 365-369. |
| [15] | Thoe, T.B., Aspinwall, D.K. & Wise, M.L.H. (1998). Review on ultrasonic machining. Journal of machine tool and manufacture. 38; 239-255. |
| [16] | Vinod. Y. & Aniruddha, D. (2008). Design of horn for rotary ultrasonic machining using the finite element method. International journal of advanced manufacturing technology. 39; 9-20. |
| [17] | Zhang, Q.H., Zhang, J.H., Jai, Z.X. & Sun, J.L. (1999). Material removal rate analysis in the ultrasonic machining of engineering ceramics. Journal of material processing technology. 88; 80-184. |
| [18] | Hasani, H., Tabatabaei., S.A. & Amiri, G. (2012). Grey relational analysis to determine the optimum process parameters for open end sprnning yarns. Journal of engineering fibers and fabrics. 7 (2); 81-86. |
| [19] | Hasiao, Y.F., Tarng, Y.S. & Huang, W.J. (2008). Optimization of plasma are welding parameters by using the Taguchi method with the Grey relational analysis. Materials and manufacturing processes. 23; 51-58. |
| [20] | Lin, C.L., Lin, J.L. & Ko, T.C. (2002). Optimisation of EDM process based on the orthogonal array with fuzzy logic and grey relational analysis method. International journal of advanced manufacturing technology. 19; 271-277. |
| [21] | Lin, Y.C. & Lee, H.S. (2009). Optimization of machining parameters using magnetic-force-assisted EDM on grey relational analysis. International journal of advanced manufacturing technology. 42; 1052-1064. |
| [22] | You, M.L., Shu, C.M., Chen, W.T. & Shyu, M.L. (2017). Analysis of cardinal grey relational grade and grey entropy on achievement of air pollution reduction by evaluating air quality trend in Japan. Journal of cleaner production. 142 (4); 3883-3889. |
| [23] | Patil, P.J. & Patil, C.R. (2016). Analysis of process parameters in surface grinding using single objective Taguchi and multi-objective grey relational grade. Perspective in Science. 8; 367-369. |
| [24] | Das, B., Roy, S., Rai, R.N. and Saha, S.C. (2016). Application of greay fuzzy logic for the optimization of CNC milling parameters for Al-4.5% Cu-TiC MMCs with multi performance characteristics. Engineering science and technology, an international journal. 19(2); 857-865. |
| [25] | Ahmad, N., Kamal, S., Raza, Z.A. & Hussain, T. (2016). Multi-response optimization in the development of oleo-hydrophobic cotton fabric using Taguchi based grey relational analysis. Applied surface science. 367; 370-381. |
| [26] | Lin, Y.H., Lee, P.C. & Chang, T.P. (2009). Practical expert diagnosis modal based on the grey relational analysis technique. Expert system with applications. 36; 1523-1528. |
| [27] | Lin, H.L. (2012). The use of the Taguchi method with grey relational analysis and a neural network to optimize a novel GMA welding process. Journal of intelligent manufacturing. 23(5); 1671-1680. |
| [28] | Manivannan, S., Prasanna, S. & Aramugam, R. (2011) Multi-objective optimization of flat plate heat sink using Taguchi based grey relational analysis. International journal of advanced manufacturing technology. 52; 739-749. |
| [29] | Meena, V.K. & Azad, M.S. (2012). Grey relational analysis of micro EDM machining of Ti-6Al-4V alloy. Material and manufacturing processes. 27; 973-977. |
| [30] | Singh, P.N., Raghukandan, K. & Pai, B.C. (2004). Optimization by grey relational analysis of EDM parameters on machining Al-10%SiCp composites. Journal of material processing technology. 155-156; 1658-1661. |
| [31] | Sreenivasulu, R. & Srinivasarao, C., (2012). Application of Grey relational analysis for surface roughness and roundness error in drilling of AL 6061 alloy. International journal of lean thinking. 3(2); 68-78. |

 Abstract
 Reference
 Full-Text PDF
 Full-text HTML

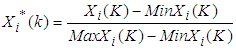
 is the sequence after the data processing,
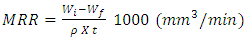
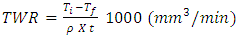
  is the comparability sequence, K=1 and k=4 for MRR; i= 1,2,3………27 for experiment number 1 to 27.TWR and SR are the important measure of USM, these output parameters are represent the machining accuracy under selected input parameters (Patil & Patil 2016; Das et al. 2016). To get the optimum performance the “Smaller-the-better” characteristic has been preferred to normalize the original sequence date by equation 4.
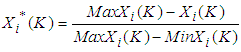
 is the sequence after the data processing,
  is the comparability sequence, K=2, K=5 for TWR and K=3, K=6 for SR; i= 1,2,3………27 for experiment number 1 to 27.
  is the value after grey relational generation,
  and
and  are the smallest and largest value of
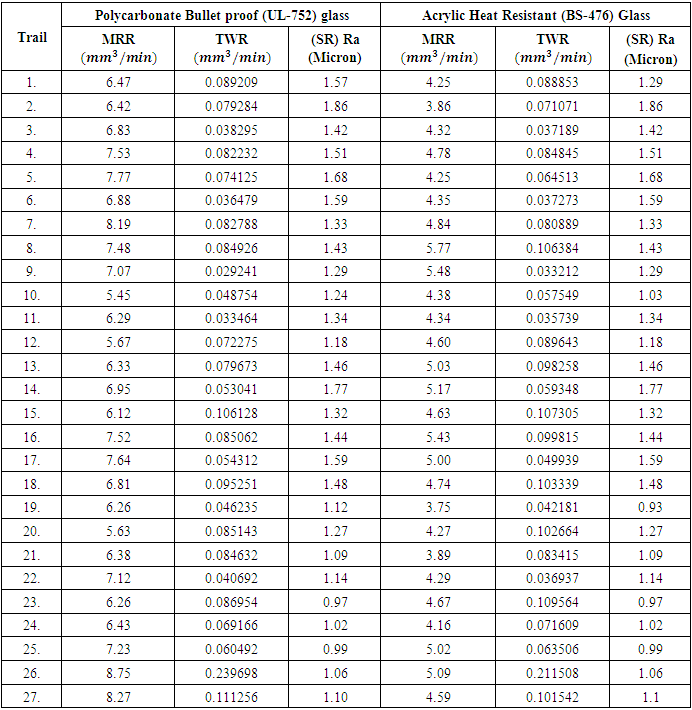
  . After normalized MRR, TWR and SR of PBPG UL-752 and AHRG BS-476 comparable sequence is shown in the Table 5.
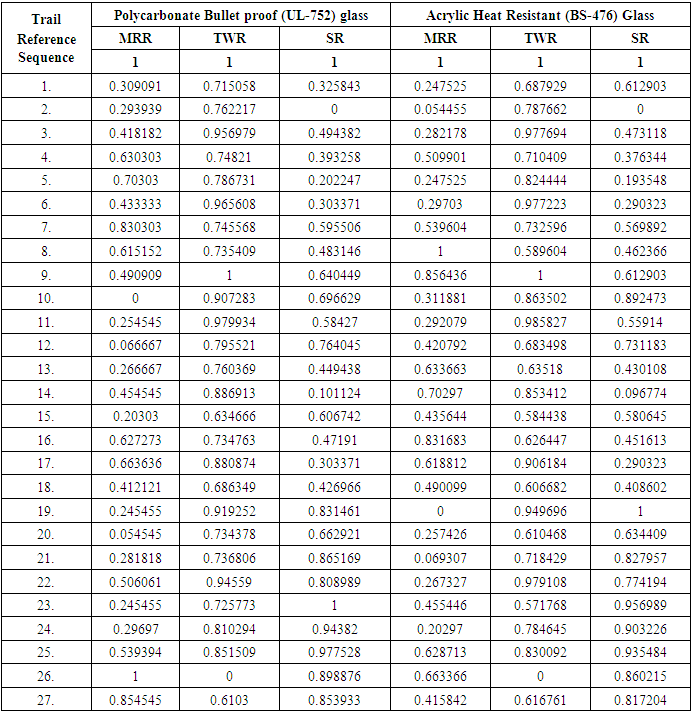
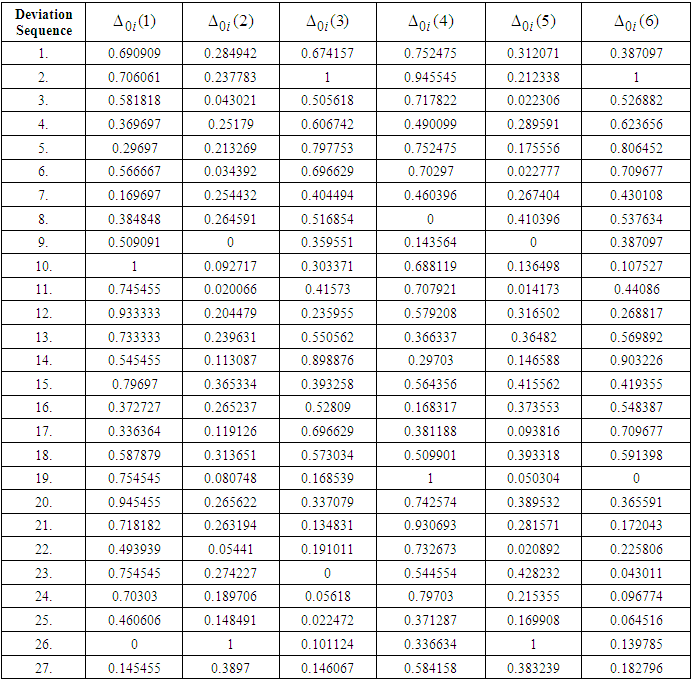
 is the deviation sequence between reference sequence
  and the comparability sequence
  (Ahmad et al. 2016). Deviation sequence is calculate by the equation 5 and maximum and minimum difference is found, K=1, 2 and 3 and i= 1, 2, 3…27.
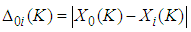
 and Minimum
  are obtained and shown below.
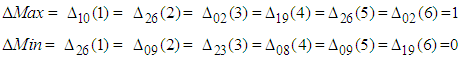
 can be expressed as equation 6 is shown below.
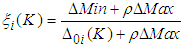
 is the deviation sequence of the reference sequence
  and the comparability sequence,
  is distinguishing or identification coefficient. In this calculation
  because all parameters are given equal preference (Lin 2012). The Grey relation coefficient for each experiment of the L27 orthogonal array is calculated by using equation 6 and shown in Table 7.
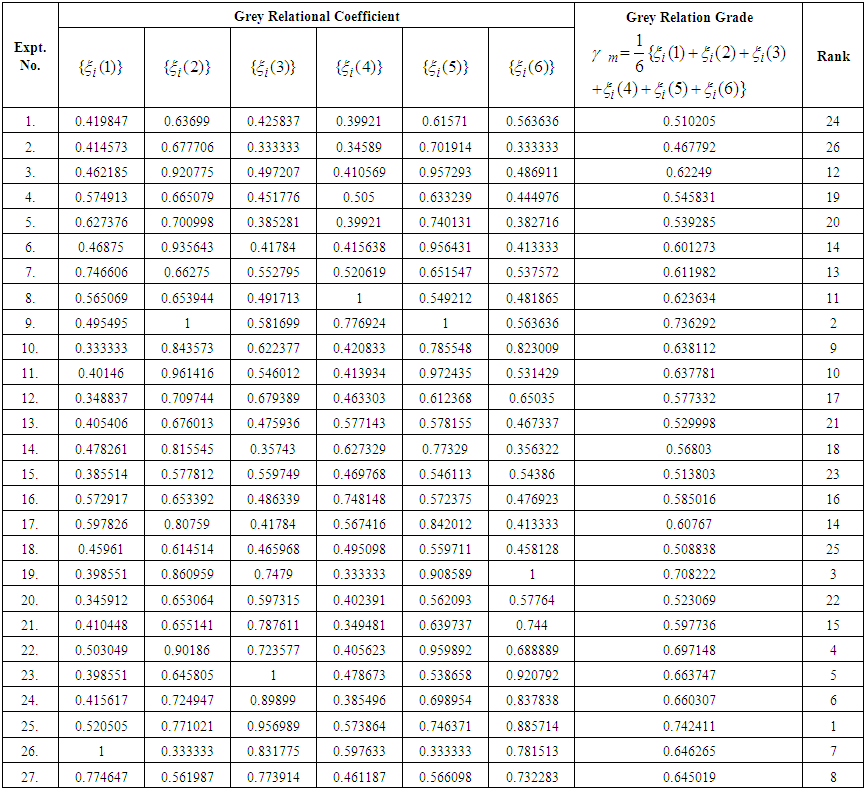
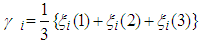
 is obtained by averaging the Grey relation coefficient corresponding to each performance characteristic and represent by
 and
and  Equation 7 (Manivanna et al. 2011) show the general formula of Grey relation grade and equation 8 is for three output parameters, shown in Table 7.
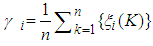
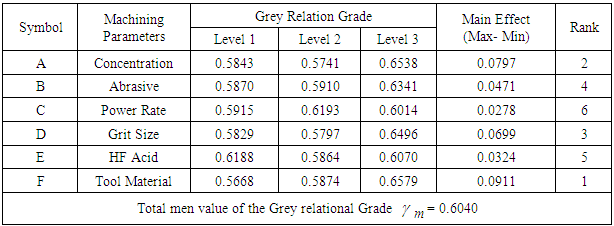
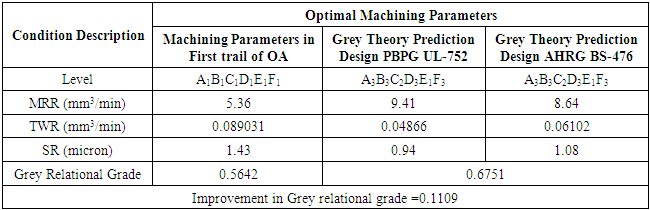
 using the optimal level of machining parameters can be calculated by using equation 9 (Meena & Azad 2012; Singh et al. 2004; Sreenivasulu & srinivasarao 2012).
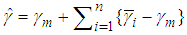
 is the total mean of Grey relational grade,
  is mean of the Grey relational grade at optimum level and n is the number of parameters that significantly affect multiple-performance characteristics. It is clearly show that the multiple-performance characteristics in USM process is greatly improved through this study.