-
Paper Information
- Paper Submission
-
Journal Information
- About This Journal
- Editorial Board
- Current Issue
- Archive
- Author Guidelines
- Contact Us
International Journal of Materials Engineering
p-ISSN: 2166-5389 e-ISSN: 2166-5400
2016; 6(4): 119-125
doi:10.5923/j.ijme.20160604.01

Aspects of Mechanical Stress Grading for Structural Timber
 Abstract
 Reference
 Full-Text PDF
 Full-text HTML
Julio César Pigozzo1, Felipe Nascimento Arroyo2, Raquel Schmitt Cavalheiro3, André Luis Christoforo2, Everaldo Pletz4, Francisco Antonio Rocco Lahr5
1Department of Civil Engineering, Technology Center, State University of Maringá (UEM), Maringá, Brazil
2Centre for Innovation and Technology in Composites - CITeC, Department of Civil Engineering (DECiv), Federal University of São Carlos, São Carlos, Brazil
3Department of Materials Engineering, São Paulo University (EESC/USP), São Carlos, Brazil
4University Center Dynamics of Cataratas, Foz do Iguacu, Brazil
5Department of Structural Engineering, São Paulo University (EESC/USP), São Carlos, Brazil
Correspondence to: André Luis Christoforo, Centre for Innovation and Technology in Composites - CITeC, Department of Civil Engineering (DECiv), Federal University of São Carlos, São Carlos, Brazil.
| Email: |  |
Copyright © 2016 Scientific & Academic Publishing. All Rights Reserved.
This work is licensed under the Creative Commons Attribution International License (CC BY).
http://creativecommons.org/licenses/by/4.0/

The development of standard methods and criteria for the stress grading of structural timber elements by non-destructive, fast and cheap bending tests, will allow producers, distributors and customers of such elements, have a better control of the marketed product. This paper analyzes the most suitable length of free span for stress grading of structural timbers, number of points to be assayed in each element, data precision and evaluation of cost of these tests for small business.
Keywords: Stress grading, Structural size pieces, Mechanical characteristics
Cite this paper: Julio César Pigozzo, Felipe Nascimento Arroyo, Raquel Schmitt Cavalheiro, André Luis Christoforo, Everaldo Pletz, Francisco Antonio Rocco Lahr, Aspects of Mechanical Stress Grading for Structural Timber, International Journal of Materials Engineering , Vol. 6 No. 4, 2016, pp. 119-125. doi: 10.5923/j.ijme.20160604.01.
1. Introduction
- Wood is a wide-spread used in several applications such as in construction [1-3] whose useful potential is growing due to the introduction of new technologies as the laminated glued wood [4-6].As found by [7] there are many difficulties in the recognition of species available in the market, which are usually from far regions and marketed with regional names. In his studies, the author described that from a set of sixty eight samples, twenty one were positively identified, from which eighteen percent had changed names and twenty nine percent were identified with the regional name or similar ones.Even nowadays, it still being developed timber structural projects based on strength classes, regarding the species marketed in certain region. Based on the mechanical stress grading, not yet applied by most of timber producers and distributors it will be allowed to group several species with similar mechanical characteristics, joining the pieces with better properties into the top strength class resulting in better rationality in the usage of the forestry resources as in higher use and safety of the structural timbers. The classification process does not look for choosing the defect-free pieces, but instead to admit the higher number of defects without unnecessary discard of material.Classification of structural timber by non-destructive bending tests is universally accepted, however the loading, relation between free span and specimen thickness and natural variability result in spread results. For local timber samples many important conclusion have been drawn for definition of normative methods and criteria, based on bending tests with the load applied in the center of the free span. These tests were considered fast, simple and of low cost for a preliminary classification at producers, distributors and even customers of structural timber products. Such preliminary classification will give to the specimens the same treatment conditions as those given to other structural materials and the knowledge of the mean resistance of a lot will not discard the normalized characterization.Made some non-destructive bending tests applying the load at the center of the 3.00 m free span in Peroba Rosa (Aspidosperma polyneuron) samples, with 6.0 × 16.0 cm cross section. He idealized a worksite test with simple equipment and small changes in the loading point and performed by untrained staff. The load was a 20 or 50 kg block hanging on the beam. The same samples were assayed in the laboratory in the static mode and controlled loading of 10 MPa/min, resulting in modulus of elasticity in static bending (E) with averages comparable within 95% confidence level. Variation coefficients of 21.72% and 17.36% were determined for the worksite and laboratory assays respectively. Linear regression analysis revealed correlation coefficient of 0.8741 between the elasticity modulus. The average assaying time were two minutes in the worksite and ten to fifteen minutes in laboratory.Studied the bending modulus of elasticity in samples of eight Brazilian species, L/h ratio, the L is the free span and h is the height of the piece, using beams supported in both ends with centered load by the expression: Ea= PL³/48fI (disregarding the effect of the cutting forces in the displacement f). The author demonstrated that the apparent bending modulus of elasticity, Ea, was constant in the 21 < L/h < 26, meaning that Ea has the same value as the real modulus for L/h = 21. Relating Ea with the two dimensions of the section of the pieces, b/h, and using Paraná Pine (Araucária angustifólia) and Peroba Rosa (Aspidosperma polyneuron), it was demonstrated that the bending modulus of elasticity (E) do not change with b/h for a given L/h ratio. Comparing the real bending modulus of elasticity (E) and the parallel compression modulus of elasticity it was demonstrated that the average values agreed within a 95% confidence level. [8-9].Studied six timber samples from Para State (Brazil), with cross section of 5.08 × 10.16 cm (2” × 4”) submitting such beams to a non-destructive bending assay in a Computermatic MK P IVa mechanical classifying machine. The 2617 N load was applied in the center of a 91.44 cm (3’) free span, taking the displacements at each 15.24 cm all along the specimen, with a linear speed of 60 m/min. The same samples were assayed in laboratory simulating the static condition used by the classifying machine, but with a displacement speed of 8.23 mm/s. The loading were applied at the points: weaker, stronger and central of each specimen as indicated by the machine. Comparing the modulus of elasticity obtained in the laboratory with those from the classifying machine a coefficient of correlation of 0.77 was found using linear regression, although a higher value was expected. The differences were attributed to the higher speed of the machine (110 times higher) and displacement of the specimens influenced the results [10].Concluded that the speed of deformation from 6.3 to 37 MPa/min do not significantly affect the results of the bending modulus of elasticity, thus for each 1000% of increase in the speed there is a 5% increase in the EM, justifying the use of loads in the shape of controlled weight blocks, but did not used loading speeds as fast as those applied by the classifying machines [11].Proposed a non-destructive visual and mechanical Classifying assay based on bending and using free spans of 1.50 and 3.00 m with central loading for the evaluation of the timber pieces received in worksites, to be used in reinforced concrete molding. The authors observed that the structural function of the pieces were temporary and their dimensions represented battens, rafters and props.As those previous papers were developed at different times and with different focus it is not possible to draw an ultimate conclusion concerning the mechanical classification of structural timber pieces [12].Thus the present works aim to define the most adequate free span for non-destructive bending assays for structural timber pieces considering the commercial dimensions, defining the minimum number of sampling points, analyzing the precision of the results and analyzing the cost of such assays.
2. Material and Methods
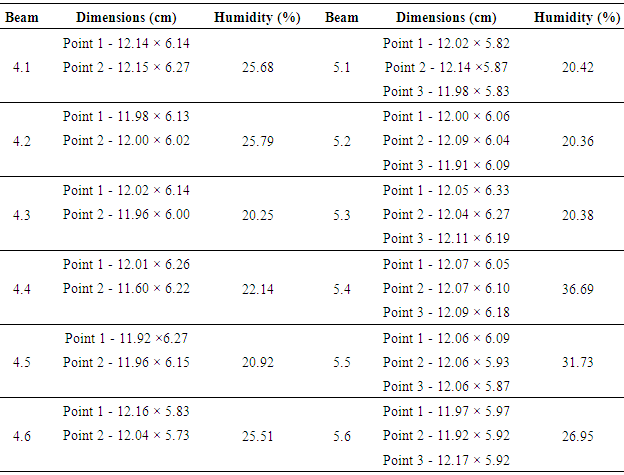
- Twelve specimens from Envira (Sterculia sp) wood, were subjected to simple bending assays with loading in the Center of the 3.00 m free span, all of them with nominal cross section of 6.00 × 12.0 cm, being six of these specimens 4.00 m and other six 5.00 of total length. These pieces were assayed with loadings at A and B positions, respectively perpendicular to the lower and higher inertia axis at points 1 and 2 for the 4.00 m and at 1, 2 and 3 for the 5.00 m long beams, as represented in Figure 1.
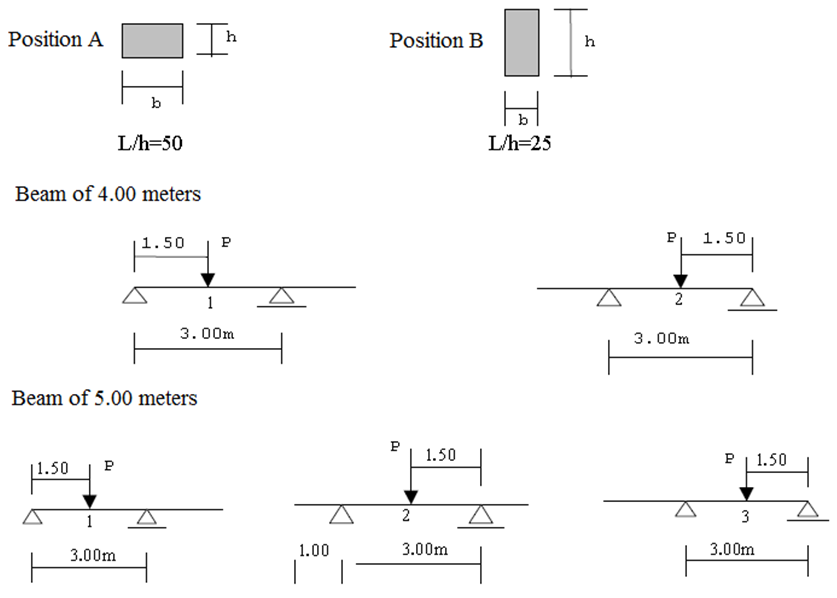 | Figure 1. Representation of the strength in the beams assayed |
 as well as
  the score t is adopted, according to [14].
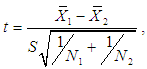 in which:
 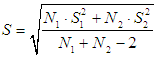 Being
Being  and
and  the size,
  and
and  the variance
  and
and  the average values for the samples. Based on the bilateral test within 95% of confidence level, H0 is acceptable when t falls within the t0.025 a t0.975 interval for the degree of freedom
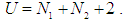
3. Results and Discussion
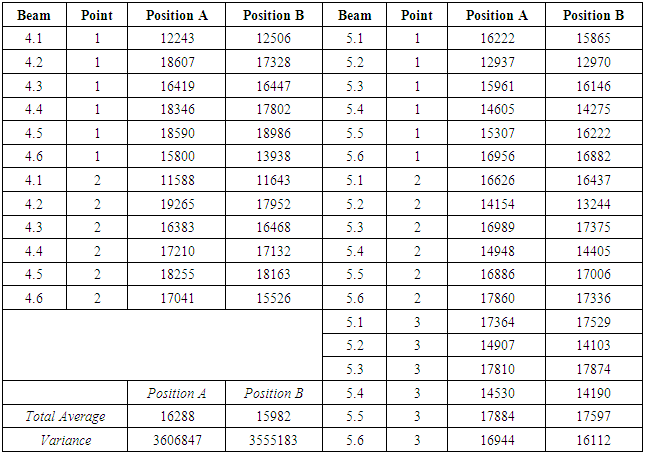
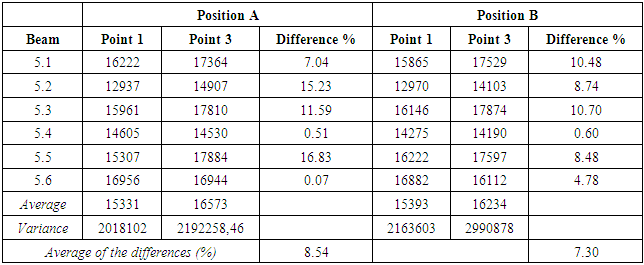
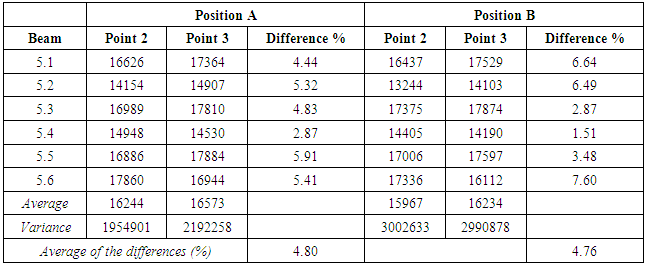
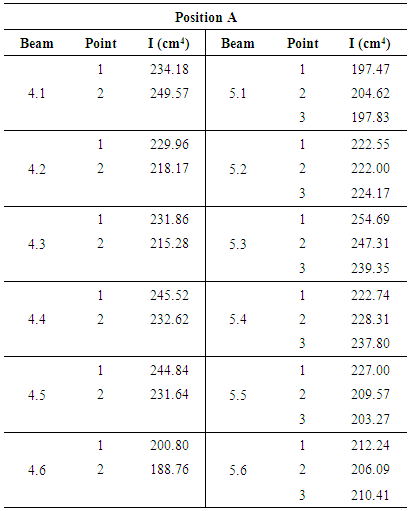
- Tables 2 to 6 present the individual results for the modulus of elasticity of the structural pieces as well as the average value, variance coefficient and average of the variances.The ration between the applied load and the displacement of a beam depends on its average stiffness, however as can be seem from Table 1, from which each the dimensions may vary up to 3% of the nominal dimension, resulting in a variation of 12% in the moment of inertia regarding the nominal moment of inertia. Table 7 presents the moment of inertia calculated with the beam dimensions at the loading point, according to the data in Table 1.
|
|
|
|
|
|
|
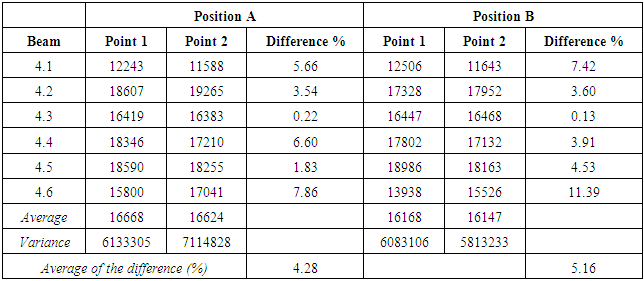
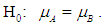 Comparison between the EM, 12%, in points 1 and 2 for the 4.00 m long beam:For the hypothesis H0 that the averages
  are statistically equivalent, respectively in the points 1 and 2 for the 4.00 m long beam, according to Table 3, one have:a) Position AS = 2819.37 and t = 0.0269; for U = 10, t0.025 = -2.23 and t0.975 = 2.23;Thus: -2.23 < t < 2.23.At the 95% confidence level one can accept the hypothesis
  b) Position BS = 2671.67 and t = 0.0130; for U =10, t0.025 = -2.23 and t0.975 = 2.23;Thus: -2.23 < t < 2.23.At the 95% confidence level one can accept the hypothesis
  Comparison between the EM, 12%, in points 1 and 2 for the 5.00 m long beam:For the hypothesis H0 that the averages
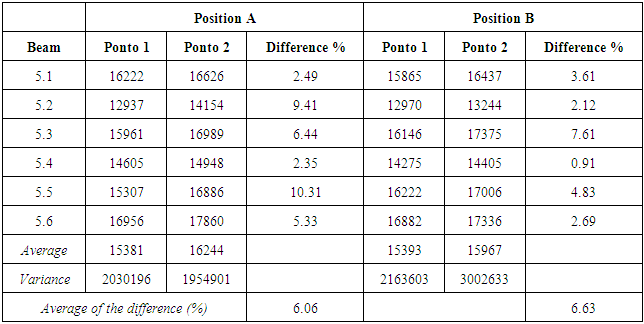
  are statistically equivalent, respectively in the points 1 and 2 for the 5.00 m long beam, according to Table 4, one have:a) Position AS = 1546.30 and t = -0.967; for U =10, t0.025 = -2.23 and t0.975 = 2.23;Thus: -2.23 < t < 2.23.At the 95% confidence level one can accept the hypothesis
  b) Position BS = 1760.61 and t = -0.565; for U =10, t0.025 = -2.23 and t0.975 = 2.23;Thus: -2.23 < t < 2.23.At the 95% confidence level one can accept the hypothesis
  Comparison between the EM, 12%, in points 1 and 3 for the 5.00 m long beam:For the hypothesis H0 that the averages
  are statistically equivalent, respectively in the points 1 and 3 for the 5.00 m long beam, according to Table 5, one have:a) Position AS = 1589.41 and t = -1.353; for U = 10, t0.025 = -2.23 and t0.975 = 2.23;Thus: -2.23 < t < 2.23.At the 95% confidence level one can accept the hypothesis
  b) Position BS = 1758.60 and t = -0.828; for U =10, t0.025 = -2.23 and t0.975 = 2.23;Thus: -2.23 < t < 2.23.At the 95% confidence level one can accept the hypothesis
  Comparison between the EM, 12%, in points 2 and 3 for the 5.00 m long beam:For the hypothesis
  that the averages
  are statistically equivalent, respectively in the points 2 and 3 for the 5.00 m long beam, according to Table 6, one have:a) Position AS = 1577.43 and t = -0.361; for U = 10, t0.025 = -2.23 and t0.975 = 2.23;Thus: -2.23 < t < 2.23.At the 95% confidence level one can accept the hypothesis
  b) Position BS = 1896.34 and t = -0,243; for U =10, t0.025 = -2.23 and t0.975 = 2.23;Thus: -2.23 < t < 2.23.Ao nível de significância de 95%, pode-se aceitar a hipótese
  At the 95% confidence level one can accept the hypothesis
  Analysis of the Moment of inertia variations:In position A the nominal moment of inertia is INominal = 216.00 cm4. With the changes in dimensions as a function of the processing, the moments of inertia present the following behavior in the points in which they were determined:Average value: IAverage = 223.02 cm4;Standard deviation: s = 17.36 cm4; andVariance coefficient: cv = 7.78%.Thus one have the ratio: INominal = 0.97 IAverage.
4. Conclusions
- For the beam without visually detectable defects, it is possible to determine the bending modulus of elasticity only for position A, once the results in position A and B were statistically equivalents within the 95% confidence level. In the specimens investigated it was demonstrated that for two points distant one or two meters the EM values were also statistically equivalents at the 95% confidence level, in a such way that the four or five meter long beam could have their EM values determined in a single assay. The structural pieces are usually marketed with two up to six meter long with their lengths varying from half to half meter. For such pieces the L/h ratio is significant and allow a single assay for the most of the dimensions available in the market.In the measurements performed in the cross sections of the beam investigated, a 3% change in the dimensions was observed which was attributed to the processing. As a consequence the change in the moment of inertia varies 12%. In practice a 0.97 ratio between the nominal moment of inertia and the average value for this figure. It is a preliminary estimative to be confirmed by the evaluation of a higher sampling of structural pieces. The resulting value will used as a suggestion for changing in the Brazilian standard [13] in which it will be suggested the non-destructive procedures for classifying timber structural pieces.Using simpler equipment as dynamometer ring with precision of 1.0 N, mechanical extensometer, a caliper with precision of 0.01 mm and an electrical meter of humidity, it is possible to determine the EM of structural timber pieces with enough precision. As demonstrated by [8] only one level of loading is enough, under elastic regime, to define the P\f ratio. According to [11] the deformation speeds under usual conditions from 6.3 up to 37.0 MPa/min do not affect the EM values and displacements at the loading point in the order of L/200 (cm) provoke deformation in the elastic regime for most of the natural specimens.The impact of the classifying cost in the final price of the timber will not bad consequences once the costumer will save buying lower volume of timber and using higher resistance classes with the possibility of acquiring pieces of the first level allowing that the partial modification coefficient Kmod 3 be equal to 1.0, according to the Brazilian standard [13], representing a raise of 25% in the resistance of calculus regarding the non-classified pieces.Finally, it is recommended that the present work go ahead expanding the experimental range in order to reach other species (including those from reforest) other commercial dimensions (6.0×16.0; 5.0×6.0; 2.5×30.0 cm, as examples) and other timber suppliers. It is also recommended confirming the results from [9] for six species by appropriate statistical evaluation of the data already available for fifty species, looking for a relationship between the static bending modulus of elasticity and the resistance of the wood to the compression parallel to the fibers.