-
Paper Information
- Next Paper
- Paper Submission
-
Journal Information
- About This Journal
- Editorial Board
- Current Issue
- Archive
- Author Guidelines
- Contact Us
International Journal of Materials Engineering
p-ISSN: 2166-5389 e-ISSN: 2166-5400
2016; 6(3): 77-84
doi:10.5923/j.ijme.20160603.03

Evaluation of Ultrasonic Attenuation in Mortars Structures Using the Argand Diagram
Hassan Bita, Bouazza Faiz, Ali Moudden, Hicham Lotfi, El Houssaine Ouacha, Mustapha Boutaib
Laboratory of Metrology and Information Processing, Ibn Zohr University, Faculty of Sciences, Agadir, Morocco
Correspondence to: Hassan Bita, Laboratory of Metrology and Information Processing, Ibn Zohr University, Faculty of Sciences, Agadir, Morocco.
| Email: |  |
Copyright © 2016 Scientific & Academic Publishing. All Rights Reserved.
This work is licensed under the Creative Commons Attribution International License (CC BY).
http://creativecommons.org/licenses/by/4.0/

The work presents a new method that tracks the total attenuation of the ultrasonic waves in a mortar during hydration. The method is based on a representation in the complex plane of reflection coefficient of waves backscattered by the mortar layer which takes the form of a circle in the vicinity of a resonance. Monitoring the diameter of the circle during all stages of hydration shows its sensitivity to changes in the microstructure of the material. A strong correlation exists between the diameter of the Argand circle and attenuation on samples with different compositions and at different temperatures. The correlation shows the ability of the parameter to detect the physical and chemical changes in the material and its accuracy for differentiating the phases of hydration.
Keywords: Attenuation, Ultrasonic, Mortar, Reflexion Coefficient, Argand Diagram
Cite this paper: Hassan Bita, Bouazza Faiz, Ali Moudden, Hicham Lotfi, El Houssaine Ouacha, Mustapha Boutaib, Evaluation of Ultrasonic Attenuation in Mortars Structures Using the Argand Diagram, International Journal of Materials Engineering , Vol. 6 No. 3, 2016, pp. 77-84. doi: 10.5923/j.ijme.20160603.03.
Article Outline
1. Introduction
- Ultrasound is widely used in many fields of science. Their applications are generally classified into two categories: high power ultrasound that can change the environment in which they propagate as in the case of sonochemistry [1-3] and very low power ultrasound used in diagnosis, measurement and non-destructive control. Recently the ultrasonic application is also extended to the civil engineering field. Several research studies have been conducted to characterize, in a nondestructive way, the cementitious materials [4-7]. These techniques have proven to estimate the mechanical and structural properties of these materials by measuring the velocity and attenuation.The ultrasonic wave propagation and interaction of these waves with the material are widely used for non-destructive evaluation. The properties of the propagation of these waves are directly related to the mechanical and structural properties of the materials in which propagate. In non-homogeneous or non-elastic media, the interaction of the wave with the microstructure causes attenuation losses. These losses are due to a combination of absorption and diffusion. The effect of absorption losses is due to the viscoelastic behavior of materials and scattering losses are due to the heterogeneity of the material [8-11]. Much research has shown that the attenuation is a function of frequency, others have shown that it also depends on the grain diameter of material [9-13].Cementitious materials are sometimes multiphase and are characterized by the existence of heterogeneity of different natures and also their evolution over time because of the very long process of hydration of mixed products. In these products, the nature misunderstood of the ultrasonic wave propagation greatly complicates the task of quantifying contributions of the various mechanisms to the total attenuation. Therefore, there are no models that explain accurately mitigation mechanisms in these materials [8, 11]. In this work, we present a new method to follow and evaluate the ultrasonic attenuation in a mortar during all phases of hydration using the Argand diagram.The resonant scattering theory [14, 15] provides that the propagation of sound waves in the material generates resonances in its thickness wherein each resonance is characterized by its frequency and its width. We are interested in resonances of the reflection coefficient of a plane mortar structure. In the vicinity of an isolated resonance representation in the complex plane of its imaginary part as a function of its real part (Argand Diagram) is a circle [16]. During its evolution mortar transforms from a viscous state to viscoelastic solid state then to elastic state. This transformation is accompanied by a variation of the ultrasonic attenuation. We show the sensitivity of the diameter of the circle Argand to the variation of the ultrasonic attenuation in the cementitious material during hydration. Correlations established experimentally possible to estimate the damping of ultrasound in the mortar only via the measurement of the diameter of the circle. This dimensionless diameter is later named parameter D.
2. Materials and Methods
2.1. Experimental Device
- The experimental device described in detail in a previous work [17], consists of a parallel sided container enclosing a thick layer of mortar dm= 15mm, irradiated at normal incidence by an ultrasonic wave emitted by a transducer of central frequency 0,5MHz which acts as emitter and receiver. The recording of the signals reflected by the Plexiglas / mortar / glass structure, is 15min all three days.
2.2. Theory
- Assuming that the three layers structures plexiglas, mortar and glass are flat, and by placing in the context of the theory of linear systems, the signal reflected by the mortar layer can be written as a sum of echo reflected by the interface Plexiglas / mortar and all the echoes that have undergone multiple reflections within the cementitious material:
 | (1) |
 | (2) |
 The Fourier transform of the signal emitted by the transducer passing through the coupling medium (water + Plexiglas) twice (round trip).
 The reflection coefficient of the i/ j interface.
 The transmittance of the i/j interface.
 The acoustic impedance of the medium i and the letters p, m, and g represent the Plexiglas, mortar and glass.
 The wave vector and
  the thickness of the mortar.The reflexion coefficient of the mortar layer can be written as a series of Debye:
 | (3) |
 | (4) |
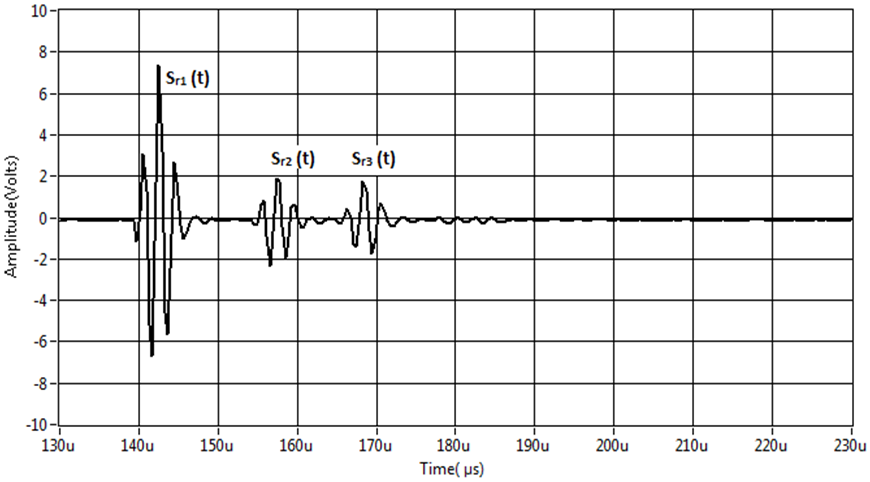 | Figure 1. Example of signal reflected by the various interfaces of the Plexiglas / mortar / glass structure |
 expressed in the imaginary part of the wave vector
  as follows:
 | (5) |
 The speed of the wave in the mortar.In the vicinity of a resonance, the Argand diagram is a circle with center
  and diameter D :
 | (6) |
2.3. Measures
- The experimental reflexion coefficient of mortar layer s obtained using the Fourier transforms ratio of the two echoes Sr2(t) and Sr3(t) reflected by the two mortar interfaces:
 | (7) |
 | (8) |
3. Results and Discussion
3.1. Variation of Parameter D with Frequency
- A representation of the experimental reflection coefficient modulus as a function of frequency for a mortar made of sand grain with size d = 315µm at room temperature T = 25°C is carried on the figure 2. The representation shows the resonance frequencies of the mortar structure corresponding to the minimum of the reflection coefficient. Equation (4) shows that the resonance frequencies where the minima of the reflection coefficient lie are such that:
 | (9) |
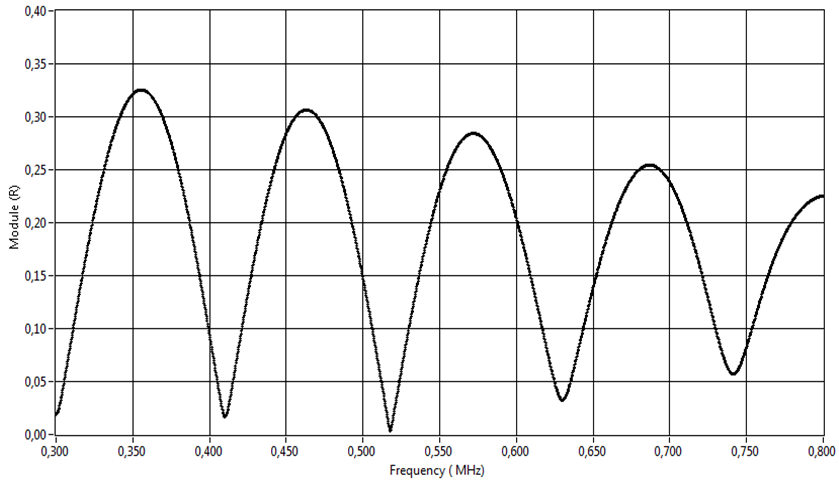 | Figure 2. A representation of the reflection coefficient modulus as a function of the frequency |
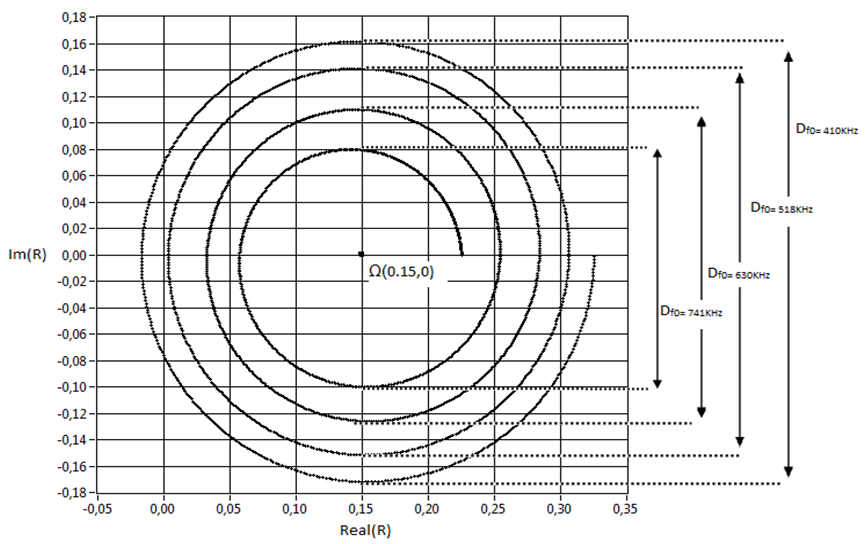 | Figure 3. Variation of the diameter of the Argand circle with frequency |
3.2. Sensitivity of the Parameter D to the Evolution of the Mortar Microstructure
- Monitoring the variation of the parameter D, corresponding to the resonance of order n = 5 during the evolution of the mortar from a young age to curing for 70 hours, is used to trace the curves representing the diameter D and its derivative function over time in Figure 4. in the figure we can distinguish five stages and four characteristic points. The four points corresponding to the extrema of the function derivative
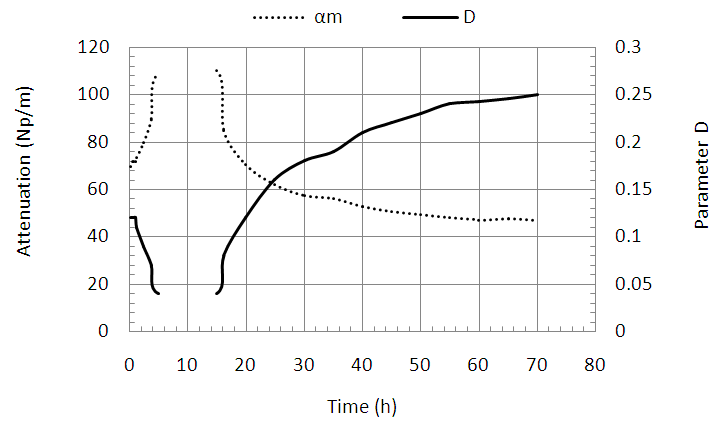
 used to locate the time in each of the mortar hydration phases described previously [17]. During the first stage called initial phase, which lasts about one hour, the mixed products are completely separate in water [19, 20] the diameter D remains constant D≅12. The end of the first step and the start of the second are marked by the first feature point A1. In this step, we observe a linear decrease of the parameter D over time; the derivative function is almost constant at this stage. In this phase, it begins the formation of first hydration products, but the bonds between the particles of cement are not yet well established; the material remains plastic and workable. The curves shown in Figure 5 show that during this time the total attenuation increases progressively in the opposite direction to the variation of the parameter D. From the characteristic point A2 we observe a rapid decrease of parameter D accompanied by a sharp increase in attenuation, and from the time t = 5h measuring the diameter of the circle is not possible because the signal is completely attenuated in the mortar [17]. At this stage, significant changes in the structure of the material appear, the rate of formation of hydrated products is very large and bonds between constituting of the mortar become solid. This step corresponds to the beginning of the intake phase, which is considered the most important in the structure of cementitious products. Taking phase is divided into two stages: the first is the acceleration period characterized by significant and continuous reduction of the diameter D and the second is the period of deceleration whose beginning is marked in the figure by the partial characteristic point A3 where the parameter D starts to increase. In fact, the curve representing the derivative function is decreasing indicating a decrease in the formation rate of the hydration products. The end of the setting period is marked by the characteristic point A4 from which the variation of the parameter D is very low indicating the start of the final stage of the hydration of the mortar. The diameter D tends to stabilize on a long-term time interval.
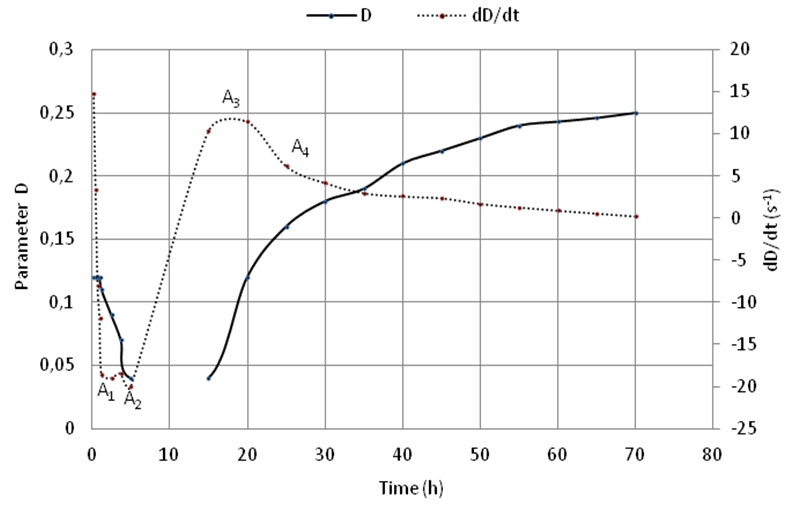 | Figure 4. Representation of parameter D and its derivative dD/dt according to the time |
 | Figure 5. Variation of parameter D and attenuation according to time |
3.3. Correlation between the Parameter D and the Attenuation
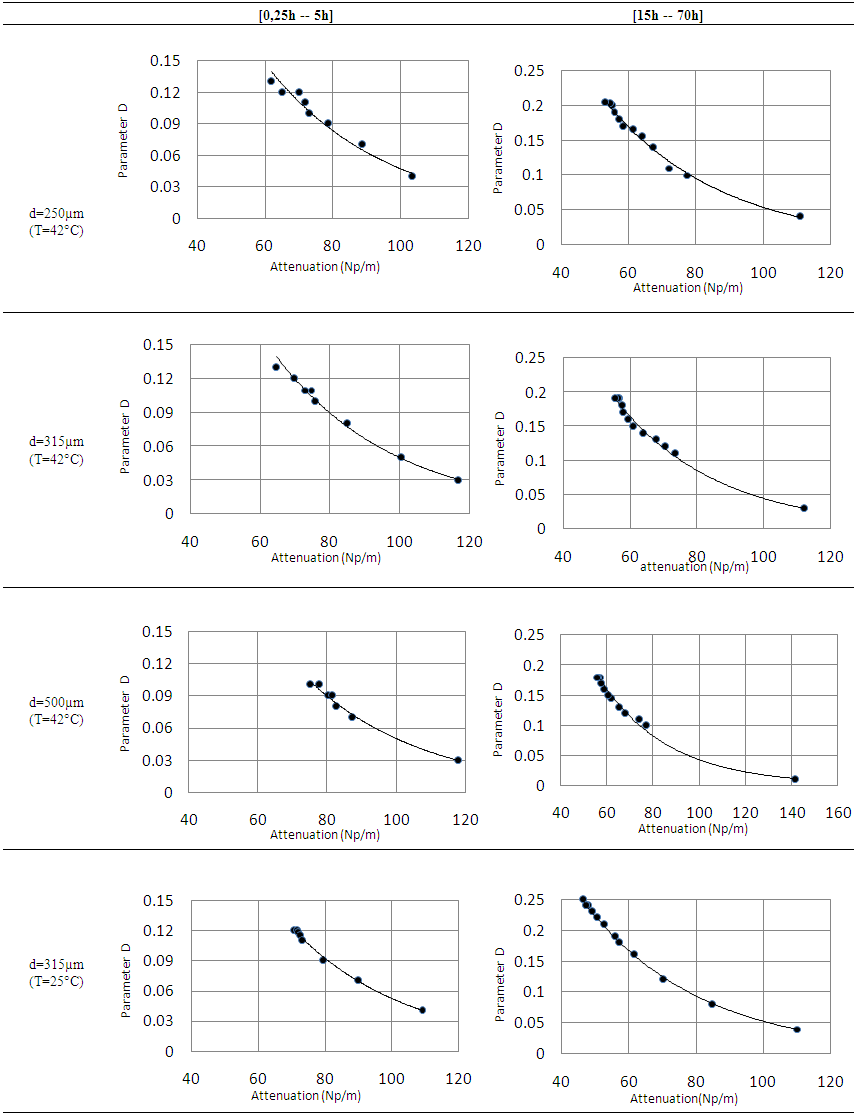
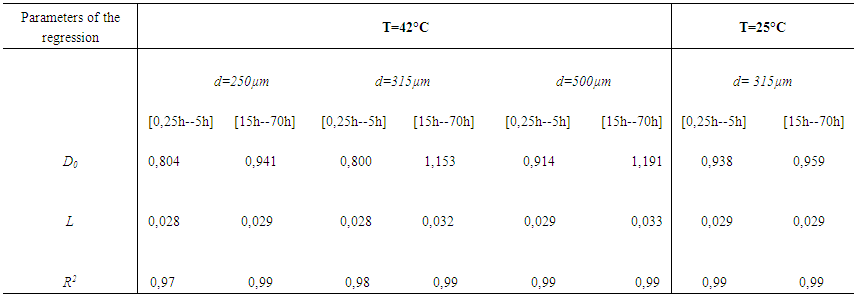
- The accuracy of the parameter D in the detection of different periods of hydration of the mortar, shows its sensitivity to any variation or change in the material microstructure. Figure 5 shows the variation of the parameter D compared to the attenuation in the mortar over time. We find that the attenuation is going through the same phases of hydration as parameter D. In the early hours, when the attenuation begins to increase, we observe a strong decrease of the parameter D. At the end of the setting period and during the hardening phase, the behavior of the two parameters is reversed; we note a decrease in attenuation over time against an increase in the diameter of the Argand circle. In the last phase, the rate of change of these two parameters becomes low. These important observations therefore show that there is a strong correlation between the two studied parameters.In Table 1, we gathered the curves representing the evolution of the parameter D depending on the total attenuation αm in two main phases of the mortar, liquid and solid for four mortars solutions prepared with sand grains of different sizes or different temperatures. The results show an exponential decrease of the parameter D when the total attenuation increases, this applies to all the prepared solutions in all mortar hydration phases. The results also show that the relationship between the parameter D and the total attenuation is unique and follows the law:
 | (10) |
 is the diameter of Argand circle at zero attenuation, it is dimensionless and
  is the distance traveled by the wave in the material in meters.
 | Table 1. Exponential fit of the parameter D depending of the total attenuation |
 | Table 2. Parameters of the exponential regression |
 | Figure 6. Temperature effect on the evolution of the parameter D |
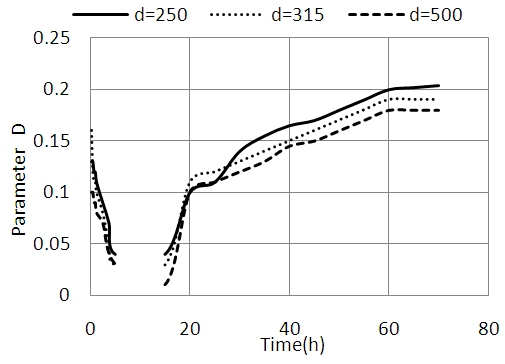 | Figure 7. Effect of the size of sand grains on the evolution of the parameter D |
4. Conclusions
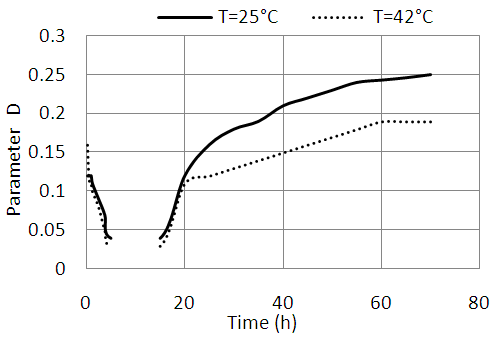
- This work presents a non-destructive characterization method of cementitious materials based on the representation of Argand. The extracted representation of this parameter is the diameter of the circle Argand. The ability of the parameter to detect the different physical and chemical transformations of the material is not affected by the variation of the temperature or the type of sand. Our experimental measurements on mortar samples show that the D parameter is especially important as temperature is low and the diameter of the sand grains is great. We also showed that the diameter of the Argand circle follows an exponential distribution of the total attenuation of ultrasound in the mortar. The fact that neither the general shape of the curves or correlation is affected by temperature and the nature of the sand, shows that the parameter D may be used as an indicator of the total attenuation; its measurement can therefore inform us on the microstructure and the health status of the material at all times. Parameter D can be used also to measure with great precision the thickness of the mortar.
 Abstract
 Reference
 Full-Text PDF
 Full-text HTML