Vilma França Monteiro1, Edgar Bacarji1, Orlando Ferreira Gomes1, Francisco Antonio Rocco Lahr2, André Luis Christoforo3
1School of Civil Engineering, Structures Department, Goiás Federal University (UFG), Goiania, Brazil
2Department of Structures Engineering (SET), São Carlos Engineering School (EESC/USP), São Carlos, Brazil
3Centre for Innovation and Technology in Composites (CITeC), Department of Civil Engineering (DECiv), São Carlos Federal University (UFSCar), São Carlos, Brazil
Correspondence to: André Luis Christoforo, Centre for Innovation and Technology in Composites (CITeC), Department of Civil Engineering (DECiv), São Carlos Federal University (UFSCar), São Carlos, Brazil.
| Email: |  |
Copyright © 2015 Scientific & Academic Publishing. All Rights Reserved.
Abstract
This research deals with theoretical and experimental studies of timber composite beams reinforced by cold formed steel sheets, submitted to bending. A combination of different materials aims to the exploitation the advantages of each material, of manner to have a viable set, in constructive, structural and economic issues. For the accomplish of the research were tested three timber beams with dimensions 40mm x 120mm x 1050mm, six timber reinforced beams in the superior surface with metallic profile with dimensions 50mm x 25mm x 2mm and six timber beams reinforced in inferior surfaces and in the superior surface with the same metallic profile. The spacing between the connectors was of 100mm, 200mm and 300mm. With the objective of supplying the necessary dimensioning, theoretical formularizations for these studies were presented to the determination of internal moment and the estimated deflection. For this, the timber mechanical properties, the steel and the connectors were determined. With the results of the characterization tests of the materials, the simple and composite beams were tested in bending, for reading of stresses and maximum vertical displacements of the rupture on the inferior and superior extremities. Such values were performed by means of electric strain gauges and dial gauges. Also, were determined: the tensions in the elements of the beams and presented the chart of stresses x displacements. It was observed that, in relation to the timber simple beam, it had average increase at the ultimate load, for beams with reinforced parts in the compressed surface, of 20%, and 49%, when placed stiffeners in compressed and tensioned surfaces. In deflection values, it had the average reduction of 15%, when used stiffeners in the superior surface and of 49% in the parts with stiffeners, in the surfaces were performed to compression and tension. The biggest reduction in deflections happened in beams with lesser spacing between connectors, indicating that the influence of the interaction is bigger in relation to displacements, to bending moment. In stress distribution chart in the cross sections it was adopted, in all cases, the triangular form for the timber and for the profile, it was adopted a rectangular form. It was obtained results that differ from the experimental values in 17% for simple beams, in 16% for parts hardened with profile in superior surface and 21% for the parts hardened with profile, in the surfaces upper and lower, indicating that the proposal formularization can be applied with safety. In the calculation of deflections of geometric properties of composite section, in elastic regime, were performed with the homogenized section. It was presented the equation for the determination of correction factor of the estimated deflection for the studied cases.
Keywords:
Theoretical and experimental studies, Timber composite beams, Cold formed profiles, Connectors
Cite this paper: Vilma França Monteiro, Edgar Bacarji, Orlando Ferreira Gomes, Francisco Antonio Rocco Lahr, André Luis Christoforo, Theoretical and Experimental Studies of Timber Composite Beams Reinforced by Cold Formed Steel Sheets, International Journal of Materials Engineering , Vol. 5 No. 3, 2015, pp. 50-63. doi: 10.5923/j.ijme.20150503.03.
1. Introduction
The choice of material to be used in construction structure is based on: offer, ease of obtaining, load capacity and assembly facility. The traditional choice of the timber is significant and is probably the most common, when it deals with trusses structures. Wood is a product originated from nature, with good mechanical strength to tension and an adequate compression parallel to the grains, ease of sawing, resulting, as a consequence, the sawdust, and also, is a renewable material. The wide variety of wood species takes obtaining durability, mechanical strength, colors and different textures. One of its disadvantages in relation to steel, it is a great deformability when requested to bending efforts.In relation to steel material is now widely used in structures, when it is need to save time with execution, and according to the CBCA (2006), this may represent 60% of the time spent with conventional reinforced concrete structure, as it enables to work with multiple simultaneous fronts of service, and not be affected by occurrence of bad weather. As for the own weight, the steel is lighter because of their slenderness, with regard to the concrete, resulting in more economic foundations. Another great advantage of the steel in the structure is its good mechanical strength, both tension and compression. The metallic structure can be disassembled and reassembled without difficulty and, if necessary, reinforced at the site of installation.There are laminated profiles, welded and folded sheet profiles. The folded sheets are produced from sheets in a variety of laminator plants. It is the processed way of metal between heated cylindrical rolls adjusted to give the thickness, width and length desired. After cold, the sheet is cut and folded in hinges, forming the desired profile.In order to make the most economical structural systems and without diminishing its safety and durability, emerged composite systems, generally compounded by two distinct types of materials.Good composite section behavior is ensured by a good connecting system, whose purpose is to make the two materials work together, making it possible to transfer efforts and prevent the detachment of the materials.Making use of good mechanical properties regarding to timber and steel, it is possible to obtain a composite system with greater efficiency, compared to the conventional system, consisting of a single material, whether timber or steel.The composite structures are used in various construction types like bridges, walkways, building floors, etc.According to [1], the composite beams consisted of a steel profile, bearing a concrete slab supported by the upper table and thereto linked by means of connectors, wherein was considered the most efficient structural system to support gravity loads of buildings. In accordance with the authors, originally, the composite beams were built with molded flat slabs "in situ", using removable molds. However, in industrialized countries, since 1960, North America, and in the late 1970s, in Europe, the system with built-in steel mold, or composite slab, was gaining popularity and is now the most widespread slab system in these countries.The behavioral study of composite structures, including the timber, has aroused the interest of many researchers, some of which are mentioned below:[2] it was studied the behavior of timber hardened beams with carbon and glass fibers. This study verified the efficiency of these reinforcements through experimental tests and made adequacy of representative mathematical models of this behavior.[3] it was thought the timber reinforced beams with sisal fibers. Bending and shear tests were performed to evaluate the strength and stiffness of the assembly, demonstrating the efficiency of this type of reinforcement.[4] it was developed a study on composite slabs of timber and concrete, which analyzed the current typologies, the available connecting systems, and the dimensioning methodology and verification of States Limits of Utilization prescribed by Eurocode 5.[5] it was analyzed the mechanical behavior of concrete-timber composite specimens, giving emphasis to the sliding modulus of metallic connectors of different diameters, whose values were compared with the values obtained in accordance with the provisions of Eurocode 5. A similar study was developed by [6].[7] it was studied the timber-concrete composite decks for bridges. Studies were made on glued anchoring steel bars in timber structural parts; study of shear connectors formed by steel bars, glued in timber, on timber-concrete composite specimens; studies on constructions and analysis of prototypes of timber-concrete composite decks.In these studies, the steel bars with deformed surface were glued into inclined holes in relation to the wood grains, using polyurethane resin and different types of epoxy resin, considering the main variables influencing in anchorage strength. Connectors present high strength and stiffness and uniform rupture mode. The system performed well, were confirmed the fundamental hypothesis and the proposed calculation model.[8] researches were done with timber-concrete beams with cross section in the shape of a "deck" in order to represent a floor slab segment composed of timber parts of different heights, flattened in lower surface, side preached and interact with the concrete, be made by means of horizontal connectors. The beams were subjected to loading in the third of the span and simply supported. Deflections were measure the in the mid-span and relative deformations between the constituent layers. The results showed high strength to the analyzed beams, and indicate the feasibility of composite beams as a new application of lumber in Brazil.Considering the good performance provided by the appropriate composition of materials as well as the importance of diffusion of timber as a structural material, this study aimed to investigate the estimate of theoretical mechanical models for composite sections in the determination of internal forces (bending moment) and displacements in section beams of timber-steel jointed by screws.
2. Material and Methods
The Red Angelim wood, with an average density (obtained with the use of 10 specimens) of ρap, 12% = 1.08g/cm3 and 21.35% moisture content, obtained according to the assumptions and methods of calculation of Brazilian Standard [9], were characterized in compression parallel to the grain, tension parallel to the grains and to bending, also according to the premises of the Brazilian Standard [9].From the tensile tests parallel to grains were obtained the elasticity modulus (Et0) and the tensile strength (ft0), being tested nine specimens.From the parallel compression tests to grains were obtained the elasticity modulus (Ec0) and the compression strength (fc0), being tested ten specimens.It should be noted that the Et0 and Ec0 average elasticity modulus are used in determining the internal bending moments in the tested beams.From the bending test [Fig. (1)] were obtained the elasticity modulus (EM0) and the tensile strength (fM), being six specimens tested. The specimens for bending test presented dimensions of 40 x 5 x 5cm, adapted from the Brazilian Standard [9].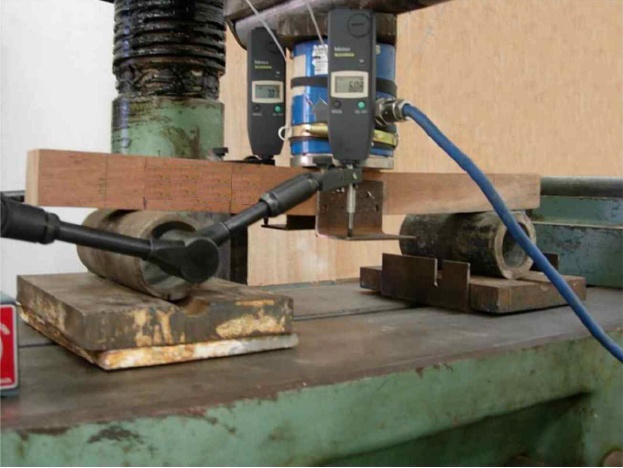 | Figure 1. Static bending test at three points for the characterization of Red Angelim wood |
The production of specimens for the steel characterization (elasticity modulus [Et,est] and resistance in tension [ft,est]) showed good surface finish without cracks or fissures. Five steel specimens were prepared in steel-plate removed from the table, flat part of the U-profile, whose format is illustrated in Fig. (2a). Known the average value of the elasticity modulus of constituent steel profile was determined, this value would be used in determining the internal bending moment (at the midpoint) of the tested beams.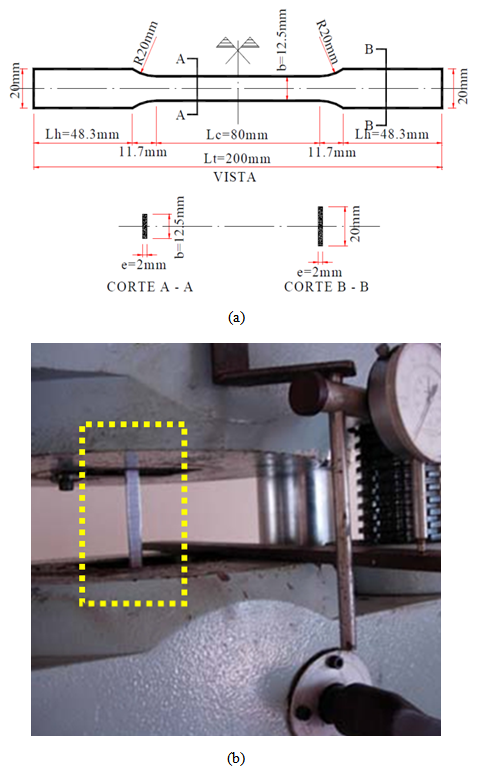 | Figure 2. Steel specimen from the "U" profile (a) and tensile test (b) |
The choice of the screw diameter (9mm diameter and 40mm in length) was made so as to satisfy two fundamental requirements: to avoid cracks in the timber part and prevent deformation by bending.As the manufacturer did not provide the mechanical characteristics of connector employed, were performed strength tests to tension. To make the tensile tests of connectors, six screws were machined in order to reduce their 9mm diameter 4mm from 10mm of head to a length of 30mm. The tip length of 10mm remained in its original form. At each screw end was welded to an AC-50 Ø = 12mm steel bar to ensure the part fixation to be tensioned into the press. Fig. (3) illustrates the tensile test performed on the screw.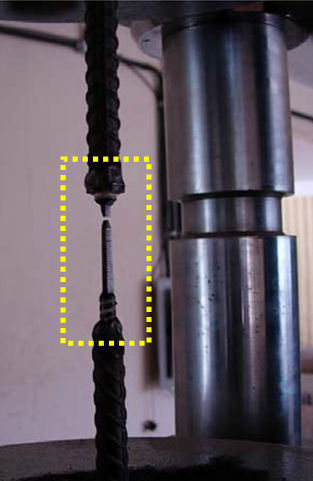 | Figure 3. Tensile test on the screw |
Testing of bending in composite steel-timber beamsHaving these results of timber characterization tests of steel and connectors were tested to bending the simple and composite beams and beams of timber composite of folded plate, to read the deformations and vertical displacements at mid-span and side at the ends. Thus, the stresses in the elements of the beams were determined, the curves force x displacement (p×δ) and the slips between steel profiles and timber.The maximum displacements were measured in the middle of span through dial indicators fixed on articulated arms and supported by brackets attached by screws, on the sides, the half-height of the beams.In the composite beams, where there was a reinforcements with metallic profile, dial indicators were fixed at the ends of the profiles, with the tips of mobile cursors supported in bases fixed on the vertical edges of the timber parts, so as to be measured slips between the profiles and timber, as illustrated in Fig. (4).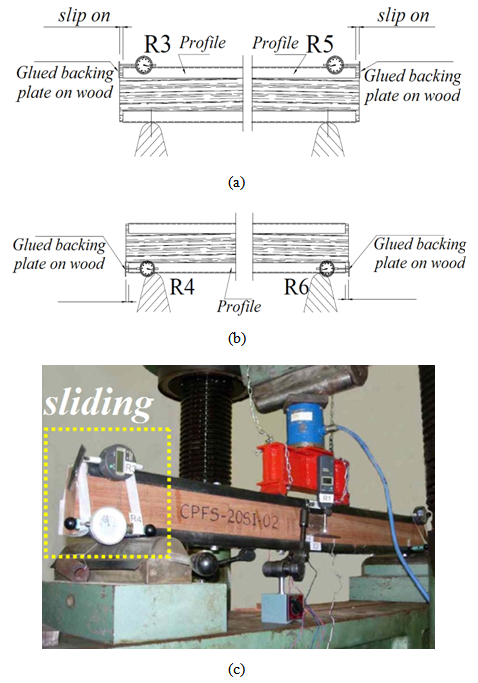 | Figure 4. Details of location details of dial indicators (a, b) to measure of slips between the materials during the realization of bending test at four points (c) |
In all the tested beams were glued strain gauges (in the middle of the span) in the top and bottom of the timber, denominated Em1 and Em2, respectively. Where there was a metallic reinforced profile were also glued strain gauges, Ea1 and Ea2 in the most external parts of the upper and lower sections, respectively, the middle of beam span (Fig. (5).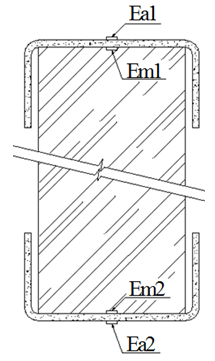 | Figure 5. Location of strain gauges at the midpoint of the beams in bending tests |
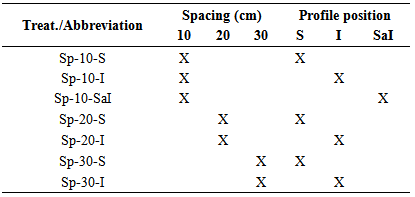
The specimens for bending tests (with and without reinforcement) were all produced with 120 cm length (cross section 5 x 12 cm) and span between supports of 105cm, unable to move laterally in supports. As composite beams were tested in bending with the variation of the spacing between the connectors (10, 20, 30cm) and the position of the metal profiles (upper [S]; lower [I], upper and lower [SaI]), and the reference condition (not reinforced beams [NR]). Table 1 shows the treatments (treat.) outlined to estimate the internal moments and displacements by analytical mathematical models.Table 1. Experimental treatments outlined
 |
| |
|
For the beams of reference condition (not reinforced; Sp-NR) were fabricated and tested three parts, one beam for the condition of double reinforcement with 10cm spacing between screws (Sp-10- SaI) and two beams for each of six other treatments, totaling 16 trials.Estimate of Resistant Moments (Mint)Two bending moments were obtained for each item and beam type tested, the external moment (Mext), calculated from the equilibrium condition with the load imposed during the trial (Equation 10) and the inner moment (Mint), obtained from mathematical models which include in their formulations perpendicular stresses (σ), which in each trial, and each material deformations are read (ε) by means of strain gauges, with the aid of Hooke's law (σ=E.ε), which requires knowledge of the elasticity modulus of materials (E), perpendicular stresses (in the upper and lower surfaces - perpendicular maximum stresses in the cross section) are then calculated. The ratio of the two moments calculated (Mext/Mint) allows evaluating the accuracy of the analytical model (balance between internal and external forces) in predicting the internal time.Timber beams without stiffenersIn a timber massive beam of length L, b x h cross section subjected to straight bending, the security is guaranteed if conditions met: | (1) |
 | (2) |
Wherein, fc0 and ft0 are the timber strengths to compression and to tension measured in the direction parallel to grains and, σwt and σwc are the perpendicular stresses acting on the edge more tensioned and longer, respectively.The part breaks when the perpendicular stresses of tension and maximum compressions exceed the respective strength values. It is assumed that the distribution t of stresses in a section has a triangular shape (linear), as shown in Fig. (6).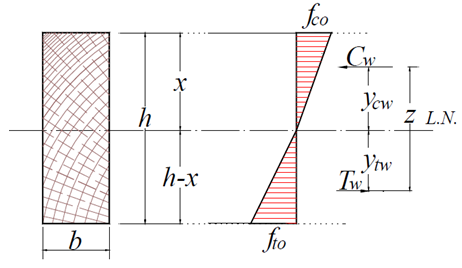 | Figure 6. Profile of stresses for beams of one only material in linear and elastic regimes |
Where in:x - distance from the neutral axis (NA) to the upper surface of the timber cross section;Cw – resulting force from compression in timber calculated from the neutral axis position;Tw - resulting force of tension in timber calculated from the neutral axis position;ycw - distance the Cw resulting to the neutral axis;ytw – distance from the Tw resulting to the neutral axis.Matching up the tensile and compressive resulting are obtained the neutral axis position, expressed by Equation 3. | (3) |
The tensile (Tw) and compression (Cw) forces calculated on the basis of the neutral axis position (x) are expressed by Equations 4 and 5, respectively. | (4) |
 | (5) |
The ytw and ycw distances in relation to the neutral axis are calculated by Equations 7 6e, respectively. | (6) |
 | (7) |
The distance (z) between the tensile and compressive resulting forces is obtained from Equation 8. | (8) |
Thus, the internal moment (Mint) is calculated by: | (9) |
So, the internal moment expressed by Equation 9 time (calculated at mid-span of the beams), for single section beams, could be compared to the external moment (Mext) (Equation 10) from the balance between the external loads of bending test in four points and their internal forces and respected internal forces (Fig. (7), idem for other cases.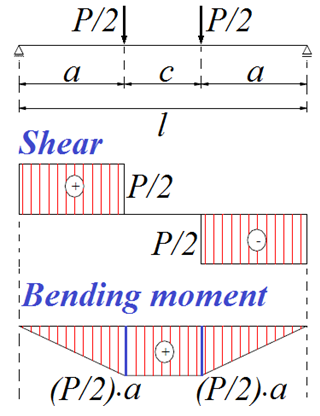 | Figure 7. Chart of internal forces for structural model of static bending at four points |
 | (10) |
Noteworthy, for notation convenience, the compressive and tensile stresses were measured experimentally for levels and force significantly lower than the values of rupture loads were maintained as ft0 and fC0.Timber beams with stiffened profile in the upper surfaceIt be considered the timber stiffened composite beam with steel profile fixed on the upper face, as illustrated in Fig. (8).Considering the triangular distribution of stresses in timber, similar to the methodology used in case of simple sections, the value of internal moment to the case of composite section is expressed by Equation 11. | (11) |
The resulting Tw and Cw are the same as Equations 4 and 5 respectively and the resulting Cpc metallic profile is obtained using Equation 12, wherein Apc is the area of the compressive profile (Fig. (8b)) and fpc is the active compressive stress profile, obtained experimentally during the bending test (σ = E.ε). | (12) |
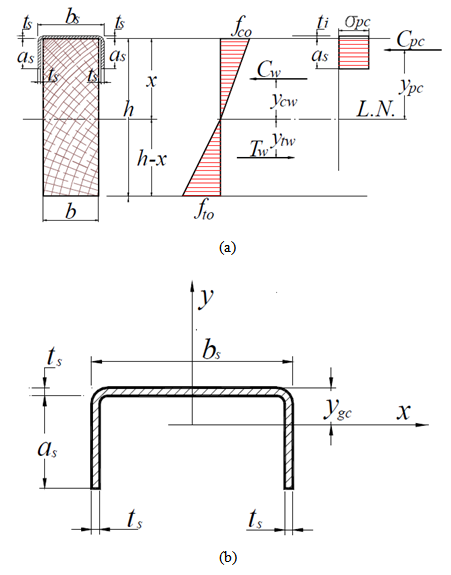 | Figure 8. Distribution of stresses for beams of the composite sections with steel profile fixed to the upper surface (a) and detail of the steel profile (b) |
The (ypc) distance of the compressive resulting force in profile, in relation to neutral axis is expressed by Equation 13, where ts is the thickness of the upper profile and ygc (Equation 14) is the distance from the gravity center to the upper end of profile. | (13) |
 | (14) |
From Equation 14, as is the height of the upper profile tab and bs is the width of the upper profile table.Equality of resulting of compressive and tensile forces, comes to the neutral axis position (x) expressed by Equation 15, which enables the calculation of the internal time for this case. | (15) |
Timber beams with stiffener profiles on the upper and lower surfacesIt should be considered the timber stiff composite beam with steel profile fixed on the upper and lower surfaces, as illustrated in Fig. (9).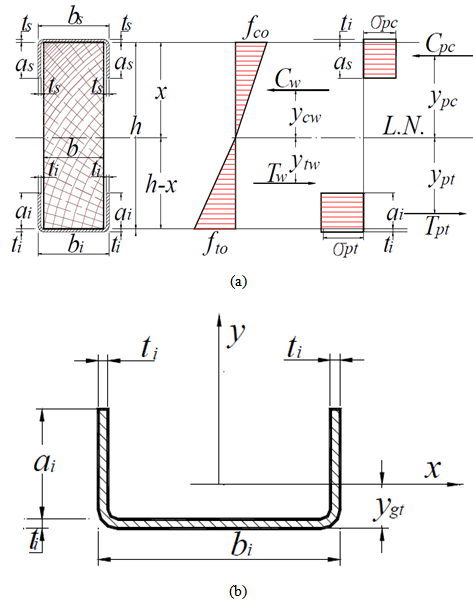 | Figure 9. Distribution of stresses for beams of composite sections with steel profile fixed on upper and lower surfaces (a) and steel profile detail fixed to the lower part (b) |
As with the methodology used in the previous cases, the value of the internal moment for the case of reinforced composite section on both sides is expressed by Equation 16. | (16) |
The resulting Tw, Cw and Cpc are the same as Equations 4, 5 and 12, respectively, and the resulting tension Tpt of the lower profile is expressed by Equation 17, wherein Apt is the area of the lower profile and the active tensile stress in profile (obtained experimentally during the bending test – (σ=E·ε). | (17) |
The (ypt) distance of resulting tensile force in lower profile relative to the neutral axis is expressed by Equation 18, where ti is the thickness of the lower profile and ygt (Equation 19) is the distance from the center of gravity to the lower profile its external face. | (18) |
 | (19) |
From Equation 18, ai is the tab height of the lower profile and bi is the width of the lower profile table.According to Equality of resulting of compressive and tensile forces arrive at the neutral axis (x) expressed by Equation 20, which allows the internal bending moments for this case. | (20) |
Estimate of Displacement (deflections) in the Mid-SpanVarious analytical models were used in accordance with the cross section of the test beam (single, composite section), in estimate of the displacements in the middle of the span. Therefore, the force values (increments) were limited to 70% of the rupture strength values. Determined the experimental displacements (δexp) and computed the displacements estimated by the analytical model (δcalc), both were related by ratio ϕc=δexp/δcalc, wherein for values of each ϕc increasingly away from 1, implies the imprecision of the estimate of the real displacements.Timber beam without stiffenersIn a timber massive rectangular beam of L length, cross section b x h cross section, subjected to simple and straight bending, the calculation of vertical mid-span displacement (δcalc), according to the Fig loading scheme. (7), is done using Equation 21, considering linear elastic behavior of the material. | (21) |
Timber beam with stiffener profile at the upper surfaceFor the calculation of the composite stiffener beam with profile in the upper surface (Fig. (10), assuming total interaction, the geometric properties of the composite section in the determination of the deformations in the elastic regime are obtained with the homogenized section, transforming the steel section in a timber section equivalent, dividing its area by the ratio: | (22) |
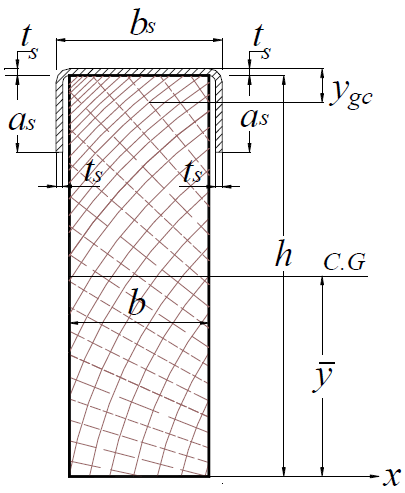 | Figure 10. Cross section of the timber beam with stiffener profile fixed in upper surface |
The inertia moment of the homogenized section (Ih) in relation to the gravity center of the part is: | (23) |
The area of the upper profile (Ash) divided by the ratio (α) between the elastic modulus is given by Equation 24, wherein Apc is the area of the upper profile. | (24) |
The static moment (Mxs) of the upper profile section is found using Equation 25, where ygc is calculated by Equation 14. | (25) |
The distance from the gravity center of the homogenized section to lower surface of composite beam is given by Equation 26: | (26) |
being: | (27) |
 | (28) |
 | (29) |
The inertia moment in relation to the lower surface of the composite beam is given by Equation 30. | (30) |
Where: | (31) |
 | (32) |
Timber beam with stiffener profile at the upper and lower surfacesIt was assumed that the composite section was represented in Fig. (11).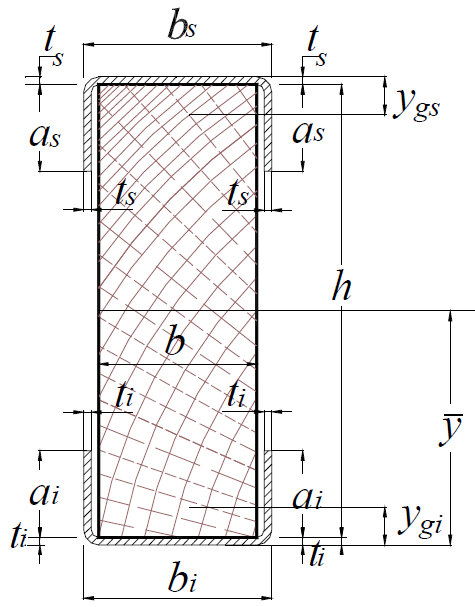 | Figure 11. Cross section of timber beam with stiffener profile fixed in the upper and lower surface |
The displacement in the mid-span is obtained using Equation 21, substituting the inertia moment (I) by the inertia moment of the homogenized section (Ih). It can be shown that the inertia moment is given by Equation 23. The area of the lower profile (Ath) divided by the ratio between the elasticity modulus is expressed by Equation 33. | (33) |
The static moment of the lower profile is found using Equation 34, being ygt given by Equation 14. | (34) |
The distance from the gravity center of the homogenized section to the lower face of the composite beam is given by Equation 35. | (35) |
The inertia moment relative to the lower surface of the composite beam is expressed by Equation 36, | (36) |
Where: | (37) |
 | (38) |
 | (39) |
Regression modelsAfter assessing the accuracy of analytical displacement (calculated - δcalc) in estimate of experimental displacements (δexp) were obtained from linear regression models comparing the values of the applied loads (in beams of static bending tests at four points) with the ratio between experimental displacements and the calculated displacements of analytical models (ϕc=δexp/δcalc), which permits, with the use of the analytical model and for various load levels, estimate the actual displacement with greater precision.
3. Results and Discussions
Compression Parallel to GrainsFig. (12) illustrates the curves stress x deformation of parallel compressive test regarding to the ten specimens of Red Angelim wood. For the construction of the curves were used values ranging between 10 and 70% of the estimated rupture strength. The strength values (fc0) and elastic modulus (Ec0) in compression parallel to the grains were equal to 64.65 MPa and 22,787 MPa respectively, these values are used to determine the internal moments from the bending tests.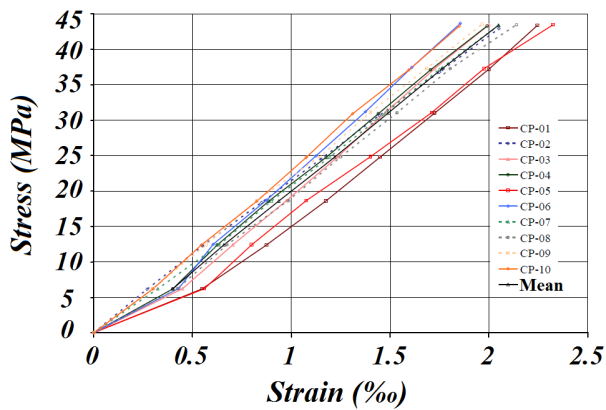 | Figure 12. Charts of tension x deformation of parallel compression tests to grains |
Tension Parallel to GrainsFig. (13) shows the curves stress and deformation of parallel tensile tests relating to nine specimens. For the construction of the curves were used values ranging between 10 and 50% of the estimated rupture strength. The strength values (ft0) and elastic modulus (Et0) in tension parallel to the grains were equal to 109.73 MPa and 23,280 MPa, respectively, these values, as well as the parallel compressive tests used in determination of the internal moments from the bending tests.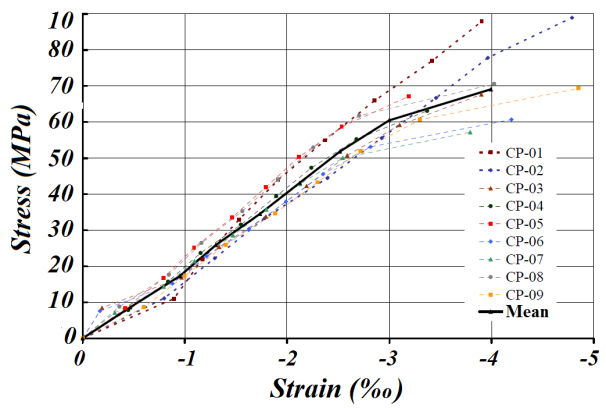 | Figure 13. Charts of tension x deformation of parallel tensile tests to grains |
BendingFig. (14) illustrates the stress x deformation curves of the bending tests relating to the six specimens. For the construction of the curves were used values ranging between 10 and 50% of the estimated rupture strength. The average value of the elastic modulus (EM) in bending was 14,716 MPa.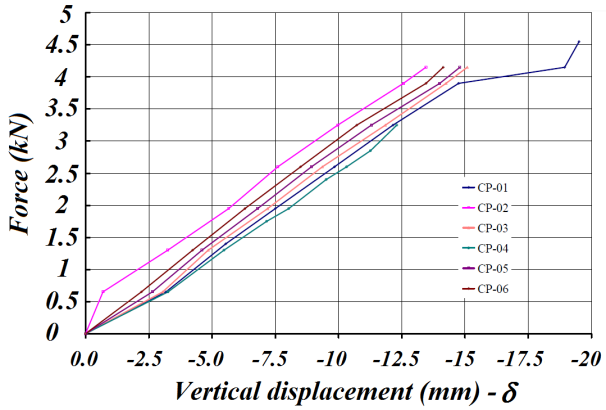 | Figure 14. Charts of force x displacement of bending tests in Red Angelim wood |
Steel component of stiffener sheetsFig. (15) illustrates the tension diagram x deformation related to the steel five specimens from the stiffeners profiles. The values of the elastic modulus, the tensile strength and yield strength of steel were equal to 141,768 MPa, 440.20 MPa and 370.94 MPa, respectively. The yield stress and the rupture strength indicate, for the classification of the Brazilian Standard [10], that the steel component of the profiles is low-alloy, high mechanical strength and resistant to atmospheric corrosion.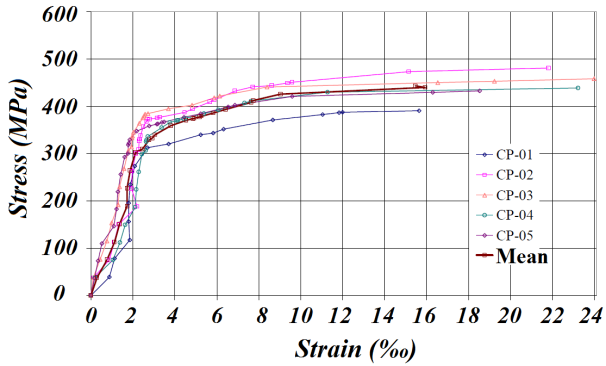 | Figure 15. Charts of tension x deformation of tensile tests on specimens taken from the stiffener profile |
ConnectorsFig. (16) presents the stress x deformation chart referent to the six connectors tested in tension. The average rupture tension was 629.5 MPa, significantly higher than the value to the steel rupture stress removed from the stiffener profiles. It is noticed in the chart that, close to 450 MPa there was steel screw stiffening. The dial indicator revealed a decrease in deformation with increased strength, indicating the part stiffening. The chart should present a flow level and then a hardening region where there were no decrease in deformation, but a decrease in deformation rate. This stiffening occurred in all specimens tested.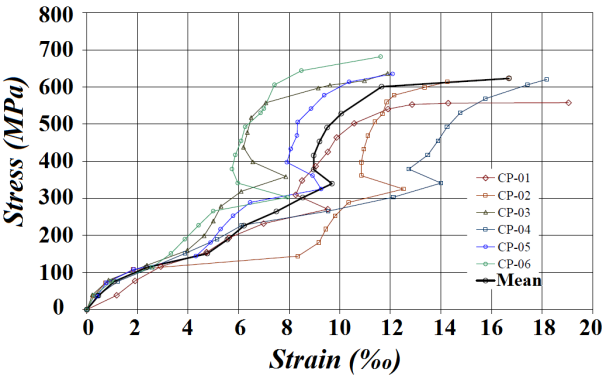 | Figure 16. Charts of tension x deformation of tensile tests on connectors |
Bending Tests of BeamsFig. (17) presents bar charts showing the mean values of rupture strength for each configuration of beam tested.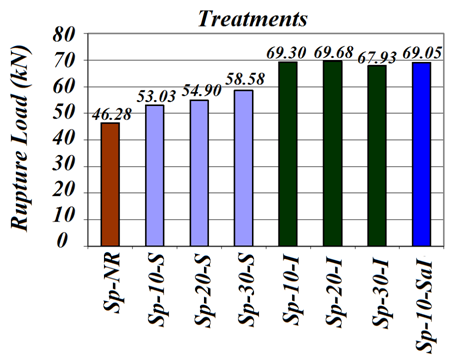 | Figure 17. Average values of rupture forces for the configurations of experienced beams |
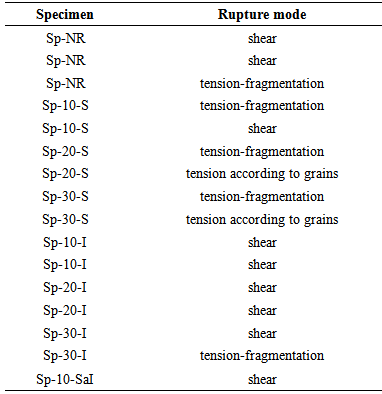
It is observed that for the Sp-10-S there was an average increase of 14.57% in rupture force compared to the beams without stiffeners (Sp-NR). For Sp-20-S this increase was of 18.62% and for the Sp-30-S was of 26.56%. It also appears that as the spacing was increased between connectors, there was an increase of rupture force. These increases were, respectively, 3.5% and 10.47% for 20cm and 30cm spacing relative to the spacing of 10cm.Considering the composite beams with upper and lower stiffening, there is an average increase of in the rupture forces of 49.73%, 50.54% and 46.76%, respectively, for spacings between the 10cm, 20cm and 30cm connectors. In these cases, was not checked the influence of spacings between connectors. For the Sp-10-SaI specimen, the increase was of 49.19% higher than the of rupture force value of beams without stiffeners.As for the failure mode, following what was observed for [11], the simple and composite beams broken by tension-fragmentation, tension second the direction of grains and by shear. Table 2 presents the form of rupture of each of the test parts.Table 2. Rupture mode of tested beams
 |
| |
|
DisplacementsFig. (18) presents charts of force x average displacements obtained for each type of beam tested.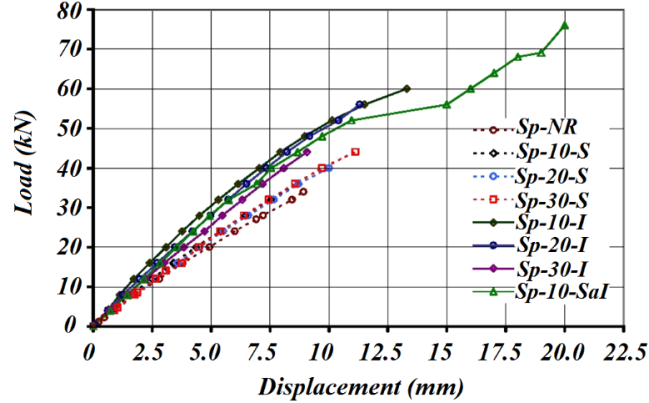 | Figure 18. Charts of force x average displacements obtained for each type of beam tested |
The following comments refer to force of 32kN, last value for which the deflections were measured in all the beams. It is noted that, for the Sp-S-10, there was an average reduction of 10.55% in the deflection value compared with the values of the displacements in the non-reinforced beam. Also it can be seen that there was no significant variation, when comparing the deflections related to Sp-10-SaI, Sp-20-S and Sp-30-S. As would be expected, the reduction considering the Sp-10-SaI was even greater. For 10cm spacing between connectors, the reduction in the deflection value was 37.12%. However, to the extent that increased spacing, there was a trend of increase in the deflection measured value. It should be noted that the deflection obtained from Sp-10-SaI condition was of the same order of magnitude of Sp-10-I.Specific deformationsThe deformations in the strain gauges were measured at each force increment, generating force x specific deformation charts. It is noteworthy that were positioned four strain gauges for measuring deformations experienced in each beam (Em1, Em2, Ea1 and Ea2), located at the midpoint of the beams and in the upper and lower faces. It will be presented and discussed only one case. Fig. (19) shows the force x specific deformation chart obtained from the readings of the Em1 gauges for the seven investigated treatments.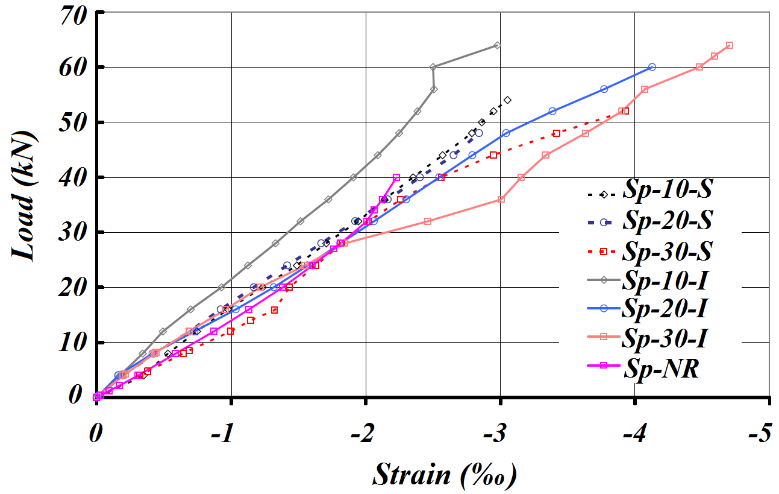 | Figure 19. Charts of force x specific deformation obtained from the readings of the Em1 strain gauges for the seven investigated treatments |
It is observed that before the 24kN loading, value near the value to service force to specimens without stiffeners, all the composite section beams presented deformations in timber, lower than those observed in non-reinforced beams, except Sp-S-30 condition. This fact was to be expected, since part of the stresses, absorbed by the timber in the Sp-NR, became absorbed by the stiffener. The discrepancies observed may be related to inaccuracy in the time of data reading, since it was not possible to keep the fixed loading value determined to carry readings. Still, it was possible to realize the reduction in the values of deformations, especially for Sp-SI-10, Sp-SI-20 and Sp-SI-30.Horizontal SlipsThe values of horizontal slips between the sheets and timber in the bending test of the composite section beams were measured with dial indicators R3 and R5 (upper surface) and R4 and R6 (lower surface). They are presented here only the results of the readings taken in R3 dial indicator. Fig. (20) illustrates the chart of force x horizontal slip obtained from reading the R3 dial indicator referring to the seven investigated treatments.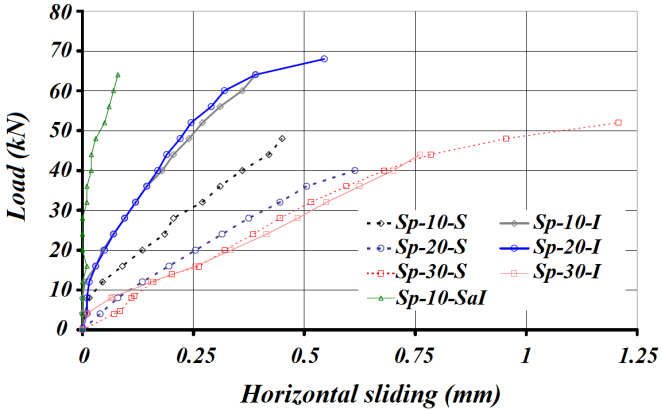 | Figure 20. Charts of force x horizontal slip obtained from reading of the R3 dial indicator of experienced beams |
Estimate of Resistant MomentsTimber beam without stiffenersTable 3 shows the results of internal and external moments for each of the timber beams Sp -NR condition.Table 3. Results of internal and external moments for the three timber beams not reinforced
 |
| |
|
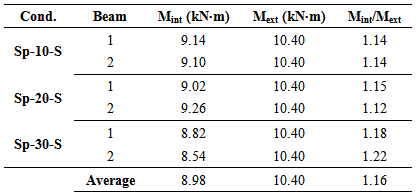
It is observed in Table 3 that the biggest difference found between the internal and external moments was 28.4% for the beam 2. On the other hand, for the beam 3 there was no difference between the inner and experimental moments. On average, the estimate of internal moments was 16.8% lower than those observed experimentally.Timber beams with stiffening profile in the upper surfaceTable 4 shows the results of internal and external moments of reinforced beams on the upper faces.Table 4. Results of internal and external moments for the beams reinforced on the upper side
 |
| |
|
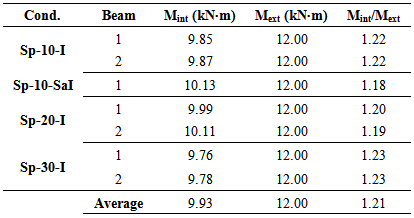
The difference between the experimental moments and the internal moments was, on average, 16%, similar to the average difference between the values obtained from the beams without stiffeners. The largest difference observed was 22%. In all cases the internal moments analyzed were lower than the experimental time.Timber beams with stiffener profile in upper and lower surfacesTable 5 shows the results of internal and external moments of the beams reinforced in the lower and upper surfaces.Table 5. Results of internal and external moments for the reinforced beams on the lower and upper surfaces
 |
| |
|
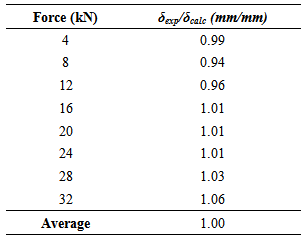
The differences between the experimental and the internal moments was, on average, similar to the average differences of the values found in the beams of reinforced and unreinforced conditions on the upper surface. The largest difference observed was 23%. In all cases the internal moments analyzed were lower than the experimental time.Estimate of DeflectionsAs shown and discussed above, the force of 32kN (in unreinforced timber beam) was the last value for which the deflections were measured in all the beams. For the determination of experimental (δexp) and calculated (δcalc) displacements, together with the ratio between them (δexp/δcalc), the intensity of 32kN load was divided into eight load increments of 4kN equal to (4; 8; 12 ; 16; 20; 24; 28; 32kN), wherein the values of forces and their respected displacements were recorded.Timber beam without stiffenersTable 6 shows the mean values of the ratio between the experimental and calculated displacements for the non-reinforced timber beams according to the eight increments of load.Table 6. Results of ratio between experimental and calculated beams to timber not reinforced beams
 |
| |
|
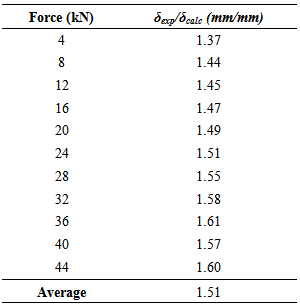
From Table 6, the average ratio between the reading and calculated displacements was 1.00 with a maximum variation of 6% for the load range used, indicating good accuracy of the analytical model for this condition.Timber beams with stiffening profile in the upper surfaceTable 7 shows the mean values of the ratio between the experimental and calculated displacements for the timber composite section beams with reinforcement the upper surface. As this is reinforced beams (upper surface), the largest amount of force obtained for the three configurations of spacing between the connectors was 44kN, and as such, eleven increments 4kN load were used.Table 7. Results of ratio between experimental and calculated displacements to the timber reinforced beams on the upper surface
 |
| |
|
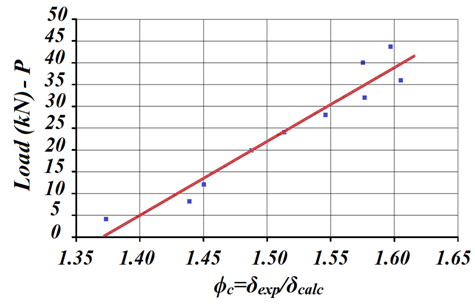
Thus, it is seen that the calculated values were significantly lower than the values read, and that the increase in the values of the applied force increases the difference between the calculated and displacements obtained from the trials. As a way of correcting (correction factor - ϕc=δexp/δcalc) the analytical expression in the estimate of experimental displacements of the beams reinforced in upper surface, as previously mentioned, it generated the linear regression model between ϕc values and their loads associated. Equation 40 expresses the regression model, in which the quality of approximation is shown in Fig. (21). | (40) |
 | Figure 21. Ratio between load and correction factor for the beams reinforced on the upper surface |
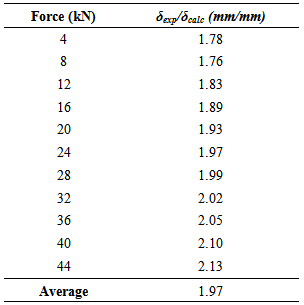
Taking as example the force P=32kN, the displacement calculated in reinforced beams superiorly was of δ=4,46mm. By applying the correction factor proposed for P=32kN (ϕc=1.562), the corrected value of this displacement was deδ=6,02mm. The average value of the displacement of reinforced beams in upper surface (considering three spacing configurations of crews) was 6.04mm. This implies that it can be used an analytical formulation proposed along with the equation for determining the correction factor.Timber beams with stiffener profile in upper and lower surfacesTable 8 presents the average ratio values between the experimental and calculated displacements for the timber reinforced section composite beams on the lower and upper surfaces. Just as, it has done in the case of reinforced beams in upper surface, were also used eleven increments of 4kN load.Table 8. Results of ratio between experimental and calculated displacements to the timber beams on the lower and upper surfaces
 |
| |
|
The linear regression model between values of ϕc and their associated force values is expressed by Equation 41, and the quality of the approximation is shown in Fig. (22). | (41) |
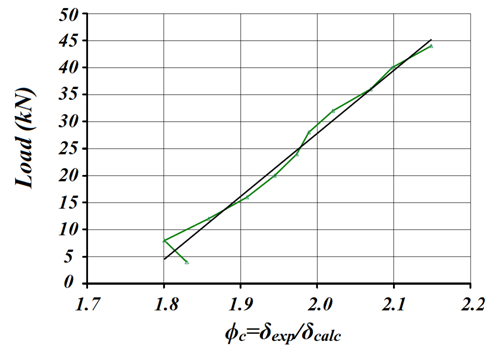 | Figure 22. Ratio between load and correction factor for the beams reinforced on the lower and upper faces |
Taking as example the force P= 40kN, the displacement calculated in reinforced beams was δ=4,46mm. With the application of correction factor of Equation 41 to P=40kN (ϕc=2.11, the corrected value of this displacement was δ=7,55mm. The average value of displacement of the reinforced beams (considering the three configurations of spacing screw) was 7,50mm. This shows it can be applied the analytical formulation proposed along with the equation for determining the correction factor.
4. Conclusions
As the curve, load x displacement, it was observed that the presence of profiles of folded sheets, it resulted a greater stiffness to system. For the reinforced beams in the upper surface there was a 20% average increase in relation to the ultimate load of the non-reinforced beam. For the beams reinforced in the lower surface there was an average increase of 49% in relation to the ultimate load of not reinforced beams. It was also found that for the reinforced beams in upper surface, there were gains of strength with the increase of spacing between connectors. The same effect was not observed in the reinforced lower surface beams.Generally, it can be seen that the timber compression deformations, for a given load level, reduced as was introduced the stiffening. The same verification was done for the timber tensile deformations.As to the compressive deformations in profile of the folded sheet, it was found that the values were influenced by the application system loads and the effect of compression. At a certain load value was decreased with increase of the deformation load. In relation to tensile deformation in profile of the folded sheet, which was not influenced by the loading system, the deformations continued to increase with the load increase.Related to slips between the folded sheet metallic profile and timber, it was observed that the values were smaller, the smaller the spacing, between the connectors, especially in the upper regions compressed. In the region tensioned this effect could not be shown.In the case of estimate of the resistant moments without stiffener was noted that the estimate of the internal time was, on average 16.8%, less than the external time (or experimental), this fact could be attributed to the adoption of the triangular chart of stress distributions. The same happened with beams with stiffeners, where the differences were on average 16% and 21% to beams reinforced in upper and lower surfaces, respectively. If it be adopted a chart of tensions with a lamination region, these differences would be lower.
References
| [1] | G. Queiróz “Elements of steel-concrete composite structures”. Belo Horizonte, The Fighter Publishing, 336 p., 2001. |
| [2] | J. Fiorelli. “Utilization of carbon and glass fibers for reinforcement of timber beams”. Dissertation of Master Thesis in Science and Engineering of Materials. São Carlos Engineering School – EESC/USP, 2002. |
| [3] | R. F. Carvalho. “Composites of sisal fibers for use in reinforcement of timber structures”. Doctorate Thesis. São Carlos Engineering School – University of São Paulo - EESC/USP., 2002. |
| [4] | J. M. Branco, Paulo. J. Cruz. "Composite slabs of timber-concrete". Magazine Civil Engineering, Department of Civil Engineering, Minho University, Portugal, n. 15, p.5- 18, 2002. |
| [5] | E. A Nicolas, N. T Mascia, J. Soriano, J.C. Pigozzo. “Determination of sliding modulus of connectors used in concrete-timber composite structures”. In: IX Brazilian Meeting on Wood and Timber Structures, Cuiabá. Annals. IX EBRAMEM. Cuiabá: Ed UFMT, p1-10. 2004. |
| [6] | J. A. Matthiesen. "Study of timber-concrete connection with commercial self-tapping screws." VII EBRAMEM - Brazilian Meeting on Wood and Timber Structures, vol. 01, 9, p. 2000. |
| [7] | J. C. Pigozzo. "Studies and steel bars glued applications such as connectors in composite slabs of timber and concrete for bridge decks". Thesis of Doctorate in Structural Engineering. São Carlos Engineering School – EESC/USP, 2004. |
| [8] | R. A Sá Ribeiro, J.S. Rock, M.G Sá Ribeiro. "Timber-concrete beams with connectors of construction waste ". In: Brazilian Conference on Non-Conventional Materials and Technologies in Green Building and Sustainable, 2006 Salvador. Annals. Salvador: BRAZIL NOCMAT, 7p, 2006. |
| [9] | Brazilian Association of Technical Standards – ABNT NBR 7190. "Design of timber structures”. Rio de Janeiro, 1997. |
| [10] | Brazilian Association of Technical Standards - ABNT NBR 8800. "Design and construction of steel structures of buildings (method of limit states)". Rio de Janeiro 2008. |
| [11] | N.T Mascia, A.M Baptist, "Study of Static Bending: Ratio between Timber Parts with Structural Reduced Dimensions ", 07/2000, VII EBRAMEM - Enc. Bras. Wood and Timber Structures, Vol. 1, p.1-6, São Carlos, SP, Brazil, 2000. |


 Abstract
 Reference
 Full-Text PDF
 Full-text HTML


