Manel Gargouri1, Chaker Chtara2, Patrick Sharrock3, Ange Nzihou4, Hafed El Feki1
1Laboratory of Materials Sciences and Environment, Science University of Sfax, University of Sfax, Sfax, Tunisia
2Chemical group of Tunisia, Gabes
3LERISM, IUT P. Sabatier, Castres, France
4RAPSODEE, Ecole des Mines d’Albi-Carmaux, campus Jarlard, Albi France
Correspondence to: Manel Gargouri, Laboratory of Materials Sciences and Environment, Science University of Sfax, University of Sfax, Sfax, Tunisia.
| Email: |  |
Copyright © 2014 Scientific & Academic Publishing. All Rights Reserved.
Abstract
A batch crystallizer in a pilot setup was utilized to produce di-amonium phosphate (DAP) crystals for purification studies by desing of experiments using a fractional experimental design 25-2. After purification, the selling price of DAP is increased five fold, which is the incentive for this optimization. Purified DAP is also used in the pharmaceutical and cosmetic industries. The physicochemical comparison of industrial DAP and recrystallized product, through spectroscopic analyses and chemical analyses, showed that purified DAP was made.
Keywords:
Diammonium phosphate, Crystallization to pilot scale, Fractional experimental design 25-2
Cite this paper: Manel Gargouri, Chaker Chtara, Patrick Sharrock, Ange Nzihou, Hafed El Feki, Purification of an Industrial Fertilizer (Diammonium Phosphate) Using Design of Experiments, International Journal of Materials Engineering , Vol. 4 No. 6, 2014, pp. 185-191. doi: 10.5923/j.ijme.20140406.01.
1. Introduction
Di-ammonium phosphate (DAP) is produced by simple reaction (neutralization) between ammonia and phosphoric acid resulting in the formation of the di-basic salt. When the mole ratio of nitrogen from ammonia and phosphorus from phosphoric acid is 2.0, di-ammonium phosphate (NH4)2HPO4) is formed. The reaction is exothermic, so the DAP is produced at an elevated and relatively constant temperature of 110℃, yielding a dry solid. The equations for the neutralization reaction between ammonia and phosphoric acid are as follows:NH3(g) + NH4H2PO4(aq) → (NH4)2HPO4(s) + H2O (g)Previous laboratory scale results on purification of industrial DAP were reported earlier [1]. The satisfactory results obtained prompted us to continue this work on a larger scale. To better understand the influence of thermodynamic parameters (temperature and time) on the purification of DAP, design of experiments (DOE) allows finding the important factors influencing recrystallization.In this work, the purification of industrial DAP to pilot scale was conducted in batch crystallization process to improve the product quality, specifically the stoichiometric purity (defined by the molar ratio MR) and the heavy metal contents. During this process the solubility of DAP was evaluated in two types of solvent (water, water-alcochol). DOE is very important in chemometrics, because chemical experiments take time to be performed to aquire knowledge to optimize a process or system. The fractional experimental design 25-2 was a comprehensive 25 design, including the five following factors: 1 - Temperature, 2 - Duration, 3 - stirring speed, 4 - type solvent and 5 - addition of charcoal. We present here the physicochemical characterization of DAP fertilizer upstream and downstream of the purification process, aiming at determining the optimum performance of recrystallization.
2. Experimental Part
2.1. Crystallization of Industrial DAP
The experimental crystallization of DAP was performed in a batch reactor (Fig.1) which was equipped with a magnetic stirrer. The suspensions were stirred by a propeller at different stirring speeds, ranging from 400 to 600 rpm. Temperature control in the crystallizer was achieved through recycling the water from a thermostated basin. The uncertainty of temperature control was 0.05 K. In a typical run, a hot and filtered saturated aqueous solution of DAP was put into the crystallizer. The crystallizer was kept 10 K higher than that of the saturated DAP solution in order to ensure that no crystals existed in the solution prior to crystallization. After 1h, the temperature of the crystallizer was reduced to the saturation temperature of DAP solution. After a while, a small amount of DAP crystal seeds was poured into the crystallizer, and the batch cooling crystallization experiment was started. The supersaturation was obtained by slowly cooling. The solid product collected was dried at 330 K under vacuum [2-4].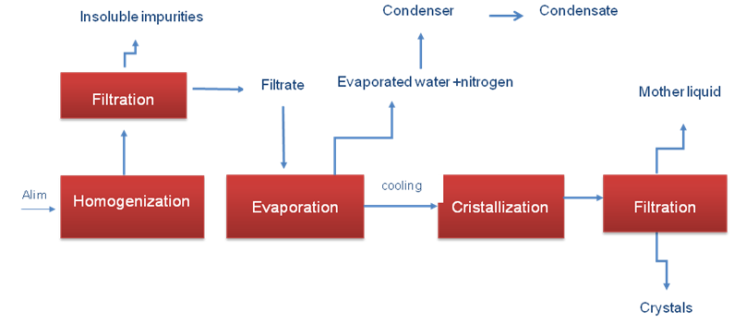 | Figure 1. Pilot plant evaporation-crystallization |
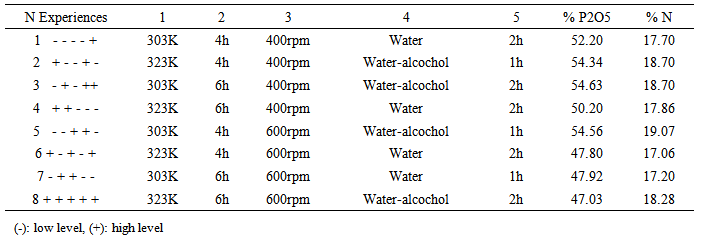
In the present work, 8 experiments were carried out according to a fractional 25-2 DOE, using the following matrix (Table 1). During this work we varied the 5 selected factors (1.temperature, 2. stirring time, 3. stirring speed, 4. type of solvent, 5. charcoal presence) into two levels coded -1 (low level) and +1 (high level). Using JMP statistical software, two responses were optimized that are the % P2O5 and % N of the DAP and the influence of each factor on these two responses.Table 1. Desing matrix and response values in the screening design (25-2)
 |
| |
|
2.2. Analytical and Testing Methods
P2O5 content in the solution was determined gravimetrically.The ammonia to phosphoric acid molar ratio (MR) was obtained by titration with standard 0.5M NaOH and 0.5 M HCl solutions. The amount of HCl and NaOH added was used to calculate the MR with MR = 2- (volume of NaOH/volume of HCl) according to the method described in Ref. [5].1st time: NH4H2PO4 + NaOH  NaNH4HPO4 + H2O
 (NH4)2HPO4+NaOH
  Na(NH4)2PO4+ H2O2nd time: NaNH4HPO4 + HCl
  NH4H2PO4 + NaCl
 (NH4)2HPO4 + HCl
  NH4H2PO4 + NH4ClA pH Meter was employed to measure the pH values of slurries.N content in the solutions was determined by the Kejdahl method. IR spectra were obtained with a Perkin Elmer BX FTIR spectrometer.Scanning electron microscopy (SEM) was with a Philips model XL 30.
2.3. DOE Methodology
DOE is used to decide which experiments are needed to get information about certain chemical process or product. It is used to decide which factors have an influence on the properties of the chemical process or desirable product. Another question is to define the number of experiments that have to be carried out to obtain more knowledge about the system. It is obvious that optimization of chemical process is essential. Main methods of DOE are factorial design including fractional factorial design. The selection of experiments has an influence on the quality of the system. It is applied to determine the conditions to obtain a product or a process with desirable characteristics. The characteristics of the product or process are optimized. The characteristics are also named responses. The factors are independent and the responses are dependent variables. So the DOE is a set of carefully planned experiments. The main steps are selection of initial factors and responses, selection of experimental domain (extreme values at which factors are studied). With DOE the response may be optimized. After a first screening the unimportant factors are discarded and the type of experimental design is chosen. Usually a two level factorial design is used for the determination of important factors (variables) and intervals. The optimal response is usually the highest or the lowest value of product or process characteristic. After determining which factors have minimal or no influence on the response (characteristics) the optimum settings of the important factor levels yielding the best characteristics of product or a process, have to be performed [6, 7].
3. Results and Discussion
In the present work, using the matrix given in Table 1 leading to 8 experiments the % N and % P2O5, were subsequently determined in order to select the best conditions to give pure DAP.These results show that after purification, the % P2O5 and % N were increased compared to that of the industrial DAP characterized by a % P2O5 equal to 46% and a % N which varies between 17 - 18% [5].According to the statistical JMP software, the results (% P2O5 and % N) were interpreted using the method of least squares [8, 9, 10].The graphical comparison between the measured responses and calculated responses is given in Fig.2.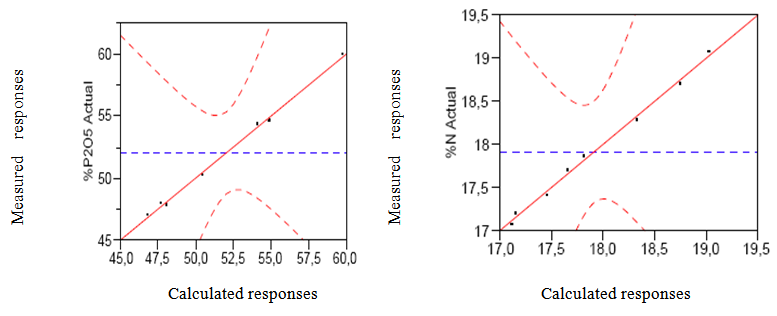 | Figure 2. Graph comparing the measured responses and calculated responses |
From these results we note that the calculated responses and measured responses are on the same bisector which shows that the model fully explains the measured responses, the numerator and denominator are equal with a correlation coefficient R2 equal to 0.98 for % P2O5 and equal 0.99 for % N [11].
3.1. Physicochemical Characterization of DAP Upstream and Downstream of the Purification
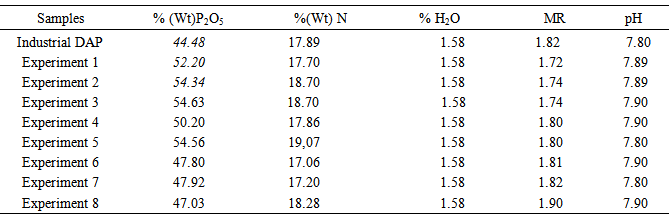
The principal chemical composition of the DAP upstream and downstream from the recrystallization is presented in Table 2. After purification, the % P2O5 and % N were increased while keeping the molar ratio (MR) between 1.7-2. Also, after purification, the percentage of H2O and value of pH are not changed. These results show that the solubility of P2O5 in water (Factor 4) is larger than in water-alcohol mixture. We note that the solubility of N and P2O5 increases when using a stirring speed level (-1) that is to say 400 rpm. The % N decreases when the stirring time increases. This shows that the increase of stirring time and stirring speed allows the evaporation of ammonia. Table 2. Chemical composition of the DAP upstream and downstream from the recrystallization
 |
| |
|
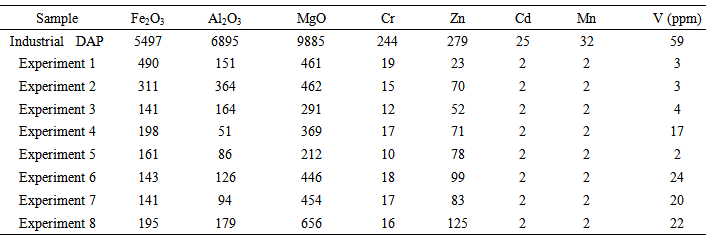
DAP is produced from industrial phosphoric acid that contain large amounts of anionic and cationic impurities (Co, Cu, Fe, Mn, Mo, Ni, Zn, F, As, Al, Hg, Pb and Cd) [12-14]. Consequently all those impurities are found in raw DAP. Still, industrial DAP can be used as fertilizers, but cannot be used for other in more stringent applications such as hydroponics, pharmaceutical and cosmetic industries. After purification, the selling price of DAP is three times higher than the same product before purification [1]. The analysis of DAP for trace elements by ICP spectroscopy after and before purification is given in Table 3, and shows that the overall quantity of impurities decreased following purification. The best result for decreasing major element impurities was experiment 1, with a 97% drop in concentrations. The results presented in fig.3 show that recrystallization is a reliable process.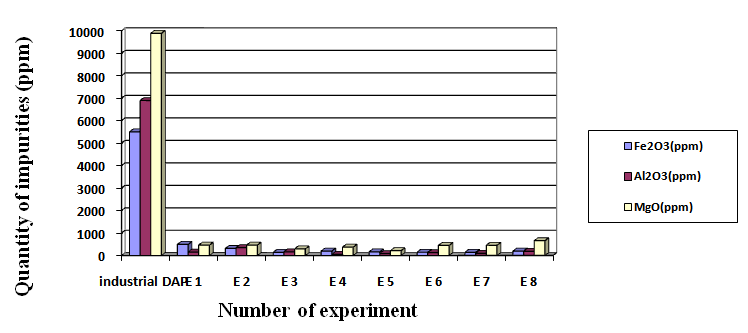 | Figure 3. Variation of impurities in the various compounds of recrystallized DAP |
Table 3. Determination of the impurities present in DAP upstream and downstream from the recrystallization
 |
| |
|
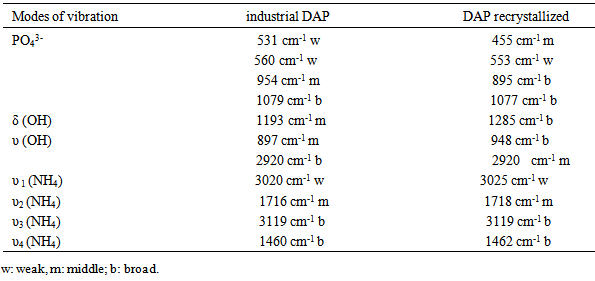
So the change of major impurities (Fig.3) shows that the major toxic impurities were eliminated especially by recrystallization.The IR analyses of industrial DAP (Fig.4a) and recrystallized DAP (Fig.4b) are illustrated in Fig.4. From these IR spectra, the presence of 4 modes of vibration due to PO43-groups are noticed, two weak bands observed at 455 cm-1 and 553 cm-1, a mid band to 895 cm-1 and a broad band at 1077 cm-1. At 1285 cm-1, a mid band corresponds to the mode δ (OH). Two middle bands observed at 948 and 2920 cm-1 are attributed to a mode υ (OH). 3 bands correspond to the mode NH4, a band at 1462 cm-1 corresponds to υ4 (NH4), a mid band to 1718 cm-1 corresponds to υ2 (NH4) and a broad band at 3099 cm-1 corresponds to υ3 (NH4) [15]. The Different modes of vibration of the industrial DAP and recrystallized DAP are grouped in table 4.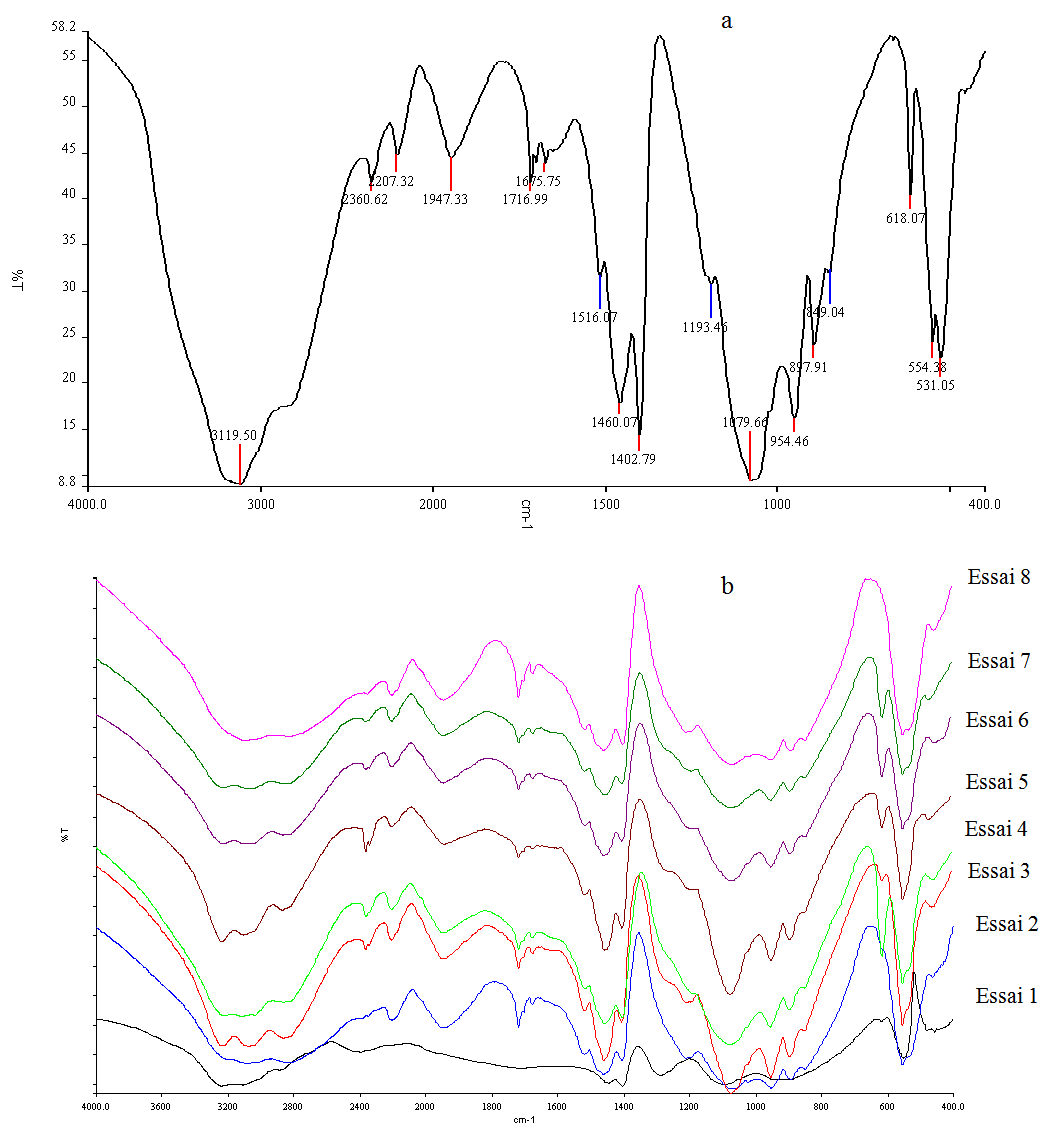 | Figure 4. Analyses by IR of industrial DAP (a) and recrystallized DAP (b) |
Table 4. The determination of different vibration of industrial DAP and recrystallized DAP
 |
| |
|
The analysis by scanning electron microscope (SEM) of the industrial DAP following recrystallization also showed that several impurities such as (Fe, Al, Mg, Cl, Si, Na, etc…) were eliminated (Fig.5).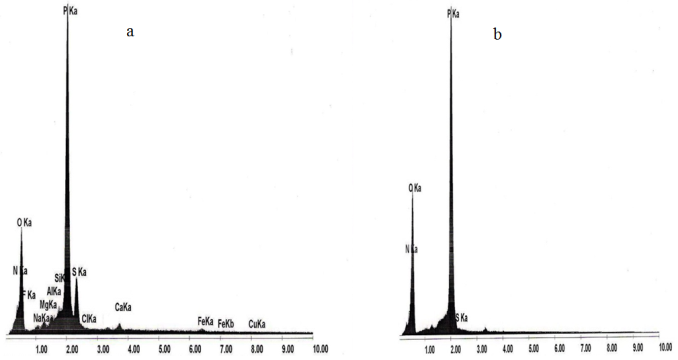 | Figure 5. Analysis by scanning electron microscope (SEM) of the industrial DAP upstream (a) and downstream (b) of recrystallization |
The morphology of crystals obtained after slow cooling was controlled by scanning electron microscope (SEM). The crystals obtained were of conical shapes (Fig.6).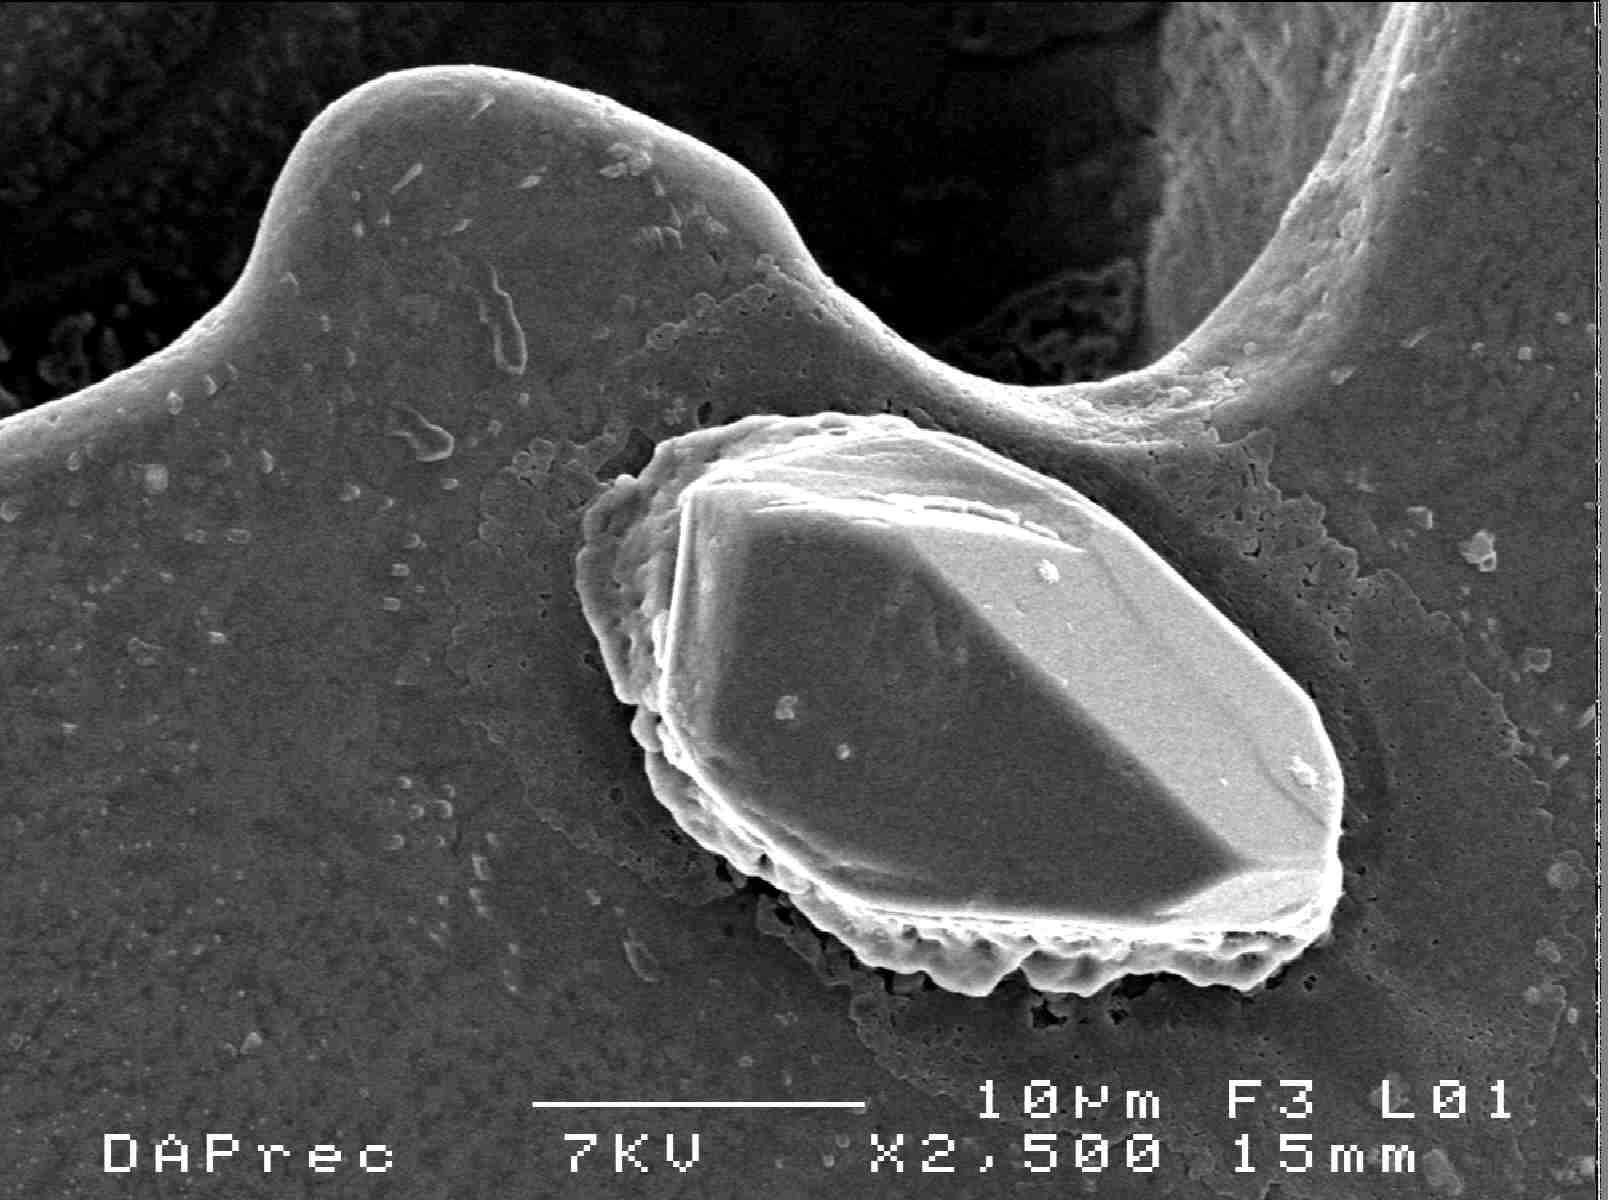 | Figure 6. Morphology structure of recrystallized DAP |
4. Conclusions
Optimization using DOE allowed determining the best settings to obtain pure DAP at pilot scale.The recrystallization effectively removes insoluble components from industrial DAP, including alumina and iron oxides. It also lowers trace heavy elements such as chromium, zinc and cadmium.The other factors such as stirring speed and time and temperature may lead to loss of ammonia, and may depend on particular reactor size and desing. Overall, recrystallization is a feasible and interesting process to improve the solubility and purity of DAP on an industrial scale.
References
| [1] | M. Gargouri, C. Chtara, P. Sharock, A. Nzihou, H. Elfeki. Synthesis and Physicochemical Characterization of Pure diammonium Phosphate (DAP) from industrial Fertilizer, Ind. Eng. Chem. Res. 2011, 50, 6580–6584. |
| [2] | A. Bernardo, M. Giulietti, Modeling of crystal growth and nucleation rates for pentaerythritol batch crystallization, chemical engineering research and design 88 (2010), 1356–1364. |
| [3] | Johan Utomo, Yusuke Asakuma, Nicoleta Maynard, Kouji Maeda, Keisuke Fukui, Moses O. Tadé, Semi-batch reactive crystallisation of mono-ammonium phosphate: An experimental study, Chemical Engineering Journal 156 (2010) 594–600. |
| [4] | C. Himawan and G. J. Witkamp, Crystallization kinetics of MgSO4-12H2O from different scales of batch cooling scraped crystallizers, Cryst. Res. Technol. 41, No. 9, 865 – 873 (2006) / DOI 10.1002/crat.200510685. |
| [5] | Benhe Zhong, Junli, Yun Xiang Zhang and BinLiang «principle and technology of ammonium phosphate production from middle –quality phosphate ore by a slurry concentration process ».Ind.Eng.Chem.Res.38, 4504 - 4506, 1999. |
| [6] | Massart DL, Vabdeginste BGM, Buydens LMC, De Jong S. Lewi JP, Smeyers-Verbeke J. Handbook of chemometrics and qualimetrics: part A. Amsterdam: Elsevier; 1997. |
| [7] | Honda Wua, Theng-Ching Feng, Tsair-Wang Chung, Studies of VOCs removed from packed-bed absorber by experimental design methodology and analysis of variance, Chemical Engineering Journal 157 (2010) 1–17. |
| [8] | GOUPY Jacques (2001), introduction aux plans d’expériences, Dunod, Paris, 2ème édition. |
| [9] | GOUPY (J.). – Plans d’expériences pour surfaces de réponse. Dunod. Paris. (1999), |
| [10] | GOUPY (J.). – Plans d’expériences. Les mélanges. Dunod Paris, (2000). |
| [11] | M Gargouri; C. Chtara; P Sharock.; A. Nzihou; H. Elfeki. Experimental study of the purification an industrial fertilizer (mono-ammonium phosphate) to larger scale using an experimental design, J.ijme, 2012, 10.5923. |
| [12] | Abollino, O., Aceto, M., Malandrino, M., Mentasti, E., Sarzanini, C. & Barbaris, R. Distribution and mobility of metals in contaminated sites. Chemometric investigation of pollutant profiles. Environ. Pollut. 2002. 119, 177-193. |
| [13] | Serena Righi, Patrizia Lucialli, Luigi Bruzzi, Health and environmental impacts of a fertilizer plant- Part I: Assessment of radioactive pollution, Journal of Environmental Radioactivity 82 (2005) 167-182. |
| [14] | Fertilizer Manual (1998). Edited by United Nations industrial development organization and international fertilizer development center: Kluwer Academic publishers, Dordrecht, the Netherlands. |
| [15] | V. Ramakrishnan and G. Aruldhas, IR and polarised Raman studies of (NH4)2 HPO4, Infraded phys. Vol. 28, N°2, PP. 77-81, 1988]. |
 Abstract
 Reference
 Full-Text PDF
 Full-text HTML