A. I. Alateyah1, 2, H. N. Dhakal2, Z. Y. Zhang2, M. A. Alhubail2
1Al Imam Mohammad Ibn Saud Islamic University (IMSIU), Riyadh, Saudi Arabia
2Advanced Polymer and Composites (APC) Research Group, School of Engineering, University of Portsmouth, PO1 3DJ, UK
Correspondence to: A. I. Alateyah, Al Imam Mohammad Ibn Saud Islamic University (IMSIU), Riyadh, Saudi Arabia.
| Email: |  |
Copyright © 2014 Scientific & Academic Publishing. All Rights Reserved.
Abstract
In this work, the nanoindentation of the neat vinyl ester and the corresponding nanocomposites is investigated. In addition, the influence of the voids content of the nanocomposites on the nanoindentation is presented. Various amounts of clay were used in this work, which include 2, 4, and 5 wt.% clay loading. To characterise interlaminar structure of the nanocomposites, XRD, SEM and TEM were performed. The hardness and reduced modulus of the neat sample was improved by the incorporation of layered silicate up to 4 wt.%. Further addition of layered silicate resulted in decreasing the hardness and reduced modulus properties. This could be due to the presence of high numbers of microvoids in the nanocomposites structure at high clay loading. The increment in microvoids content was proportional to the clay loading. At 2 wt.% clay content, the voids were about 2.45%. However, at 4 and 5 wt.%, the voids amount represented 6.40% and 9.03% respectively.
Keywords:
Nanocomposites, Vinyl ester, Layered silicate, Microvoids
Cite this paper: A. I. Alateyah, H. N. Dhakal, Z. Y. Zhang, M. A. Alhubail, Nanoindentation and Characterisations of Vinyl Ester Matrix Nanocomposites Based on Layered Silicate: Effect of Voids Content, International Journal of Materials Engineering , Vol. 4 No. 3, 2014, pp. 97-102. doi: 10.5923/j.ijme.20140403.05.
1. Introduction
Polymers are widely used materials, owing to their advantageous properties such as light weight and ease of manufacturing. However, polymers on its own, their certain properties are inadequate unless they are modified through addition of fillers and various reinforcements leading to the formation of composite or nanocomposite materials [1, 2]. For that reason and to overcome these drawbacks, suitable fillers (additives) are applied in the neat polymers in order to enhance their properties. Polymers with various particulate fillers have been successfully reinforced to improve their stiffness and toughness, as well as enhancing their resistance to fire and ignition and also their barrier properties. Addition of the particulate fillers often results in unwanted properties such as brittleness and opacity as a result of inhomogeneous dispersion on a nanometer scale between the polymer and the additives [3, 4].Composite materials have a fairly new class which are nanocomposites that are particle-filled composites in which at least one dimension of the dispersion particles is in the nanometer range.Polymer clay nanocomposites (PCN) have attracted considerable interest because of the enhancements in various properties without sacrificing the opacity and brittleness [5]. PCN often provide more attractive improvements to material properties than both micro and macro composite materials [6-10]. The improvements include mechanical, thermal, barrier, and flame retardance properties. In addition, the incorporation of layered silicate into the polymer matrix usually results in improvement of the polymer performance [11]. These improvements can be achieved by only The addition of less than 5 wt.% clay into the neat matrix [12]. The type of clay used, the kind of pre-treatment, the polymer component chosen and the way in which the nanocomposite incorporates the polymer, can have a profound influence both on the properties and the structure of the nanocomposite [3, 12, 13]. These materials are reported to be 21st century materials as their unique properties and design are not found on traditional composites [14].The reason for improvement of the material properties is the aspect ratio of the layered silicate where the interfacial interaction between the organically modified layered silicate and the matrix is higher than traditional composites. Layered silicate has a thickness of sheet in the order of 1 nm and a very high aspect ratio. A little weight percent of OMLS is dispersed throughout the matrix, thus giving a larger surface area for polymer filler interfacial interaction than in conventional composites [3, 15, 16]. In this context, the investigation of the nanoindentation, including hardness and reduced modulus, of the neat vinyl ester and corresponding nanocomposites took place. Moreover, this study aims at analysing the influences of microvoids existing in the nanocomposites structure on the nanoindentation properties.
2. Experimental
2.1. Materials
The matrix material used in this study is vinyl ester (VE) resin. “Vinyl ester resins are oligomers resulting from the reaction between bisphenol-A based epoxy oligomers and unsaturated carboxylic acids, such as acrylic or methacrylic acid, which provide unsaturated terminal sites” [17]. This material was purchased locally and commercially coded as AME 6000 T 35. The layered silicate that has been used is Cloisite® 10A which is classified as a natural montmorillonite that is modified with a quaternary ammonium salt; it was purchased from Southern Clay Ltd. This clay can be used to improve different physical properties such as barrier, flame retardance and reinforcement [18].
2.2. Sample Fabrication Process
2.2.1. Neat Vinyl Ester
In order to make neat vinyl ester panels, the vinyl ester was directly mixed with the curing agent (MEKP) (mix ratio 1.5%) and then was poured in a steel mould. The mould was closed and the composite panel was left to cure in a hydraulic press at a temperature of 55°C and at a compaction pressure of 1 MPa for 2 hours.
2.2.2. Nanocomposites
Combinations of melt intercalation method with the compression moulding method were used to fabricate nanocomposite panels. The vinyl ester resin was mixed with various concentrations of nanoclay at room temperature using a mechanical mixer in an ultrasonic bath for 2 hours. A degassing process was applied in the mixture for 3-4 hours then it was left overnight in order to get rid of the remaining air bubbles naturally. A curing agent (MEKP) was added to the mixture (1.5%) with further gentle mixing before transfer of the mixture to the steel mould. The mould was closed and the composite panel was left to cure in a hydraulic press at a temperature of 55°C and at a compaction pressure of 1 MPa for 2 hours. A post curing process of neat and nanocomposites samples were followed at 80°C for 3 hours. The clay loadings were 0, 2, 4, and 5 wt.%.
2.3. The Calculation of Nanocomposites Voids Volume
Nanocomposites voids were calculated by using the following equation;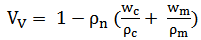 | (1) |
Where Vv is the volume fraction of voids,  the density of nanocomposites, wc the weight percent of clay (%),
 the density of clay g/cm3, wm the weight percent of matrix (%) and
  is the density of matrix g/cm3. The density of nanocomposites was calculated as following;
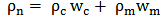 | (2) |
2.4. Characterisation
2.4.1. Wide Angle X-ray Diffraction (WAXD)
WAXD analysis on compression-moulded specimens was used to determine the clay intercalation and interlayer spacing utilising a Philips APD 1700 X-ray diffraction system with Cu Kα radiation (λ = 1.542A) generated at 40mA and 40 kV. The basal-spacings (the d-spacing, in Angstroms, between layers) were calculated using Bragg’s Law.
2.4.2. Scanning Electron Microscopy (SEM)
The morphology of vinyl ester /nanocomposite systems was investigated in a Hitachi S4500 SEM working at an operating voltage of 8 kV. Block faces were prepared from each material then ultrathin sections (63nm) were collected using a diamond knife in a Reichert Ultracut E ultramicrotome. Plasma etching was used to preferentially remove the vinyl ester matrix and leave the clay particles sitting proud of the surface. After adhering to SEM stubs, a thin layer of gold/palladium was applied to the specimens prior to examination in a Quanta 250 FEG SEM.
2.4.3. Transmission Electron Microscopy (TEM)
TEM measurements on vinyl ester / nanocomposite systems were performed using a high-resolution transmission electron microscope (Phillips CM12 with an associated Gatan digital camera system). The same block faces used to produce the sections for SEM examination were also used for TEM.
2.5. Testing
2.5.1. Nanoindentation
All the nanoindentation tests in this work were achieved by using a NanoTest apparatus (Micro Materials, UK). A Berkovich (three sided pyramidal) diamond indenter tip was utilised throughout. Twelve symmetrical indentations (in the form of a matrix, 30 μm apart) were applied on each sample. The test coupons were cut from the nanocomposites prepared by compression moulding with approximate dimensions of 20 × 20 × 3.2 mm. The specimens were then fixed onto the nano-indentation fixture using a suitable adhesive. The parameters used for all measurements were as follows:Initial load: 0.1 mN; the maximum load for all indents: 5 mN; loading and unloading rate (strain rate): 2.00 mN/S; dwell time or holding time at maximum load: 5 s.
2.5.1.1. Hardness and Elastic Modulus
The measurement of the resistance to the deformation or damage can be known as the hardness. The calculation of the hardness during the nanoindentation test can be achieved by determining the peak load and the project area of contact as seen in Equation 3. The reduced modulus can be calculated by knowing the un-loading portion of the indentation depth (Equation 4) [19]. Also, the elastic modulus can be calculated through Equation (5). | (3) |
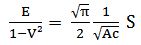 | (4) |
Where Pmax, S, Ac and V are the driving force of the indenter, material stiffness, contact area at the time that the material is in contact with the indenter with the load Pmax, and the Passion’s ratio, respectively. 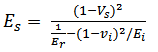 | (5) |
Where Es is the elastic modulus, Vs is the Poisson's ratio for the sample; (for polymer approximately 0.2), Er is the reduced modulus, Vi the Poisson's ratio for the indenter (for diamond 0.07), and Ei is the elastic modulus for the indenter (1141 GPa for a diamond).
3. Results and Discussion
3.1. Nanocomposites Voids Content
The voids content in nanocomposites felid is a big concern for the industrial or engineering designs. The pre-failure and the promoting of the local deformation of the applications can be obtained by the existence of high content of microvoids [20]. Thus the study of the parameters which influence the content voids as well as the percentage of these values can help to improve or maintain the quality of samples fabricated. The voids content in the nanocomposites sample were calculated using equations (1) and (2) and the results are presented in Table 1. The amount of voids was increased with the increase in clay loading.| Table 1. Voids content of different nanocomposites samples |
| | Sample | Void content (%) | Difference (%) | | Vinyl ester + 2 wt.% clay | 2.45 | 0 | | Vinyl ester + 4 wt.% clay | 6.40 | 1.61 | | Vinyl ester + 5 wt.% clay | 9.03 | 2.68 |
|
|
3.2. Characterisations of the Interlamellar Structure and Surface Morphology
3.2.1. Wide Angle X-ray Diffraction (WAXD)
Wide Angle X-ray Diffraction (WAXD) is a method broadly utilised in the study of intercalation or exfoliation which additionally characterises nanocomposites and the study of the interaction between layered silicate and the matrix. Nanocomposites show dramatic enhancement in properties when neat polymers are compared with polymers based on modified layered silicate. These improvements are attributed to the sufficient dispersal of layered silicate within a polymer matrix. A micro-composite structure is obtained when a weak interaction occurs between the clay and the matrix. X-ray diffraction is utilised to show the intercalation or exfoliation structures by calculating the intergallery spacing, in order to identify the structure of the nanocomposite [21]. In this section, the amount of d-spacing of the intergallery is presented and discussed for different clay loading nanocomposites as well as for neat polymer. Table 2 represents the change of the basal spacing (doo1 spacing) of different samples of nanocomposites that were calculated by Bragg’s Law using the values extracted from the XRD curves. From Table 2 and Figure 1, it can be seen that the nanoparticles reinforced samples show various x-ray diffraction patterns. The 2θ value for only Cloisite 10 A was 20° which represents 0.443 nm basal distance. The first peak at 2θ value of 16.86° (2% w/w clay reinforced sample) illustrates the partial intercalated d-spacing of the clay at approximately 0.525 nm with an improvement of the d-spacing about 18.51% compared to base clay. By the addition of 4 wt.% layered silicate, the 2θ exhibited less amount than the previous clay loading which was 13.84° and displayed 0.639 nm of the interlayer spacing. The peak for the 5 wt.% clay loading sample at 2θ value has shifted towards a higher angle (16.08°) which indicated lees intercalated d-spacing of 0.551 nm. | Table 2. XRD results obtained from different clay loading of nanocomposites [22] |
| | Sample No. | 2θ values at 20° | The interlayer distances (nm) | d-spacing improvement % | | Cloisite 10 A | 20.00 | 0.443 | 00.00 | | VE + 2 wt.% clay | 16.86 | 0.525 | 18.51 | | VE + 4 wt.% clay | 13.84 | 0.639 | 44.24 | | VE + 5 wt.% clay | 16.08 | 0.551 | 24.38 |
|
|
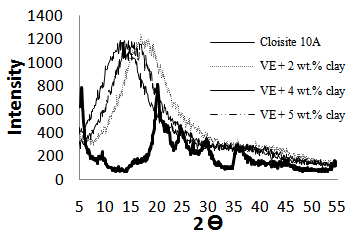 | Figure 1. XRD results of neat polymer and the corresponding nanocomposites [22] |
A clear relationship between the gallery distance and the level of dispersion of the clay in the matrix is proved by the 2θ values. In addition, the higher amount of interlayer distance, the less intercalated structure. Thus, the improvement in basal spacing led to enhancing the overall properties as will be discussed later. In this study the 4 wt.% clay loading exhibited the highest value f d001 spacing.
3.2.2. Scanning Electron Microscopy (SEM)
The SEM examination in Figure 2 shows clearly the distribution of the clay through the vinyl ester for each of the three levels of loading. As the selected images show below, the largest clay agglomerates are of a similar size for all three samples, being around 30 to 35 microns in size. However, their frequency increases with increase in loading, as does the degree of infilling between them with smaller agglomerates. Also, the voids were found to be increased with the increase in the clay content. It can be seen that the 2 wt.% clay loading shows non pronounced stacked layers and uniform distribution. The addition of further clay (i.e 4 wt.%) showed uniform ditrbution of particle with little sheets agglomeration. The SEM image of 5 wt.% clay loading exhibited a high number of stacked clay particles and voids compared to 2wt.% and 4 wt.% clay. 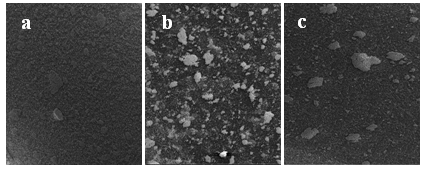 | Figure 2. SEM images at 300 µm of (a) 2 wt.%, (b) 4 wt.% and (c) 5 wt.% nanocomposites (4) |
3.2.3. Transmission Electron Microscopy (TEM)
Figure 3 shows the TEM micrographs of 2, 4 and 5 wt.% nanocomposites samples at 0.2 µm magnification, where the bright region represents the matrix sea and the dark lines correspond to the stacked or individual silicate layers. Indications are from the higher magnification images that greater levels of exfoliation of the clay particles are achieved with lower nanoclay loading. At 2 wt.% clay loading, the TEM image indicates good dispersion of layered silicate throughout the polymer matrix. 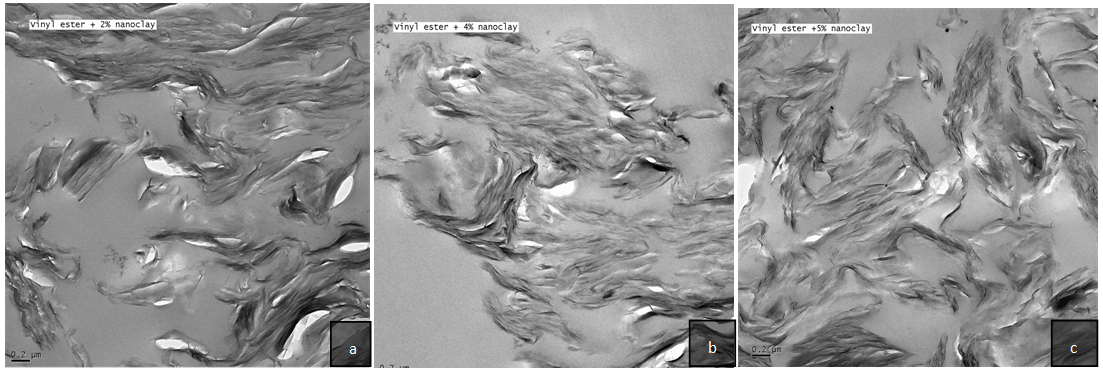 | Figure 3. TEM micrographs at 0.2µm magnification of (a) 2 wt.%, (b) 4 wt.% and (c) 5 wt.% nanocomposites (4) |
Exfoliated/ intercalated structure was obtained by the presence of 4 wt.%. At high amount of clay (i.e. 5 wt.%), additional dark areas are observed indicating the stack silicate layers and insufficient uniform dispersion. This was attributed to the high viscosity of the mixture where the ability of dispersing the layered silicate and the polymer is restricted. It is acceptable that the higher amount of clay loading mixed with the polymer, the less exfoliated and aggregated nanocomposites structure [23-25]. These findings support the results by SEM.
3.3. Nanoindentation
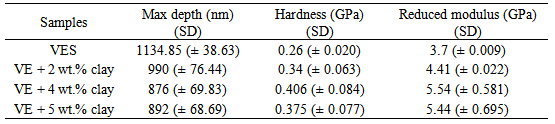
The study of the influence of different loading levels of the layered silicate reinforcement on the nanomechanical properties can be examined by the nanoindentation test. The hardness and elastic modulus can be provided by this method.Table 3 represents the average amounts of the experimental data represented from the mechanism of loading-unloading curves of the nanoindentation tests. The relationship between the load-depth curve of neat polymer and the corresponding nanocomposites with different concentrations of layered silicate is depicted in Figure 4. The addition of layered silicate led to gradual improvement of the hardness of the nanocomposites compared to the neat vinyl ester. The neatmatrix showed the lowest amount of hardness (0.26 GPa) and the highest indentation depth (1134.85 nm). By the addition of only 2% layered silicate, the hardness was increased to 0.34 GPa and the indentation depth was decreased to 980 nm. The highest improvement of hardness was observed in the polymer based on 4% layered silicate nanocomposites which represented 0.406 GPa with almost 57% improvement compared to the neat polymer. The presence of 5% layered silicate to the polymer matrix represents a reduction of hardness (0.375 GPa) compared to the reinforced polymer with 4 wt.% layered silicate. The reduction of hardness at 5 wt.% could be related to the existence to the microvoids where the interfacial interaction between the polymer matrix and layered silicate is reduced. Also, these voids can lead to easily penetration of the indenter to the sample, which impart negative effect to the overall of the material hardness. The relationship between the voids content and the hardness is presented in Figure 5.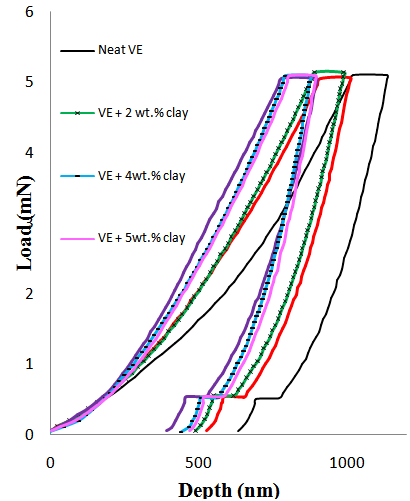 | Figure 4. The relationship between the load (mN) and the depth (nm) of the neat polymer and corresponding nanocomposites samples |
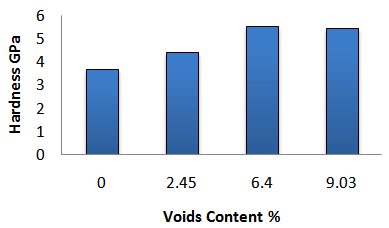 | Figure 5. The influence of the voids content on the hardness |
In addition, the reduced modulus was influence by the voids content as can be seen in Table 3 and Figure 6. The large amount of voids and agglomeration, the less interfacial interaction between the polymer and additives, in turn, the overall properties will be reduced.Table 3. The nanoindentation data extracted from the load-unload curve of the experimental nanoindentation test
 |
| |
|
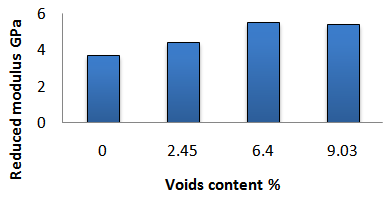 | Figure 6. The influence of the voids content on the reduced modulus |
4. Conclusions
Hardness and reduced modulus of vinyl ester matrix based on layered silicate were investigated. In addition, the effect of the percentage of microvoids in the nanocomposites structure on the nanoindentation was discussed. The layered silicate had a strong effect on the polymer properties. The higher the amount of clay loading, the better the matrix properties achieved, up to 4 wt.% clay. Further addition of clay resulted in decreasing the nanocomposites properties, which could be traced to the presence of the high amount of microvoids as calculate. In addition, at higher clay loading, the presence of agglomerated layered silicate was obtained as the findings from XRD, SEM, and TEM, which will impart negative impact on the conformational linkage between the polymer and clay.
References
| [1] | Yu T, Li Y, Ren J. Preparation and properties of short natural fiber reinforced poly(lactic acid) composites. Transactions of Nonferrous Metals Society of China. 2009;19, Supplement 3(0):s651-s5. |
| [2] | Alateyah AI, Dhakal HN, Zhang ZY. Characterisation and the influence of voids on flexural and tensile strength of layered silicate/vinyl ester nanocomposites American Journal of Polymer Science. 2014;4(1):In Press. |
| [3] | Alateyah AI, Dhakal HN, Zhang ZY. Processing, Properties, and Applications of Polymer Nanocomposites Based on Layer Silicates: A Review Advances in Polymer Technology. 2013; 32(4). |
| [4] | Alateyah AI, Dhakal HN, Zhang ZY. Characterisation and the influence of voids on flexural and tensile modulus of layered silicate/vinyl ester nanocomposites. American Journal of Materials Science. 2014;4(1):In Press. |
| [5] | Giannakas A, Giannakas A, Ladavos A. Preparation and Characterization of Polystyrene/OrganolaponiteNanocomposites. Polymer-Plastics Technology and Engineering. 2012; 51(14):1411-5. |
| [6] | Morgan AB, Gilman JW. Characterization of polymer-layered silicate (clay) nanocomposites by transmission electron microscopy and X-ray diffraction: A comparative study. Journal of Applied Polymer Science. 2003; 87(8):1329-38. |
| [7] | Samudrala SK, Bandyopadhyay S. Development of Hybrid Nanocomposites for Electronic Applications. Hybrid Nanocomposites for Nanotechnology. 2009:231-87. |
| [8] | Youssef AM. Polymer Nanocomposites as a New Trend for Packaging Applications. Polymer-Plastics Technology and Engineering. 2013(just-accepted). |
| [9] | Alateyah AI, Dhakal HN, Zhang ZY. Mechanical and thermal properties characterisation of vinyl ester matrix nanocomposites based on layered silicate. World Academy of Science, Engineering and Technology, International Science Index 81, International Journal of Mechanical Science and Engineering. 2013;7(9):6-14. |
| [10] | Alateyah AI, Dhakal HN, Zhang ZY. Mechanical and Thermal Properties Characterisation of Vinyl Ester Matrix Nanocomposites Based on Layered Silicate: Effect of Processing Parameters World Academy of Science, Engineering and Technology, International Science Index 84, International Journal of Mechanical Science and Engineering. 2013;7(12):340-52. |
| [11] | Doan T-T-L, Brodowsky H, Mäder E. Jute fibre / polypropylene composites II. Thermal, hydrothermal and dynamic mechanical behaviour. Composites Science and Technology. 2007;67(13):2707-14. |
| [12] | Alateyah AI, Dhakal HN, Zhang ZY. Contact Angle Measurement of the Vinyl Ester Matrix Nanocomposites Based on Layered Silicate World Academy of Science, Engineering and Technology, International Science Index 84, International Journal of Mechanical Science and Engineering. 2013;7(12):693-9. |
| [13] | Bellucci F, Fabiani D, Montanari GC, Testa L. The Processing of Nanocomposites. Dielectric Polymer Nanocomposites. 2010:31-64. |
| [14] | Camargo PHC, Satyanarayana KG, Wypych F. Nanocomposites: synthesis, structure, properties and new application opportunities. Materials Research. 2009;12(1): 1-39. |
| [15] | Okamoto M. Polymer/layered silicate nanocomposites. Shrewsbury: Rapra Technology Limited; 2003. 166 p. p. |
| [16] | Balakrishnan H, Hassan A, Imran M, Wahit MU. Toughening of polylactic acid nanocomposites: A short review. Polymer-Plastics Technology and Engineering. 2012; 51(2): 175-92. |
| [17] | Ittner Mazali CA, Felisberti MI. Vinyl ester resin modified with silicone-based additives: III. Curing kinetics. 2009; 45(8): 2222-33. |
| [18] | Matweb. Southern Clay Products Cloisite® 10A Nanoclay 2012 [cited 2011 12]. Available from:http://www.matweb.com/search/datasheettext.aspx?matguid=7db9da09875a4260bde97b33c2793bf8. |
| [19] | Shen L, Phang IY, Liu T, Zeng K. Nanoindentation and morphological studies on nylon 66/organoclay nanocomposites. II. Effect of strain rate. Polymer. 2004; 45(24): 8221-9. |
| [20] | Ladeveze P. A damage computational approach for composites: Basic aspects and micromechanical relations. Computational Mechanics. 1995;17(1-2):142-50. |
| [21] | Dhakal HN, Zhang ZY, Richardson MOW. Nanoindentation behaviour of layered silicate reinforced unsaturated polyester nanocomposites. Polymer Testing. 2006;25(6):846-52. |
| [22] | Alateyah AI, Dhakal HN, Zhang ZY. Water absorption behaviour, mechanical and thermal properties of vinyl ester matrix nanocomposites based on layered silicate. Polymer-Plastics Technology and Engineering. 2014; 53: 1-17. |
| [23] | Liu X, Wu Q. PP/clay nanocomposites prepared by grafting-melt intercalation. Polymer. 2001;42(25):10013-9. |
| [24] | Jordan J, Jacob KI, Tannenbaum R, Sharaf MA, Jasiuk I. Experimental trends in polymer nanocomposites—a review. Materials Science and Engineering: A. 2005;393(1):1-11. |
| [25] | Alateyah AI, Dhakal HN, Zhang ZY. The Effect of Processing Parameters of the Vinyl Ester Matrix Nanocomposites Based on Layered Silicate on the Level of Exfoliation World Academy of Science, Engineering and Technology, International Science Index 84, International Journal of Mechanical Science and Engineering. 2013; 7(12): 609-16. |
 Abstract
 Reference
 Full-Text PDF
 Full-text HTML