-
Paper Information
- Paper Submission
-
Journal Information
- About This Journal
- Editorial Board
- Current Issue
- Archive
- Author Guidelines
- Contact Us
International Journal of Materials Engineering
p-ISSN: 2166-5389 e-ISSN: 2166-5400
2014; 4(1): 5-24
doi:10.5923/j.ijme.20140401.02
Study and Improvement of Thermoelectric Properties of Ca3Co4O9/Ag Composite Ceramics
 Abstract
 Reference
 Full-Text PDF
 Full-text HTML
Jérôme Dikwa 1, 2, Jean-Marie Bienvenu Ndjaka 2, Danwe Raidandi 3, Simon Quetel-Weben 4, Pierre Owono Ateba 2
1College of Technology, The University of Ngaoundere, PO. Box 455 Ngaoundere, Cameroon
2Faculty of Science, The University of Yaounde 1, PO. Box 812 Yaounde, Cameroon
3National Advanced School of Engineering, The University of Yaounde 1, PO. Box 8390 Yaounde, Cameroon
4CRISMAT-ENSICAEN Laboratory, UMR CNRS 6508, 14050 CeanCedex, France
Correspondence to: Jérôme Dikwa , College of Technology, The University of Ngaoundere, PO. Box 455 Ngaoundere, Cameroon.
| Email: |  |
Copyright © 2014 Scientific & Academic Publishing. All Rights Reserved.
This study deals with the development and texturing of Ca3Co4O9/Ag composites, by substituting Ca2+ cations with Ag+ cations, or by adding massive silver in the Ca3Co4O9 phase in order to take advantage of the metallic nature of silver and the effect of texture to optimize the power factor (PF) and the figure of merit (ZT). The conventional method of synthesis reaction in the solid state and the innovative technique of texturing called Spark Plasma Texturing (SPT) that combines both the Spark Plasma Sintering (SPS) method and the oriented nature of Hot Pressing (HP) were used. Microstructural analysis of sintered pellets by SPT shows grains as platelets larger sizes than those of sintered pellets by SPS, and with a preferential orientation perpendicular to the pressing axis. Consequently, we obtained a maximum PF value  at 900 K, which is among the best reported about textured materials and a time saving of 98% compared to Hot Pressing (HP).
Keywords: Oxides, Spark plasma texturing, Microstructure, Anisotropy, Power factor
Cite this paper: Jérôme Dikwa , Jean-Marie Bienvenu Ndjaka , Danwe Raidandi , Simon Quetel-Weben , Pierre Owono Ateba , Study and Improvement of Thermoelectric Properties of Ca3Co4O9/Ag Composite Ceramics, International Journal of Materials Engineering , Vol. 4 No. 1, 2014, pp. 5-24. doi: 10.5923/j.ijme.20140401.02.
Article Outline
1. Introduction
- The use of materials for thermoelectric conversion typically involves choosing materials with a higher figure of merit ZT [1] or optimizing the dimensionless term (ZT). The figure of merit ZT is defined by
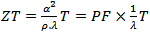 ; where
  and
and  denote respectively the thermopower, thermal conductivity, electrical resistivity, the power factor and the absolute temperature. Under high temperature applications, conventional materials based on telluride, antimony and their derivatives suffer decomposition mainly due to volatilization of certain elements. In this context, oxides, which may have interesting performance combined with chemical and physical stability at higher temperature on air, appear as candidates of great interest. The use of oxides as constituent materials of thermoelectric conversion device has been proposed recently. Indeed, their specific properties, i.e. a narrow bandwidth due to the ionic character of the bonds, and a pronounced localization of conduction electrons resulting from the strong polarization of the bonds, lead to low carrier mobility and are in complete contradiction with traditional criteria for choosing good thermoelectric material. Also, the discovery of a high figure of merit in the NaxCoO2 compound [2] was a real surprise and the trigger for many studies on the thermoelectric properties of oxides. The Cobalt oxides with a lamellar structure or misfit, such as NaxCoO2, Ca3Co4O9 and their derivatives compounds have been the subject of numerous studies, and present themselves as the best p-type oxide materials [3, 4, 5]. The work of Prevel [6], Lemonnier [7] and Kenfaui [8] have contributed to the improvement of thermoelectric properties of the bulk compound Ca3Co4O9. In addition, a number of publications recently published [9, 10], state that another way can be taken to improve the thermoelectric properties of these materials.Our study deals with elaboration and texturing of Ca3Co4O9/Ag (349/Ag) composites by replacing cations Ca2+ cations by Ag+ cations or by adding solid silver in Ca3Co4O9 phase. The purpose of this approach is to take advantage of the metallic nature of silver, to reduce the resistivity, as well as allow increased power factor (PF) and to some extent improve the thermomechanical properties. To achieve our goal, we will make a synthesis of 349/Ag composite by solid state reaction of the precursors and using conventional sintering (CS), spark plasma sintering (SPS) and a new technique combining the SPS sintering and texturing called Spark Plasma Texturing (SPT) [11], then make a comparative study of thermoelectric properties to retain the optimum sintering method and the correct orientation for cutting of thermoelements.
2. Experimental
2.1. Synthesis
- There are two methods commonly used to synthesize the powder used to develop massive ceramic Ca3Co4O9: synthesis by a liquid process [12, 13] and synthesis by solidroute [14]. The synthesis by solid state reaction is the mostly used and the easiest method to implement. Precursors, i.e. CaCO3 and Co3O4 powder form, are mixed under dry conditions, and the mixture thus obtained undergoes calcination to obtain the required Ca3Co4O9 phase. Work carried out in the CRISMAT laboratory showed that this method is more suitable for optimization of Ca3Co4O9 ceramic [6]. The choice of a mode over another is mainly influenced by the final properties desired. The control of the shape and size of the grains, through the synthesis method chosen, is one of the first steps needed to optimize solid materials Ca3Co4O9.A mass m =20 g of Ca2.7Ag0.3Co4O9 powder was synthesized by conventional solid state reaction, from a mixture prepared by stoichiometric proportions of: 12.3416 g of cobalt oxide Co3O4 [AnalorNormapur- Prolabo], 10.3878 g of calcium carbonate CaCO3 [Cerac 99.95%] and 1.2439 g of Ag [Chempur 99.9%]. These precursors were mixed and milled in dry conditions, in a machine at planetary movement containing beads and set at 400rpm for 30 min. The mixture was finely crushed in a mortar, and then calcined at 920 °C for 24 hours to promote the decomposition of carbonates; thereby obtaining the desired phase and finally, X-ray diffraction was carried out to ensure the phase. After calcination, we added solid Ag corresponding to 10 wt% of Ca2.7Ag0.3Co4O9; then the whole was ground again during 30 min in the machine.
2.2. Shaping and Sintering
- Before sintering, the crucial step is the shaping, enabling good cohesion of the grains and a better distribution of the material in order to eliminate the intergranular porosity. We use here three modes of sintering: conventional sintering (CS), Spark Plasma Sintering (SPS) and Spark Plasma Texturing (SPT).
2.2.1. Conventional Sintering (CS)
- For the preparation of the bars; 4 drops of organic binder (polyvinyl alcohol, Rhodoviol to 5 wt% in an aqueous medium marketed by Prolabo) were added into 1.2 g of powder. The mixture was then manually homogenized in the mortar, dried under epiradiator and disagglomerated before shaping. These organic binders can improve the flow ability of powders, for easy removal and offer at the preformed powder, for easy removal and offer the preformed powder, sufficient mechanical strength before consolidation step at high temperature. We subdivided the mixture in 0.3g × 4 into uniaxial press mold and the press was set at 110mV and 44.5 kN. The bars were ultimately recovered and sintered at 920 °C during 24h, with an ascending and descending speed of

2.2.2. Spark Plasma Sintering (SPS)
- We chose a graphite mold of diameter
 , a mass m =20 g of 349/Ag, a temperature cycle having a rise of 450 °C to 900 °C in 4 min 30 sec, a dwell temperature of 900 °C for 10 min and a descent of 900 °C to 450 °C in 4 min 30 sec. The pressure cycle is described as follows: a rise of 5 kN to 16 kN in 4 min 30 sec, a dwell pressure at 16 kN for 10 min, and a descent of 16 kN to 5 kN in 4 min 30 sec. In the SPS configuration, where the powder is introduced directly into the mold (Figure 1 (a)), the residual pressure applied by the wall could hinder development, growth of platelets, and therefore, their alignment along a preferred direction. The performances of materials consolidated by SPS are lower than those of the samples obtained by the hot pressing (HP) process, although the relative density of the SPS samples reaches 99% [8]. To approach the HP configuration and reduce the texturing time of our materials, we propose a new SPS configuration, allowing free deformation of the material, which could promote the development and growth of platelets and their texturing. This new configuration is called Spark Plasma Texturing (SPT) [11], and the conventional configuration is commonly called Spark Plasma Sintering (SPS).
2.2.3. Spark Plasma Texturing (SPT)
- Pre-sintered pellets are prepared using a mold of diameter
 and a mass
  of 349/Ag powder, by uniaxial pressing (set at 100mV and 40.5 kN) and a pre-sintering under air, in a furnace set at a temperature of 800 °C for 2 hours. After the phase of pre-sintering, we performed the texturing phase in the SPS device (Figure 1 (b)); the pre-sintered pellet is centered in a graphite mold, of diameter
  . The optimal diameter of graphite mold is about twice that of the pre-sintered pellet [8], in order to overcome the residual pressure applied by the wall, thus allowing free deformation of the sample and thus promoting growth and preferential orientation of platelets [11]. Temperature cycle is described as follows: an increase from 25 °C to 800 °C in 14 mim, then a dwell temperature at 900 °C for 15 min and finally a descent from 900 °C to 450 °C in 4 min 30 sec. The pressure cycle is following: a constant pressure of 5 kN in 14 mim, a rise from 5 kN to 35 kN in 5 min, then a dwell pressure at 35 kN for 10 min and finally a descent from 35 kN to 5 kN in 4 min 30 sec. It should be noted here that we first reached, the dwell temperature before a rise in pressure to allow flow and prevent cracking of the pellet.
2.2.4. Stacking of “5-Layers”
- The textured pellets have low thicknesses (about 2mm) for consider their integration into thermoelectric generators (TEG), or their characterization in the direction parallel to the pressing axis. That is why we made the welding using the SPS device by stacking 5 monolayers of SPT pellets (Figure 2) in a graphite mold, with a diameter
 . The temperature cycle is such that, it rises from 450 °C to 900 °C in 4 min 30 sec, remains 10 min at a dwell of 900 °C, then decreases from 900 °C to 450 °C in 4 min 30 sec, and finally cool back to room temperature. For pressure, it rises from 5 kN to 10 kN in 4 min 30 sec, stay 10 min at 10 kN and finally decreases from 10 kN to 5 kN in 4 min 30 sec. The final thickness of the stacking prepared was about 10 mm.
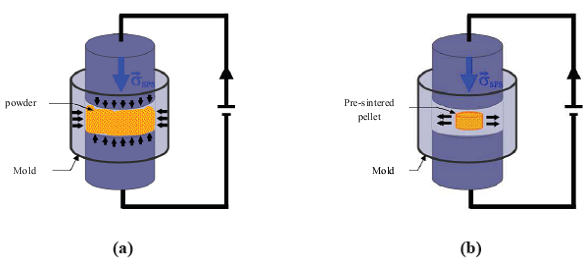 | Figure 1. Diagrams illustrating the two SPS configurations used: (a) conventional configuration SPS and (b) new configuration 'SPT' for texturing a pre-sintered pellet [8] |
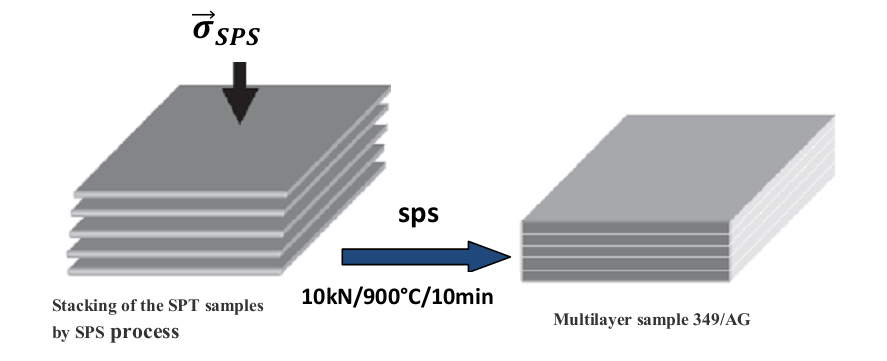 | Figure 2. Development of a 5-layers stacking by SPS pressing of monolayer samples |
2.3. Chemical and Structural Characterization
2.3.1. X-ray Diffraction
- The devices used were, Xpert Pro MPD PANalytical (bla) and D8 Advance Vario 1 Bruker that may be used at high temperature, based on a Bragg-Brentano protocol θ-2θ, whose main characteristic is the constant distance between the sample and the detector regardless of the angle θ. The interplanar distances are typical for each crystal. In addition, the relative intensity of the different peaks diffracted depends on the atoms in the lattice and their positions. One can determine precisely the different crystalline phases present in materials by comparing them with referenced phases in the XpertHighscore software. Lattice parameters can be determined accurately with software Jana 2006 [15]. This software uses Rietvield method [16] to accurately determine the lattice parameters of the crystal structure.
2.3.2. Scanning Electron Microscopy (SEM)
- Microstructural studies were performed with a SEM Carl Zeiss (Supra 55, Oberkochen, Germany) and the observed samples have undergone different pre-treatments i.e. different polishing steps with abrasive discs. An electron beam produced by a field effect filament, scans the surface of the sample and detection of secondary electrons emitted, allows for production of the image. The number of secondary electrons depending on the inclination of the initial beam, at grazing incidence it is maximal. The sensor 'SE2' located in the room can see the contrast of the topography of the surface. Within the column, the detector 'in-lens' provides better resolution of image formed at the surface with electrons (low voltage, close to 5kV is required). It is possible to mix the contributions of these detectors, in order to optimize the image quality.A third probe EDAX is added to the device; that makes it possible to capture emissions of X photons released by the sample irradiated with electrons. This method is called EDS or EDX (Energy Dispersive X-Ray Spectrometry). The energy of these photons is equal to the energy difference of two juxtaposed electron shells and is therefore characteristic of each atom. However, the photons energy dispersion is relatively large, resulting in a low resolution for low energy rays emitted by the atoms generally light. A quantitative analysis can be achieved for atoms with more than two electron shells.
2.4. Physical Characterizations
2.4.1. Measurements at High Temperature of the Resistivity and Seebeck Coefficient
- We used the ZEM-3 apparatus (ULVAC- RIKO, Inc., Japan), to simultaneously measure the electrical resistivity and Seebeck coefficient at high temperature (100-650 °C). The measurements were carried out under helium low pressure. Both ends of the sample were polished, so that they are parallel to ensure good contact with nickel electrodes of the device. The measuring chamber temperature is increased from room temperature to 650 °C, using an oven halogen controlled by temperature probes (YAMATAKE model SDC30) simultaneously measuring the sample temperature.The device is provided with a precision current source (ADVANTEST model R6144) that can deliver a maximum current of about 160mA, with a path length of 100nA, and a multimeter (Keithley model 2010) to acquire voltages.The programming of the measurement cycle at the ZEM-3 is performed by setting the different dwell temperatures desired (TD) and the number of points measurement of the temperature between the steps. Typically, the dwell temperatures are selected every 50 °C (TD then TD + 50 °C) and three points are selected (TD + 10, TD + 20, TD + 30 °C) between two levels. The resulting difference in temperature between the two thermocouples in contact with the sample is of the order of 2 to 6 °C. The Seebeck coefficient measurement is made by static, while the electrical resistivity is based on the four-probe method, with the application of direct current.The sample is placed between two nickel electrodes and then whole is inserted between two blocks of alumina thermo stated at different temperatures. Two thermocouples are placed in direct contact with the sample for measuring the temperatures TC and TH respectively of the cold and hot sides. The potential difference,
 , induced by the presence of the temperature gradient
  created through the sample, is measured between the two thermocouples. The Seebeck coefficient is then calculated by the equation:
 | (1) |
 | (2) |
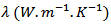
2.4.2. Measurement of the Thermal Conductivity at High Temperature
- The most widely used to determine the thermal conductivity at high temperatures is one the method by laser flash for measuring the thermal diffusivity that was developed in USA by G. L. Abbott [17]. In this technique, one side of a small sample is irradiated by a laser which heats it. The heat propagates through the material and elevating the temperature of the opposite surface is measured as a function of time by using an infrared detector (Figure 3).
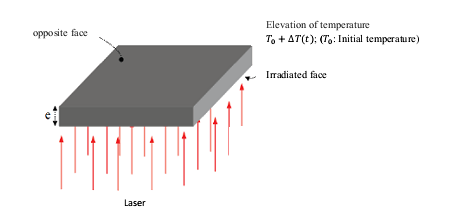 | Figure 3. The flash laser method [18] |
 required to reach half of the maximum temperature increased.Its expression is given by the equation [19]:
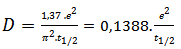 | (3) |
 | (4) |
 , is the energy required to raise 1 °C, the temperature of one gram or one mole of a material at constant pressure. It is defined by [20]:
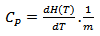 | (5) |
 was measured by differential scanning calorimetry (ATG/DSC STA 449 F3 Jupiter Netzsch, Selb, Germany) in case of this work.Finally, the Dulong and Petit law [21] states that at high temperature, specific heat
  of a solid tends to a constant value:
 | (6) |
 is the molar gas constant and
 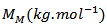 the molar mass of the material.
3. Results and Discussion
3.1. X-ray Diffraction of the Ca2.7Ag0.3Co4O9 Powder
- Figure 4 shows the X-ray diffraction patterns of the Ca2.7Ag0.3Co4O9 powder compared with reference phases of Ca3Co4O9 (349-REF), Ca9Co12O28 (9 12 28-REF) and Ag-REF. This figure reveals that the phase obtained here is closer to the Ca9Co12O28 (9 12 28) structure (with lattice parameters poorly known) and isostructural to Ca3Co4O9 [14]. This shows that substitution of Ca2+cations by heavier Ag+ cations causes distortion of lattice parameters. There is a lack of secondary phases, but rather the peaks corresponding to the phase of solid Ag indicating that the compound of formula Ca2.7Ag0.3Co4O9, is a composite compound. This hypothesis is confirmed by the SEM study coupled with EDS analysis of the Ca2.7Ag0.3Co4O9 powder.
 | Figure 4. XRD patterns (Cu  radiation) of Ca2.7Ag0.3Co4O9 powder compare with XRD patterns of Ca9Co12O28, Ca3Co4O9 and Ag reference phases radiation) of Ca2.7Ag0.3Co4O9 powder compare with XRD patterns of Ca9Co12O28, Ca3Co4O9 and Ag reference phases |
3.2. The SEM Analysis Coupled with EDS Analyser of the Ca2.7Ag0.3Co4O9 Powder
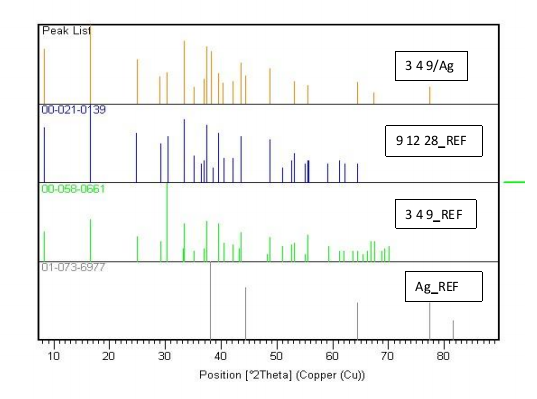
- Figure 5 shows the SEM image and the X mapping of O, Ca, Co and Ag elements in the Ca2.7Ag0.3Co4O9 powder. This figure reveals that the distributions of oxygen, calcium and cobalt are excellent, but we note the presence of precipitates (red spots) rich in solid silver; confirming that the compound is a composite.
 | Figure 5. SEM image or backscattered electrons and X mapping of O, Ca, Co and Ag elements in the Ca2.7Ag0.3Co4O9 powder |
3.2.1. Qualitative Study
- From a qualitative standpoint, X maps were made to assess the homogeneity of the distribution of elements in the matrix. In general, we found that this is the Ca3Co4O9 phase, with an extremely homogeneous distribution of O, Ca and Co elements constituent of the matrix. Regarding the Ag atoms inserted, we noticed the systematic presence of precipitates rich in Ag.
3.2.2. Quantitative Study
- From a quantitative study, the chemical compositions obtained after data processing are not satisfactory because of certain areas highly concentrated in Ag.
3.3. Microstructure and Texture
- Figure 6 shows the micrographs: (a) 349/Ag powder, (b) the sample of 349/Ag sintered conventionally, the fracture surfaces of samples prepared by the processes (c) SPS and (d) SPT. The observations were made in planes perpendicular to the pressing axis. This figure shows the evolution of the microstructure of the Ca3Co4O9/Ag composite depending on the mode of sintering.
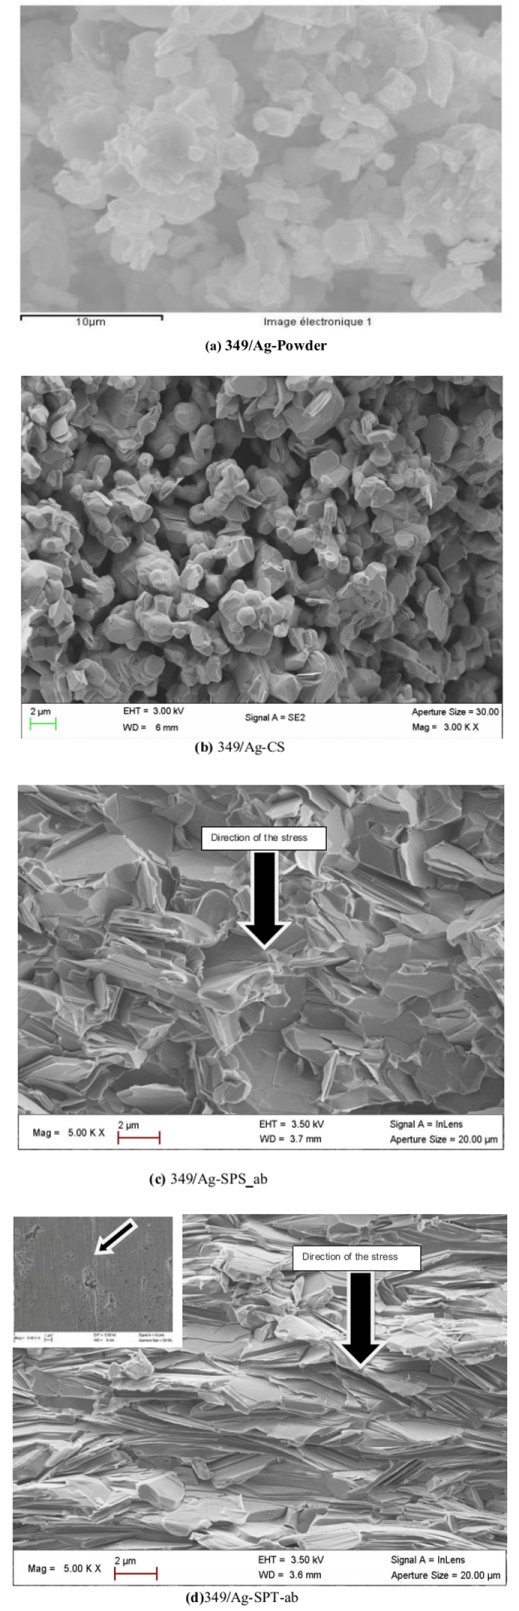 | Figure 6. SEM micrographs, of the powder (a) and cross-sections of samples sintered by CS (b), textured by SPS (c) and SPT_1-layer sample and insert the stack SPT_5-layers (d) |
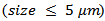 that appear randomly oriented and weakly assembled. We also note the presence of a large number of pores, which significantly reduces the density of the material and consequently, affects the various properties. The 349/Ag-CS relative density is estimated by Prevel [6], to be 60%.Figure 6 (c) shows that the porosity is more eliminated, but no significant alignment of the grains is observed. The relative density is enhanced (99.6%) for dwell temperature of 900℃; the grains are as platelets and the increase of their lateral size is not obvious
  These limitations are likely explained by the additional lateral pressure applied to the sample by the walls of the matrix, whose effect is antagonistic to that of uniaxial pressure
  during sintering [11]. For the textured SPT sample (Figure 6 (d)), platelets are larger and reached their maximum lateral size
 The thickness of these platelets was therefore greatly reduced (below
 Porosity of this sample is reduced and consequently its relative density reaches 97.9%. We also notice a greater alignment of platelets that are distributed homogeneously and compact, along the pressing axis. These results highlight the reduction effect of the residual pressure applied by the wall in the SPT configuration. The space around the pre-sintered pellet (Figure 1 b) allows the latter to deform freely under the effect of the only uniaxial pressure, which promotes a more complete development of platelets and therefore, their growth. The rotation of these platelets is also done with less stress, thus leading to their orientation in the (a, b) planes. For the SPT_5-layers sample, we could not distinguish any microcracks or separation line (interface) between monolayers at this level of magnification, which shows that the SPS treatment has permitted the shell to be welded together very well. A fine interface with an average width not exceeding
  is still observed at a much higher magnification on a polished section, as indicated by the arrow on the micrograph inset in figure 6 (d). The relative density (~ 96.5%) is slightly affected in comparison with that of the original monolayer.
3.4. Thermoelectric Characterization
3.4.1. Comparative Study of the Thermoelectric Properties of 349 and 349/Ag
- Figure 7 shows the temperature dependence of the resistivity of different samples. We clearly observe that the addition of silver helps to reduce the resistivity of one hand and on the other hand the new SPT configuration reduces the resistivity
 in the plane perpendicular to the pressing axis. This results in a significant decrease for the resistivity
  of the 349-Ag_SPT_1-layer sample. The value of
  is estimated to
 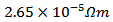 at 630℃ for the composite Ca2.7Ag0.3Co4O9 +
  Ag (349/Ag); against a value of
 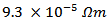 for Ca3Co4O9 ceramic sintered by SPS [8], this value corresponding to 71% decrease. We note: (i) a correlation between the reduction of the resistivity and the microstructural observations, and (ii) the decrease of
  when platelets are better aligned because of the availability of a space larger creep (larger diameter mold).
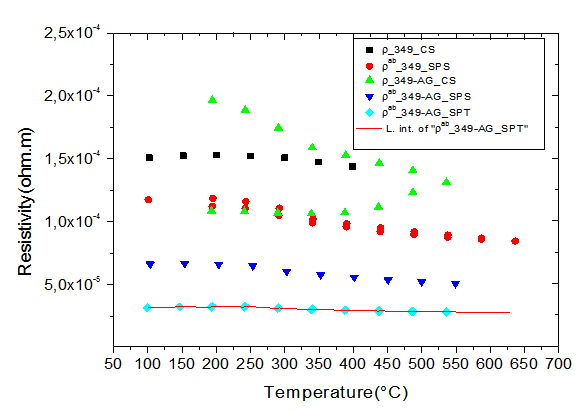 | Figure 7. Evolution of the resistivity as a function of temperature for samples: 349_CS, 349_SPS, 349-Ag_CS, 349-Ag_SPS and 349-Ag_SPT_1-layer |
 has values
  lower than the 349-Ag_SPS sample which also presents low values compared to the other samples. This can be explained by a higher lateral size of platelets and their better alignment; therefore, the effects offset the density difference observed between the two materials. The smaller values
  of the 349-Ag_SPT_1-layer sample resulting from its larger platelets which reduce the density of grain boundaries and in particular the higher texture to improve current flow in the (a, b) planes.Figure 8 shows the temperature dependence of the Seebeck coefficient for the different samples. The Seebeck coefficient slowly increases with temperature. However, the addition of silver combined with texturing SPT seems unfavorable to the Seebeck coefficient due to the low thermopower of metallic silver. There is a decrease on the value of
 , from
  for Ca3Co4O9 textured by HP [8] to
  for the 349-Ag_SPT_1 layer sample.
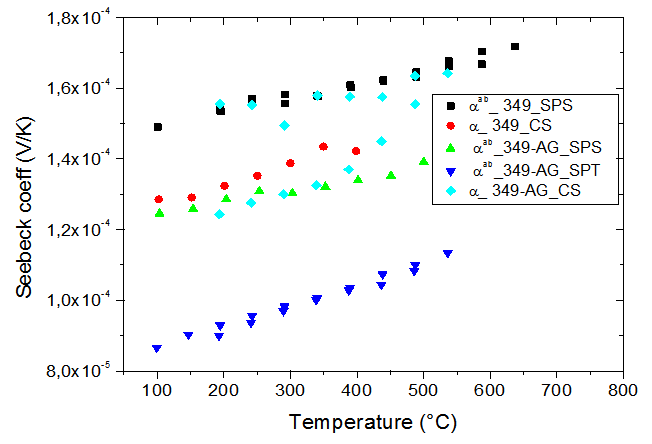 | Figure 8. Temperature dependence of the Seebeck coefficient for the samples: 349_CS, 349_SPS, 349-Ag_CS, 349-Ag_SPS and 349-Ag_SPT_1-layer |
 it is more important than the degradation of
 , which significantly improves the power factor
  (Figure 9).Figure 9 shows that the power factor of the 349/Ag composite is improved, compared to the 349. Combined with the SPT texturing, adding silver helps to significantly improve the power factor
  . For 349-Ag_SPT_1-layer sample, it reaches
  at 630℃
  against
  at
at  for 349 _SPT_1-layer obtained by Kenfaui [8]; which correspond to an increase of about 37%. By extrapolation, the expected value is about
  at 730℃
 This value is also higher than the value of
  obtained recently by Madre et al [22], using the Electrically Assisted Laser Floating Zone (EALFZ) technique. This result shows the possibility of a much faster texturing with interesting values of
  comparable to those obtained by HP [8]. The texturing time of sample sintered by the SPT process (~ 1 hour) is a major advantage, compared to 36 hours required by the HP process [8] or 72 hours needed for the EALFZ [22].
 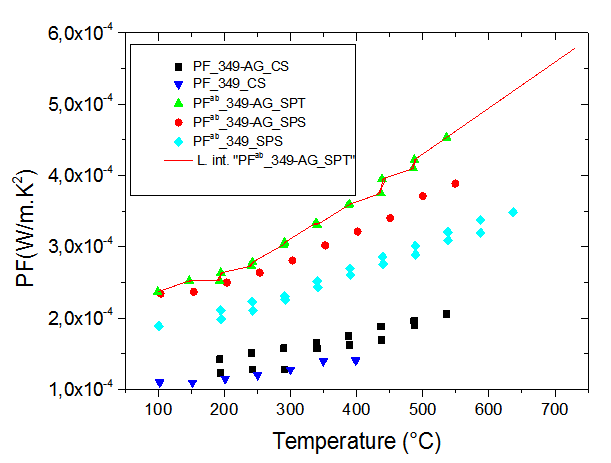 | Figure 9. Temperature dependence of the power factor () for the samples: 349_CS, 349_SPS, 349-Ag_CS, 349-Ag_SPS and 349-Ag_SPT_ 1-layer |
3.4.2. Study of the Anisotropy of the Thermoelectric Properties of 349/Ag Composites
3.4.2.1. Samples Preparation for Thermoelectric Measurements
- To measure the resistivities
 and the Seebeck coefficients
  a series of bars was cut from the heart of the 5-layers sample following the directions parallel and perpendicular to the pressing axis of dimensions
  Parallelepipeds of dimensions
  or
or  were also cut following these directions for measuring thermal conductivity
  The measurements were carried out in high temperature ranges. The samples cut in parallel and perpendicular to the pressing axis with sufficient lengths were used to perform a detailed study of the anisotropy of thermoelectric properties. Measurements of resistivity
 , Seebeck coefficient
  and thermal conductivity
 are a very interesting challenge, because there are only very few results of similar measurements in the literature.
3.4.2.2. Electrical Resistivities (ρab and ρc) and the Anisotropy Ratio of the Resistivity (ρc/ρab)
- Figure 10 (a) represents the resistivity
 following the pressing axis
  and the resistivity
  in the plane perpendicular to the pressing axis. The
 values of monolayer sample are also reported. The
  values of 5-layers sample are almost identical to those measured for a monolayer (
 is
is  and
and  at 900K respectively for 5-layers sample and 1-layer sample). These curves show that the temperature dependence of
  is similar to
 , but the
  values remain much higher. This is likely due partly to the increase in the density of the grain boundaries in the planes containing the
  axis, that is the increase number of barriers to the electric current passage due to the remarkable reduction of the thickness of the grains under the effect of the
  pressure, and secondly, the texture rather favoring the current flow along the (a, b) planes. Another explanation may be suggested by considering the increasing number of interfaces in the 5-layers stack. At 900 K, the resistivity
  is about
 value below those reported in the literature by Tani et al. [23] and Kenfaui [8] in the range
  for 349. The
  curves have an inconspicuous transition around 450 K (see figure 10 (b)), which can be attributed to the spin transition [24] and the very low value
  of
of  at 900 K for 349/Ag composite textured, is among the best reported in the literature.
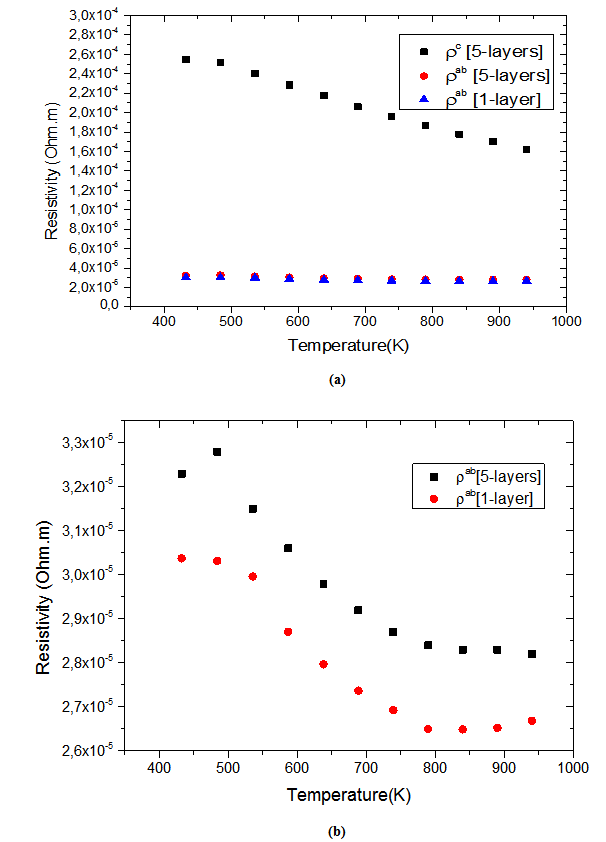 | Figure 10. (a) Electrical resistivity as a function of temperature for thermoelements taken from the 5-layers sample along the parallel directions ( ) and perpendicular ( ) and perpendicular (  ) to the pressing axis and the ) to the pressing axis and the  values of monolayer sample are also reported. (b) Electrical resistivity values of monolayer sample are also reported. (b) Electrical resistivity  of 5-layers sample and 1-layer sample in large scale of 5-layers sample and 1-layer sample in large scale |
 of the 5-layers sample. The gap between
  and
and  values means that there is anisotropy of the electrical resistivity. This anisotropy is expressed here by the ratio
 Similar results were reported by Tani et al. [23], Zhang et al. [25] and Kenfaui [8] for the Ca3Co4O9 ceramics textured by RTGG (Reactive Templated Grain Growth), SPS and SPT respectively. The anisotropy
  decreases with increasing temperature, as shown in figure 11. For the series of measurements, the average value of the ratio
  is about 6.4 at 900 K, lower than that reported by Tani et al. (7.25) [23] and Kenfaui (8.8) [8], but higher than that obtained by Zhang et al.(2.7) [25].
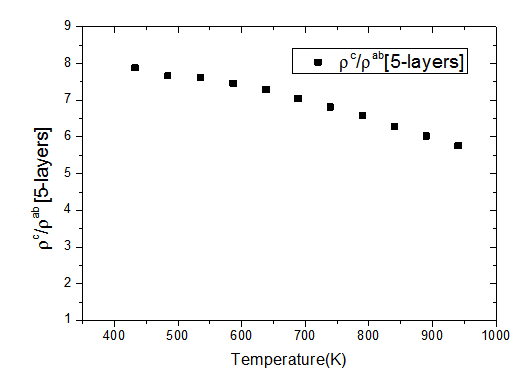 | Figure 11. Temperature dependence of the anisotropy ratio of the resistivity (  ) of the 5-layers sample ) of the 5-layers sample |
3.4.2.3. Seebeck Coefficients (αab and αc) and the Anisotropy Ratio of the Seebeck Coefficients (αc / αab )
- Like the resistivity, the thermopower in the (a, b) planes and along the
 axis was measured to verify the isotropic nature of this property. Figure 12 (a) shows the evolution of the Seebeck coefficient as a function of temperature, measurements being made along these two directions on the bars cut from the 5-layers stack. The
  values obtained for a monolayer are also reported. The
  curves have also a transition (hardly visible) around 450 K, which can be related to the spin transition [24]. The positive values of the Seebeck coefficient indicates that the majority charge carriers are positive (holes).Figure 12 shows that the 5-layers stack has almost the same
  values as those of the monolayer. However, this stack has
  values slightly different and above those of
 The difference
  is about
 indicating an anisotropic character of the Seebeck coefficient. This result seems to disagree with the literature where the thermopower depends only on the chemical (concentration of charge carriers) of the material andwould bean isotropic property intrinsic to the crystals. Tani et al. [23] and Kenfaui [8] have reported a difference between
  and
and , but they neglected the difference obtained and thus concluded that the Seebeck coefficient of their textured ceramics Ca3Co4O9 are insensitive to the crystallites alignment and the microstructure.
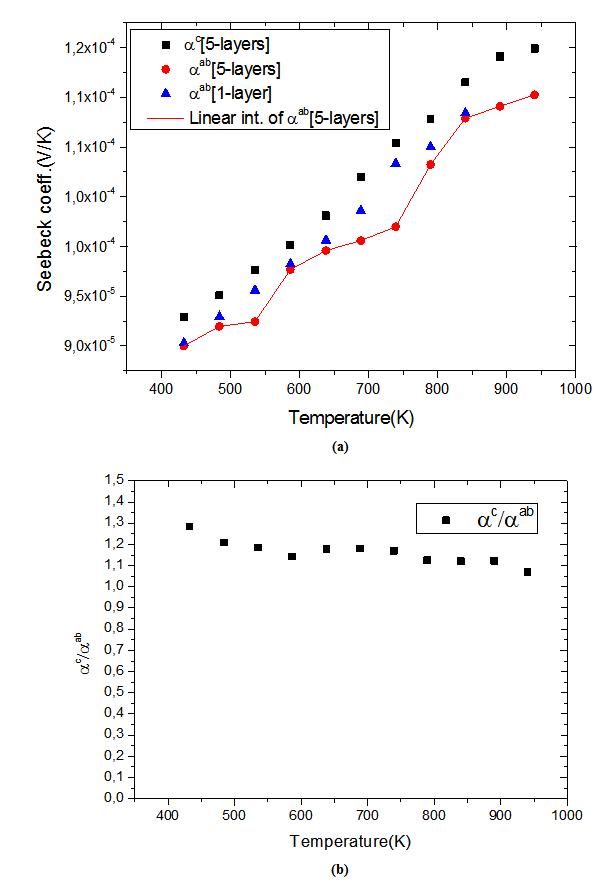 | Figure 12. Seebeck coefficient as a function of temperature for bars taken from the 5-layers sample along the direction parallel ( ) and direction perpendicular ( ) and direction perpendicular ( ) to the pressing axis. The values of ) to the pressing axis. The values of  1-layer sample are also reported. (b) Illustration of the anisotropy ratio 1-layer sample are also reported. (b) Illustration of the anisotropy ratio  of Seebeck coefficient depending on the temperature of Seebeck coefficient depending on the temperature |
 show here that the addition of Ag and the effect of SPT favour entropy of charge carriers in the plane parallel to the
  axis. Anyway, the difference is negligible and the Seebeck coefficient of the 349/Ag composite textured remains insensitive to the crystallites alignment and the microstructure.
3.4.2.4. Power Factor (PF)
- Figure 13 (a) presents changes of the resultant power factors as a function of temperature according to the directions parallel
 and perpendicular
  to the pressing axis
  for the 5-layers sample. To facilitate comparison with the monolayer sample, the
  values of monolayer sample are also reported. These
  values are similar to those of the monolayer, but are much higher than those of
  As values of the resistivity
  are high relative to
  and those of the Seebeck coefficient
  slightly lower than
 the resultant power factor
  is much lower than that of
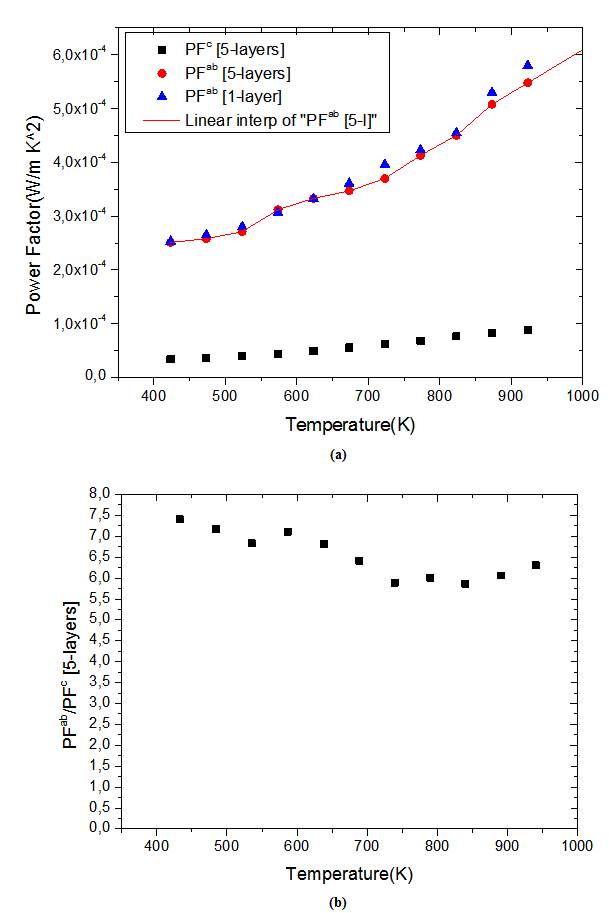 | Figure 13. (a) Power factor as a function of temperature for bars taken from the 5-layers sample following the directions parallel  and perpendicular and perpendicular  to the pressing axis. to the pressing axis.  values of the monolayer sample are also reported. (b) Changes of the anisotropy ratio values of the monolayer sample are also reported. (b) Changes of the anisotropy ratio  of the power factor as a function of temperature of the power factor as a function of temperature |
 The mean ratio
  obtained has decreased compared to that reported by Kenfaui on 349 textured by HP [8].The values of
  are higher than those of
  and are clearly improved for the 349/Ag_SPT sample. The
  value reaches
  at 900K for the 349/Ag_SPT_5-layers sample. This value of
  at 900K is among the best in the literature [8, 22, 26, 27] for massive polycrystalline materials Ca3Co4O9.
3.4.2.5. Thermal Conductivities (λab and λc)
- Figure 14 (a) shows the temperature dependence of the thermal conductivity for 349/Ag_5-layers sample, following the directions parallel
 and perpendicular
  to the
  axis. The thermal conductivity
  can be expressed as the sum of electronic
  and lattice
  contributions, that is;
 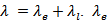 can be estimated from the Wiedemann-Franz law:
 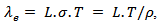 where
where  is the Lorentz number
  for free electrons).
  is therefore obtained by subtracting
  Experimentally, y,
 and
and  decrease with increasing temperature (Figure 10 (a)); therefore it comes from the Wiedemann-Franz formula, that
  increases with temperature. This shows that
  is the predominant component of the thermal conductivity in the Ca3Co4O9/Ag system. These results are clearly verified for the thermal conductivities
  and
and  in figure 14 (b).
 | Figure 14. (a) Temperature dependence of thermal conductivities of 5-layers sample following the directions parallel  and perpendicular and perpendicular  to the pressing axis. (b) Evolution according to the temperature of the electronic to the pressing axis. (b) Evolution according to the temperature of the electronic  and lattice and lattice  contributions to these thermal conductivities contributions to these thermal conductivities |
 is proportional to the mean free path of the phonons,
  as stated in the following equation:
  where
where  is the lattice specific heat and group velocity
  (equivalent to that of sound in the solid). Thus, reducing
  implies that of
 This, for example, is strongly present in nanocrystalline materials [28] due to phonon scattering by grain boundaries which density is very high.In the case of conventional sintered sample for which the porosity is high (relative density is 60%) and grains are small
  the density of barriers (pores and grain boundaries) that can influence the phonon scattering is very high. This significantly reduces the mean free path of phonons,
  and thus the lattice thermal conductivity
  of the material. The high electrical resistivity
  also decreases the electronic contribution
  This eventually results in a low thermal conductivity λ.As for the 5-layers sample, the remarkable enhancement of its relative density compared to the CS sample is a primary factor in its high thermal conductivity. The thermal conductivity was measured according to the directions parallel and perpendicular to the
  axis. The values of
  are higher than those of
 This difference is due to the crystalline anisotropy, texture and density difference induced by the grain joints following both directions during development. The lateral size of platelets significantly increased under the effect of SPT process
  thus inducing a sharp decrease in the density of grain boundaries in the (a, b) planes, while their thickness was remarkably decreased
  thereby increasing the density of grain boundaries in the planes containing the
  axis. Finally, this results in the, influence of phonons scattering higher in the planes containing the axis of pressing than in the (a, b) planes. The mean free path
  is lower in the planes containing the
  axis and the lattice conductivity
  is therefore smaller than
 Their electronic conductivity
  is less than
 due to their higher electrical resistivity
  (Figure 10 (a)). The thermal conductivity
  is finally smaller than
  which is also favored by thetexture [29].At 900 K, the values of the thermal conductivities of the 5-layers sample are
 and
and while the anisotropy ratio
  is 3.2. This value of
  is greater than that reported for single crystals
  by Shikano et al. [5]. It is also higher than values reported for the massive material by Wang et al. [30]
  Zhang et al. [31]
  and Kenfaui [8]
  This high value of
  shows, that adding metallic silver is also favorable to the thermal conductivity.In this study, we sought to improve the figure of merit
  by reducing the resistivity
  An immediate consequence is the variation of the thermal conductivity
 Knowing that the Seebeck coefficient increases with temperature (Figure 12 (a)), the study of
  as a function of temperature returns to explain the variation of
 . Figure 15 shows the dependence of this ratio with the temperature, in the directions parallel and perpendicular to the
  axis, for 5-layers sample.
 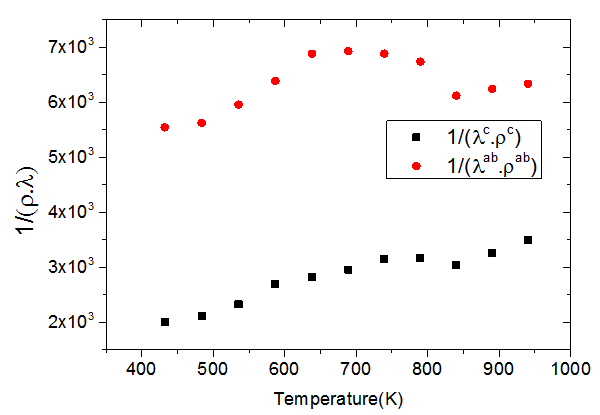 | Figure 15. Variation of the ratio  as a function of temperature following the parallel and perpendicular directions to the as a function of temperature following the parallel and perpendicular directions to the  axis of the 5-layers sample axis of the 5-layers sample |
 and
and  evolve similarly with temperature while the ratio
  is lower than
 Although
  is above
 values of
  are significantly higher than those of
 due to the remarkable reduction of
  offsetting the increase in
 .It finally appears that our textured composites are much less resistive electrically and thermally in the (a, b) planes, than along the
  axis. The optimization of the ratio
  also involves reducing
 which requires more thermally resistive ceramic in their (a, b) planes. This can be produced by limiting grain growth during creep by SPT, which increases the density of grain boundaries favorable to the reduction of
  This reduction should be greater than the increase in
  which would be induced.
 3.4.2.6. Figure of Merit
- We present in figure 16: (a) figures of merit as a function of temperature for the 5-layers sample following the directions parallel
 and perpendicular
  to the
  axis, (b) A good fit of the curve
  using a second order polynomial and (c) The anisotropy ratio
 The increase of these figures of merit at high temperature, especially for
  proves the performances stability at high temperatures, in addition to the thermal and chemical stability of these dense and textured materials.
  factors are higher than
  which shows the predominance of the reduction of the resistivity for increasing
  at high temperature.At 900 K,
  is 0.082, with
 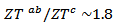 and the
  value reaches 0.10 at
 , reflecting a conversion efficiency of polycrystalline textured Ca3Co4O9/Ag much better along the (a, b) planes, than the planes containing the
  axis and also with respect to the 349 sample textured by SPS [8]. This anisotropy ratio is lower than that obtained by Kenfaui [8] on the 349 ceramic textured by HP (4.6). HP process would be more effective to induce an improvement of thermoelectric performances of the Ca3Co4O9 material and its derivatives, but this method is disadvantageous because it requires too long time texturing (36h) as compared to a shorter time texturing
  for the SPT. The estimated time for the elaboration of a 5-layers stacking sample is 202h byHP [8], against
  for the SPT which is the technic used in our study; that is a gain in time of 98%.
 | Figure 16. (a) Figures of merit as a function of temperature for the 5-layers sample following the directions parallel  and perpendicular and perpendicular  to the pressing axis. (b) Curve fitting to the pressing axis. (b) Curve fitting  by a second degree polynomial. (c) The anisotropy ratio by a second degree polynomial. (c) The anisotropy ratio  |
4. Conclusion
- Upon completion of this work, the Ca3Co4O9/Ag composite ceramics have been elaborated using conventional sintering (CS), spark plasma sintering (SPS) and spark plasma texturing (SPT) process. The Ca3Co4O9 (349) ceramics have been also elaborated by conventional sintering (CS) and spark plasma sintering (SPS). A comparative study of thermoelectric properties of different samples was performed. We have obtained a net reduction of
 in the Ca3Co4O9/Ag composite sample textured by SPT, as a consequence of the substitution of Ca+ cations by Ag+ cations and the addition of solid Ag, on one hand, and the effect of the SPT, on the other hand. The Ca3Co4O9/Ag compound has a similar behavior to that of Ca3Co4O9. The resistivity
  is
is  at
at  for the composite. Adding Ag combined to the SPT process seems unfavorable to the Seebeck coefficient, due to the low thermopower of metallic silver; that resulted in
  at
at However, the reduction of
  is more important than degradation of
  which significantly improves the power factor
  a remarkable value of
  is obtained at 900 K. Dense and textured pellets obtained by SPT are of small thicknesses to be considered studying their anisotropy and their integration into thermoelectric generator.Indeed, multilayer pellets were successfully developed and have performances identical to those of monolayers textured samples. Thick samples thus prepared were of sufficient size for the study of anisotropic properties and allow cutting thermoelements adapted to the manufacture of thermoelectric generators.The thermoelectric properties in the (a, b) planes remained unchanged after assembling monolayers. A decrease in the resistivity
  is noted. The Seebeck coefficient
  proved insensitive to texturing. The power factor
  is therefore much higher than
 but similar to that of a monolayer.The thermal conductivity is governed by the phonon contribution
  which is sensitive to the porosity, the density of grain boundaries, and texture. The values of the thermal conductivity also exhibit anisotropy, with
 The best values of the figure of merit at high temperature were obtained in the (a, b) planes, they are significantly higher than those measured on the sintered samples conventionally (CS) and SPS.The new configuration ‘Spark Plasma Texturing’ (SPT) combining the benefits of SPS and oriented nature of the HP for a time saving of about 36 times compared to the HP conventional technique was effective for the development of samples very dense, (98% of theoretical density) textured, and efficient.Moreover, due to the ductile nature of the Ag metal, we also expect an improvement in the thermomechanical properties of the Ca3Co4O9/Ag composites, depending on thermal cycles, compared to Ca3Co4O9 ceramics.
ACKNOWLEDGEMENTS
- Jérôme DIKWA and the co-authors acknowledge Mr Alexandre WAHL for responding to the realization of this work on the CRISMAT lab. The authors thank also the CRISMAT Functional Materials and Structure (FMS) group for their help during the samples preparation and especially Mr Jérôme Lecourt during the powders synthesis and pellets sintering.