Steven L. Donaldson1, T. Jared Stonecash2, Sangwook Sihn2
1Civil and Environmental Engineering and Engineering Mechanics, University of Dayton, 300 College Park, Dayton, OH 45469, USA
2University of Dayton Research Institute, 300 College Park, Dayton, OH 45469, USA
Correspondence to: Steven L. Donaldson, Civil and Environmental Engineering and Engineering Mechanics, University of Dayton, 300 College Park, Dayton, OH 45469, USA.
| Email: |  |
Copyright © 2012 Scientific & Academic Publishing. All Rights Reserved.
Abstract
Glassfiber reinforced epoxy resin laminates containing internal ply drops were fabricated using resin film infusion.The resin in the region of the ply drops was enhanced using two types of additive: aramid pulp and vapor grown carbon nanofiber (VGCNF).Laminate lay-ups of[0/0*/0]T and[+45/-45/0*/-45/+45]T (where * indicates the ply that was discontinued) were tested in both static and fatigue loading.Failures initiated at the resin pocket formed at the termination of the dropped ply, which was detected by both edge photomicrographs and a jump in longitudinal strain at the ply drop location.For the[0/0*/0]Tlaminates, addition of the aramid pulp resulted (when compared to the non-modified epoxy-only resin) in a large increase in the quasi-static stress required to initiate damage, and a slight increase in laminate strength.Addition of the carbon nanofiber resulted in essentially no change in the stress required to initiate damage, and a reduction in the ultimate strength.The trend for the[+45/-45/0*/-45/+45]T laminates showed an increase in the damage initiation quasi-static stress in both the aramid pulp and VGCNF laminates, appreciably no change in ultimate strength due to the aramid pulp, and a notable ultimate strength increase due to the inclusion of the VGCNF.Results from fatigue testing showed a large fatigue penalty due to the inclusion of the ply-drop, and no significant difference in fatigue life due to the inclusion of the nano-scale reinforcements.Finite element stress analysis modeling of the crack growth indicates the effects of having increased matrix modulus in the resin pocket zone, as well as increased value of laminate critical energy release rate.The analysis indicates the initiation of failure via transverse cracks in the resin pocket.This was confirmed by photomicrographs taken at fixed load intervals.
Keywords:
Composite, Fiberglass, Nanofiber, Ply Drop, Fatigue
Cite this paper:
Steven L. Donaldson, T. Jared Stonecash, Sangwook Sihn, "Transverse Cracks at Ply Drops in Fiberglass Laminates", International Journal of Materials Engineering, Vol. 2 No. 6, 2012, pp. 112-117. doi: 10.5923/j.ijme.20120206.06.
1. Introduction
The rapid growth of the global economy as spurred a corresponding increase in the need for electric power. In addition, it is desired to have this new power at reasonable cost and with minimal carbon output (to address concerns related to carbon output and global warming). In response to these needs, the wind turbine generator industry (including government and academic partners) has stepped-up research to reduce the cost, increase the life, and improve the reliability of the wind generator systems. Key components of the turbines are the long, slender rotating blades. The highly-loaded blades are typically fabricated from fiber-reinforced composite materials to reduce weight and increase the blade fatigue life[1]. Glass fiber is the most commonly used reinforcing material, due to its high strength and low cost when compared to other composite reinforcing fibers. As with any wing, the blade loading is higher in the root region, near the blade hub, and becomes less toward the blade tip. Therefore, the laminate thickness (skin, spar, and web) for these long, high output blade designs must necessarily change from the blade hub to the tip.Therefore, this study was initiated to focus on the damage development at ply drops.Ply drops in this study are the locations in a laminate where an internal ply is terminated.This termination creates an internal edge, where the plies above and below the terminated ply must come together beyond the location of the termination, as shown in Figure 1.This termination naturally creates a small triangular-shaped wedge at the location of the termination, which fills with resin when the laminate is cured.A major concern is that the high stresses created in this region can initiate laminate failure, as has been demonstrated both experimentally and analytically[2-8]. The failure in ply drop regions characteristically contains a transverse crack in the resin pocket, which, under increased static or fatigue loading, leads to growth of delaminations from the ends of this transverse crack. Therefore, addressing methods to analytically model the location and secondary crack progression, experimentally detect the transverse crack initiation, and delay the occurrence of these cracks in the ply drop resin pocket via the use of nano-scale resin enhancements are novel, and critical to improving the life and reliability of wind turbine generators.To address these issues, the purpose of this study was threefold: first, to analytically explore the effect of improved matrix modulus and interlaminar fracture toughness on the propensity of the resin pocket to crack and delaminate (and identify the crack sequence and location); secondly to create a rapid and accurate method to identify when the resin cracks form in laminates under test; and finally to investigate the use of nano-enhanced resins to delay the onset of cracking and delamination in the region of the resin pocket at the ply drop.
2. Experimental Approach
2.1. Specimen Fabrication
Laminate panels were fabricated with two types of lay-ups:[0/0*/0]T and[+45/-45/0*/-45/+45]T, where the * indicates the ply that was dropped (extended only one-half of the length of the specimens).Thin laminates were selected as a research tool to emphasis the effect of the ply drop and resin nano-scale modifications. The laminates were fabricated using resin film infusion of Epon 862 epoxy resin (with W hardener), and autoclave cured with the following cycle: ramp to 121℃(250 °F), hold for 1 hour, ramp to 177℃ (350 °F), hold for 2 hours, 0.758 MPa (110 psi) pressure; vacuum-bagged.In several of the panels, during the panel lay-up, additional resin films strips 7.6 cm wide were placed immediately below and above the ply drop region, as shown in Figure 2.These films contained 10 g/m2 of either the aramid Kevlar® pulp (DuPont Type 953) or Applied Sciences, Inc carbon nanofiber PR-25-PS-OX(no heat treat; functionalized).Further processing details and a discussion of the benefits of the nano-scale modifications has been previously detailed[9-10].The fiberglass used was Owens Corning WindStrand Uniweave Knytex XHPCD1200- 127cm and XHPDB1000-127 cm.The resulting laminates had a typical fiber volume fraction of 47-51%. | Figure 1. General schematic of the edge of a composite laminate containing a ply drop to reduce the laminate thickness from one region to another |
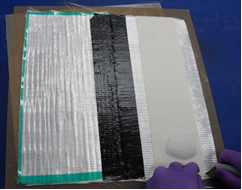 | Figure 2. Lay-up of the panels containing PR-25 carbon nanofibers in the films adjacent to the ply drop |
The cured panels were tabbed and cut into 2.54 cm wide strips for tensile testing, as shown in Figure 3.The specimen tint from the aramid pulp (top) and carbon nanofiber (bottom) is visible.Note that the static tensile specimens received 0/90 strain gages at two locations: in the central areas of thick regions of the specimens, and just at the ply drop transitions.The purpose of the gages in the thick region was to measure the far-field strains, and the gages in the ply drop region were intended to indicate the initiation of damage.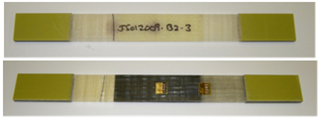 | Figure 3. Tensile specimens containing: top: aramid pulp and bottom: PR-25 vapor grown carbon nanofiber in the ply drop region |
2.2. Specimen Testing
The quasi-static specimens were tested in accordance with ASTM D3039[11], at a rate of 1.27 mm/min. under ambient laboratory conditions. The loading in several representative specimens (having polished edges) was interrupted at fixed intervals. These specimens were then removed from the load frames, edge photomicrographs were taken, then the specimens were returned for futher loading.The tension-tension fatigue tests were conducted with no strain gages, at a rate of 2 Hz, and R = min/max = 0.1.
3. Results
3.1. Quasi-Static Tests of[0/0*/0]T
A stress versus strain plot for one of the epoxy-only (no nano additive in the ply drop region) quasi-static specimens is shown in Figure 4.It is important to note that the strain gage location for the longitudinal strain values used in these figures was directly on top of the ply drop location.The ply drop region is somewhat different from specimen to specimen (due to fiber wash, etc).In addition, large strain gradients were expected in this region.Therefore, the strain output is useful to indicate damage initiation and growth, and not useful in a direct numerical comparison between specimens.Also, note that each specimen had a thick and a thin region, due to the ply drop across the center of each test coupon.The stress was calculated as the axial force on the specimen divided by the cross-sectional area of the thin region (hence nominal stress values are used here).Note, in Figure 4, the slight jump in the strain value when the stress reaches 270 MPa.This corresponds to the photomicrograph from a similar specimen, as shown in Figure 5.Each frame in Figure 5 shows the dropped ply, the plies adjacent to the dropped ply, and the resin wedge formed.A faintly visible transverse crack can be seen in the specimen having been removed at 316 MPa.Since the specimens were removed at fixed load values, based on the micrographs only, we know the initial crack formed between 0 and 316 MPa.Also note the further damage development due to a subsequent load increase, seen as multiple cracks in the micrograph taken at 765 MPa stress level.The final frame in Figure 5 shows the laminate edge after final failure. Clearly, the transverse cracks seen at lower loads have extended to form delaminations that proceed between the layers, initiating ultimate failure.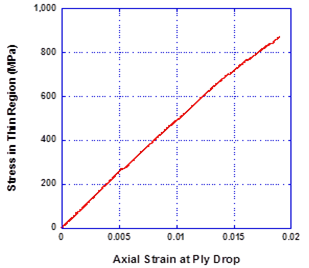 | Figure 4. Stress versus Strain at the Ply Drop for the[0/0*/0]T laminate, control resin (no nano-scale reinforcement in the ply drop region). Note the strain jump at 270 Mpa |
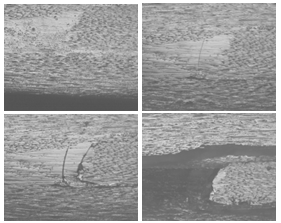 | Figure 5. Photomicrographs of the edge of specimen[0/0*/0]T laminate with control resin (no nano-scale reinforcement in the ply drop region), taken at 0, 316 MPa, 765 MPa, and after final failure (upper left, upper right, lower left, and lower right, resp).Note the progression of damage from transverse cracking in the resin wedge, to delamination at final failure |
The stress versus strain and photomicrographs for the specimens containing aramid pulp resin reinforcement in the ply drop region followed similar trends, namely, that a slight jump was observed in the stress-strain plots, at a value confirmed by the edge micrographs.For brevity, further stress-strain plots and photomicrographs are not shown, but summarized in Tables 1 and 2.As shown in Table 1, for the of[0/0*/0]T laminate containing aramid pulp additive, the initial strain jump did not occur until 757 MPa.This value was confirmed (actually, bracketed) by the micrographs, which did not show any transverse resin cracks when a 322 MPa stress was reached, but a crack did appear after a load of 778 MPa was reached.Therefore, when compared to the control (epoxy-only resin), the laminate with aramid pulp in the region of the resin pocket had an initial failure (transverse crack in the ply drop resin pocket) that was 2.75 times greater.The value of the ultimate failure, also shown in Table 1, did not change significantly: from 924 MPa (control) to 966 MPa (aramid pulp), an increase of less than 5%, and within the scatter of the test data.Table 1. Stress values for failure initiation and final failure,[0/0*/0]T laminates, three specimens per condition
 |
| |
|
Table 2. Stress values for failure initiation and final failure,[+45/-45/0 */-45/+45]T laminates, three specimens per condition
 |
| |
|
The results for the specimens containing PR-25 carbon nanofiber resin reinforcement in the ply drop region is also shown in Table 1.Note from Table 1 that the initial strain jump occurred at 265 MPa, similar to the control case.This was confirmed by the micrographs, which did not show a transverse resin crack at zero load, but one existed at 278 MPa.Therefore, the PR-25 carbon nanotube showed a slight (3.5%) drop in initial cracking when compared to the control case.In terms of ultimate strength, the the PR-25 showed a 9.1% decrease when compared to the control resin.One explanation for the observed results in the[0/0*/0]T specimens is that the aramid pulp, due to its high ductility, may have increased the strain to failure in the resin pocket, and hence delayed the initiation of the resin crack, since the strain level was controlled by the stiff adjacent 0° bounding plies.The addition of the carbon nanofiber did not provide for this increased ductility, so produced results similar to the control case.In both cases, ultimate failure was controlled by the failure of the bounding 0° plies, so occurred at similar stress values.
3.2. Quasi-static tests of of[+45/-45/0*/-45/+45]T
The results from the[+45/-45/0*/-45/+45]T laminates are shown in Table 2.These adjacent ply orientations were chosen to have a ‘softer’ longitudinal constraint when compared to the all-zero bounding plies considered previously.The stress-strain curves (not shown) are similar to those discussed previously, except for a slightly non-linear nature, common in laminates containing such a high percentage of 45° plies.In addition, the strain jump indicating transverse cracking was even more pronounced than in the all-zero degree laminates.As shown in Table 2, the epoxy-only control case shows a clear strain jump at 94.5 MPa, which is consistent with the photomicrographs showing no cracking at 88 MPa, and developed transverse cracks at 123 MPa.The stress-strain results for the[+45/-45/0*/-45/+45]T laminate, with the resin at the ply drop containing aramid pulp, indicated an initial transverse crack at 106 MPa, which was consistent with the photomicrographs (no damage seen at 80 and 100 MPa).The ultimate failure of these laminates containing aramid pulp occurred at an average of 124 MPa, which is very similar to the control laminates (123 MPa).The stress-strain results for the[+45/-45/0*/-45/+45]T laminate, with the resin at the ply drop containing PR-25 carbon nanofiber, indicated an average nominal stress of 125 MPa for the appearance of the first transverse crack.This was somewhat (32%) higher value than the control laminates. Note the strain jump at 125 MPa was consistent with the photomicrographs (no damage was visible at 103 MPa, transverse cracking was present at 130 MPa, and developed into delaminations at 154 MPa).The ultimate failure of 160 MPa was higher than the control value of 123 MPa, an increase of 30%.An explanation for the results is that the axial (loading direction) modulus and strength of the bounding plies were low (since all 45°), so the stiffness and strength of the reinforced resin played a larger role (than strain to failure) in the resin pocket failure.The addition of the aramid did not alter the strength of the resin pocket nearly as much as the strength increase due to the addition of the vapor grown carbon fiber, hence the minimal transverse crack and failure strength increases seen with the aramid pulp, and the larger increases seen with the carbon nanofiber.
3.3. Fatigue of[0/0*/0]T
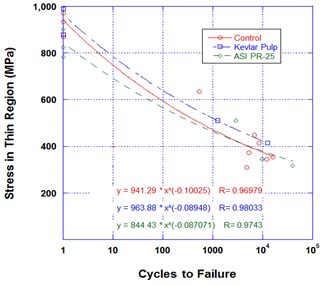 | Figure 6. Fatigue S-N life curve of[0/0*/0]T laminates, plotted on semi- log scale |
The[0/0*/0]T laminates were tested under cyclic loading conditions:2 Hz at R = min/max = 0.1.The “S-N” results are shown in Figure 6.Although the scatter in fatigue is generally large (and no exception here), a classic power-law fit (linear in log-log plot) of the data appears reasonable.The power law fit was chosen due to its long-standing use in the composite materials research field[12]. The project funding level precluded additional test data, however, some overall fatigue behaviour can be identified. For example, the dramatic reduction in fatigue strength for these thin laminates is apparent.There appears to be no clear distinct advantage or disadvantage to either of the nano-scale additives, when compared to the control epoxy-only case.A slight advantage may go to the aramid pulp reinforced resin, which is consistent with the delay in the onset of the first transverse crack seen in the static results.
3.4. Fatigue of[45/-45/0*/-45/45]T
The fatigue results for the[45/-45/0*/-45/45]T laminates are shown in Figure 7.Again, the rapid drop in stress versus life is apparent.Also, as before the power law relationship of the data is reasonable.As with the static data for this laminate, the best performing materials seem to be the epoxy reinforced with vapor grown carbon fiber.Consistent with the static results is the fact that the overall magnitude of the stress level is much lower than that observed in the all-0° laminates.
4. Stress Analysis Modeling
The addition of nano-scale additives to the resin may alter both the stiffness and fracture toughness of a composite laminate.Therefore, an understanding and quantification of these effects are important to assess potential benefits of the approach.The existence of ply drops in laminates creates complex stress states that contribute to the initiation and propagation of damage in laminates.The effects of cracks in the vicinity of the ply drop/resin pocket region were modeled using 2D finite element analysis with the virtual crack closure technique (VCCT).Cracks were assumed to exist in one of three possible locations of a[0/0*/0]T laminate, as shown in Figure 8.Crack case #1 was assumed to exist as a delamination between the dropped ply and the bounding ply, just at the end of the dropped ply.Crack case #2 was assumed to exist as a delamination between the bounding plies, just at the location of convergence of the bounding plies at the end of the resin pocket.Finally, crack case #3 was assumed to exist as a transverse crack located at the end of the dropped ply.Normalized strain energy release rates (SERR) for Mode I (opening, GI) and Mode II (shearing, GII) were calculated for each condition.Mode III results are not shown here, since the tearing values for the specific cases studied herein were all zero.In this study, the value of the matrix modulus was varied from 2 to 5 GPa to investigate the effect of resin stiffness increase on the crack driving energy (epoxy, polyester, and vinylester resins with no reinforcement have, typically, moduli in the range of 3-4 GPa).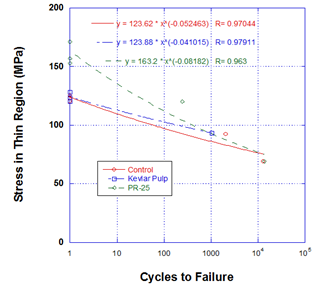 | Figure 7. Fatigue S-N life curve of[45/-45/0*/-45/45]T laminates, plotted on semi-log scale |
 | Figure 8. Idealized model for energy release rate calculations at three crack locations |
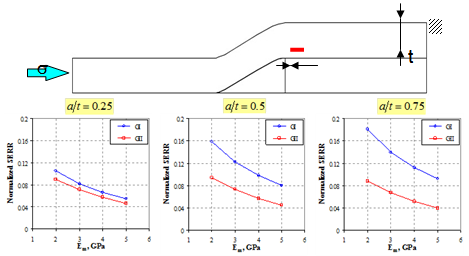 | Figure 9. Energy release rates for crack location #1 |
The results for crack case #1 are shown in Figure 9.The strain energy release rates are non-dimensionalized by multiplying the G values by[(applied stress)2 * (ply thickness) / (longitudinal modulus of the ply)].In addition, the crack lengths are normalized by dividing the crack length by the thickness of a single ply.The results for this case clearly show that an increase in matrix modulus results in a significant decrease in GI and GII.In addition, as the crack length increases (shown as plots with a/t increasing from 0.25 to 0.75), the energy release rate GI increases, indicative of unstable (or likely progressing) crack growth.The value of GII as a function of crack length does not change significantly.Clearly, an increase in GIc and/or the matrix modulus would improve the delamination resistance at this location.An improvement in GIIc would have a negligible effect on delamination progression.The results for crack location #2 are shown in Figure 10.At this location (delamination at the tip of the resin pocket), GII is zero.Note that an increase in the matrix modulus slightly reduces the opening crack driving force GI.Also, an increase in the crack length increases GI (unstable crack location).Note that the overall magnitude of SERR in Figure 10 is half of that observed in Figure 9 (crack location #1).An increase in GIc would reduce the tendency for crack growth at this location.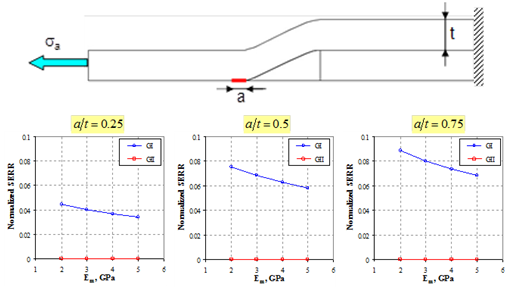 | Figure 10. Energy release rates for crack location #2 |
Figure 11 depicts the crack growth potential of a crack in location #3 (transverse crack at the end of the dropped ply).Unlike the previous two cases, increasing the matrix modulus produces an increase in GI.This may possibly account, somewhat, for the lack of improvement seen in the[0/0*/0]T laminates containing the high modulus vapor grown carbon fiber.Note that with increasing crack length, the value of GI increases, meaning crack growth would be unstable.The notably higher value of SERR at location #3 (a tenfold increase with respect to crack location #1 and a twenty-fold increase over crack location #2) indicates that crack location #3 is the most likely site of damage initiation (which is verified by the photomicrographs).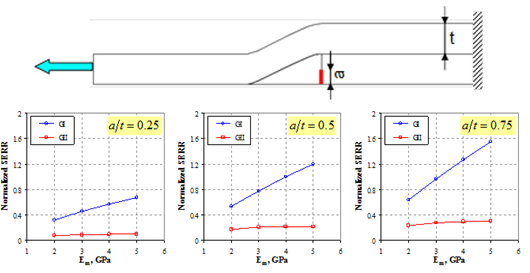 | Figure 11. Energy release rates for crack location #3 |
5. Conclusions
The purpose of this study was to investigate the damage development due to ply drops in tapered fiberglass laminates under tensile static and fatigue loading, and to assess the effects of using nano-scale matrix reinforcement in the resin pockets that form at the end of the internally dropped plies.Laminate panels were fabricated with two types of lay-ups:[0/0*/0]T and[+45/-45/0*/-45/+45]T, where the * indicates the ply that was dropped.The laminates were fabricated using resin film infusion of Epon 862 epoxy resin. These films contained no nanofiber, 10 g/m2 of aramid pulp, and 10 g/m2 of Applied Sciences, Inc carbon nanofiber PR-25-PS-OX.The fiberglass used was Owens Corning WindStrand Uniweave Knytex.In the statically loaded specimens, the placement of an axial strain gage was useful in determining the stress level at the initiation of the first transverse crack.The utility of this method was verified using micrographs of the polished laminate edges.The[0/0*/0]T laminates with aramid pulp had an initial failure (transverse crack in the ply drop resin pocket) stress that was 2.75 times greater than the epoxy-only control.The PR-25 carbon nanotube showed a slight 3.5% drop in initial cracking stress when compared to the control case.In terms of ultimate strength, the aramid pulp specimens showed a 4.5% increase, whereas the PR-25 showed a 9% decrease when compared to the control resin.The[45/-45/0*/-45/45]T laminates with aramid pulp had an initial failure (transverse crack in the ply drop resin pocket) that was 11.6% greater than the epoxy-only control.The PR-25 carbon nanotube showed a 30% increase in initial cracking when compared to the control case.In terms of ultimate strength, the aramid pulp specimens showed a 1% increase, whereas the PR-25 showed a 30% increase when compared to the control resin.The laminates were tested under cyclic loading conditions: 2 Hz at R = 0.1.A power-law fit of the S-N data appeared reasonable.Under fatigue loading, there appeared to be a very slight advantage for aramid pulp and carbon nanofibers in the[0/0*/0]T and[45/-45/0*/-45/45]T laminates, respectively, consistent with the static results.The dramatic reduction in fatigue strength for these thin laminates was apparent.Finite element stress analysis modeling of the crack growth indicated the effect of having increased matrix modulus in the resin pocket zone, as well as increased value of laminate critical energy release rate.The modeling correctly indicated the sequence of damage initiating from the transverse cracks in the resin pocket adjacent to the dropped plies.
ACKNOWLEDGEMENTS
The authors would like to express their gratitude to the Ohio Department of Development, Research Commercialization Program for sponsoring this project.Also, the technical support of Elizabeth Brooks is gratefully appreciated.
References
| [1] | Brøndsted, P., Lilholt, H, and Lystrup, A., Composite Materials for Wind Power Turbine Blades, , Vol. 35: 505-538, 2005 |
| [2] | Cairns, D.S., Mandell, J.F., Scott, M.E., Maccagnano, J.Z.: Design and manufacturing considerations for ply drops in composite structures, Composites: Part B 30, 523–534, 1999 |
| [3] | Mukherjee, A., Varughese, B.: Design guidelines for ply drop-off in laminated composite structures, Composites: Part B 32, 153–164, 2001 |
| [4] | Murri, G.B. and Schaff, J.R.: Fatigue life methodology for tapered hybrid composite flexbeams, Composites Science and Technology 66, 499–508, 2006 |
| [5] | Shim, D. and Lagace, P.A.: Mechanisms and structural parameters affecting the interlaminar stress field in laminates with ply drop-offs, Journal of Composite Materials, Vol. 40, No. 4, 345-369, 2006 |
| [6] | He, K., Hoa, S. V., and Ganesan, R.: The study of tapered laminated composite structures: a review, Composites Science and Technology 60, 2643-2657, 2000 |
| [7] | Her, S., Stress analysis of ply drop-off in composite structures, Composite Structures 57, 235-244, 2002 |
| [8] | Fish, J. C. and Lee, S. W., Delamination of Tapered Composite Structures, Engineering Fracture Mechanics, Vol. 34, No. 1, 43-54, 1989 |
| [9] | Tibbetts, G.G., Lake, M.L., Strong, K.L., and Rice. B.P.: A Review of the Fabrication and Properties of Vapor-Grown Carbon Nanofiber/Polymer Composites, Composites Science and Technology, 67, 1709-1718, 2007 |
| [10] | Lafdi, K. and K. M. Matzek: Carbon Nanofibers as a Nano- Reinforcement for Polymeric Nanocomposites,” presented at the 35th International SAMPE Technical Conference Proceedings, September-October, 2003 |
| [11] | ASTM D3039: Standard Test Method for Tensile Properties of Polymer Matrix Composite Materials, ASTM International, West Conshohocken, PA, 19428 USA |
| [12] | Hahn, H. T. and Kim, R. Y., Fatigue Behavior of Composite, Journal of Composite Materials April 10: 156-180, 1976 |


 Abstract
 Reference
 Full-Text PDF
 Full-Text HTML

