Leandro José da Silva 1, Túlio Hallak Panzera 1, André Luis Christoforo 1, Luís Miguel Pereira Durão 2, Francisco Antonio Rocco Lahr 3
1Department of Mechanical Engineering, Federal University of São João del Rei, Frei Orlando Square, 170 - São João del-Rei, Brazil – MG, 36307-352
2ISEP - School of Engineering Polytechnic of Porto, Centre for Research and Development in Mechanical Engineering (CIDEM), Rua Dr. António Bernardino de Almeida, 431 – 4200-072 Porto, Portugal.
3Department of Structural Engineering, University of São Paulo (EESC/USP), São Carlos, 13566-590, Brazil
Correspondence to: André Luis Christoforo , Department of Mechanical Engineering, Federal University of São João del Rei, Frei Orlando Square, 170 - São João del-Rei, Brazil – MG, 36307-352.
| Email: |  |
Copyright © 2012 Scientific & Academic Publishing. All Rights Reserved.
Abstract
In the last decades the biocomposites have been widely used in the construction, automobile and aerospace industries. Not only the interface transition zone (ITZ) but also the heterogeneity of natural fibres affects the mechanical behaviour of these composites. This work focuses on the numerical and experimental analyses of a polymeric composite fabricated with epoxy resin and unidirectional sisal and banana fibres. A three-dimensional model was set to analyze the composites using the elastic properties of the individual phases. In addition, a two-dimensional model was set taking into account the effective composite properties obtained by micromechanical models. A tensile testing was performed to validate the numerical analyses and evaluating the interface condition of the constitutive phases.
Keywords:
Natural Composites, Sisal Fibres, Banana Fibres, Finite Element Analysis
1. Introduction
The biocomposite structures constituted of polymeric matrices and natural fibres have been widely investigated in the last decades with high potential of application[1, 2]. Nowadays, these composites comprise one of the major areas of interest in composite materials research[3]. According to[4], this interest became more effective due to the growing search for low cost materials from renewable sources able to substitute traditional ones. Furthermore, several products made of reinforced plastics have been manufactured with biocomposites with great success[5]. One of the limitations of biocomposites is the difficulty to predict the mechanical behaviour due to the interface conditions between the natural fibres and the polymeric matrices, which is emphasized by the heterogeneity of natural fibre surface.Traditionally, the macroscopic/microscopic approaches have been used in the analysis of composite structures. Instead of analytical methods, numerical simulations have been used to predict the mechanical behaviour of composite structures. The Finite Element Method (FEM) has been used to analyze the global behaviour of composite structures and play an important role in detecting damage for laminated composites[6]. The FEM must be used with adequate geometric complacence in order to enhance the analyses.[7] suggests avoiding triangular finite elements when the stress raiser factors are analysed and extreme mesh refinement is demanded. In this case, elements with four nodes should be also avoided due to shape approaches. The eight node elements can be used when a superior performance, related to geometric approaches, is desired.Several works found in the open literature apply the FEM to analyze the interactions between the constitutive phases based on the global behaviour of the composites[8-13]. Few works has been investigating the composites reinforced with natural fibres[14-16]. This work focuses on the numerical and experimental analysis of biocomposites reinforced with unidirectional sisal and banana fibres. Micromechanical models and experimental tests were performed to obtain the mechanical properties of the individual composite phases and the biocomposites in order to evaluate the finite element model and the interface conditions.
2. Materials and Methods
Two biocomposites were investigated in this work, one fabricated with sisal fibres and another with banana fibres. The sisal fibres (Agave Perrine) were supplied by Sisalsul Company (São Paulo-Brazil). The banana fibres were manually extracted from pseudo steam of banana plant (Musa balbisiana). The thermoset matrix phase, epoxy resin (Diglicidil etér of bisfenol A), was supplied by Alpha Resiqualy Company (São Paulo-Brazil).Tensile tests were carried out to characterize the fibres and the matrix phase according to ASTM[17] and ASTM[18] respectively. The elastic properties were used to perform the micromechanical analyses of the composites reinforced with 30% of fibre volume fraction. Micromechanical models such as “Rule of mixture” and “Halpin-Tsai” were used to estimate the effective properties of the biocomposites. The Rule of mixture considers a perfect interface condition (Voigt model) and the Halpin-Tsai considers a semi-empirical model. Table 1 shows not only the modulus of elasticity (E) of the fibres and the matrix, but also the results obtained via micromechanical analyses. It is noted that the banana fibres (31.56 GPa) are stiffer than sisal fibres (16.40 GPa).| Table 1. Constitutive phases and composites (micromechanical analysis) properties |
| | Material | Method | E (GPa) | | Sisal fibre | Experimental | 16.40 (±2.51) | | Banana fibre | 31.56 (±2.80) | | Epoxy resin | 0.83 (±0.05) | | Composites | Rule of Mixture | Sisal fibre | 5.50 | | Banana fibre | 10.05 | | Halpin-Tsai | Sisal fibre | 2.40 | | Banana fibre | 3.77 |
|
|
A composite lamina reinforced with sisal/banana fibres were fabricated manually by the use of a metallic frame to align the fibres, avoiding the presence of residual stress after cure, as shown in Figure 1.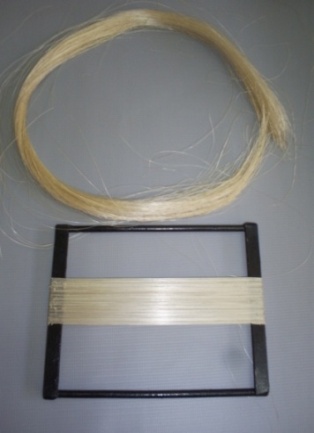 | Figure 1. Assembly of natural fibres using a metallic structure |
A scanning electron microscopic (SEM), Hitachi T-3000 model, was used to observe the cross section of the biocomposites. Figure 2 shows the back scattering electron images of the sisal (a) and banana (b) fibre composites, respectively.The testing machine Shimadzu-Autograph was used to determine the modulus of elasticity and strength of the composites based on the recommendations of British Standard BS EN ISO[19]. A machine speed of 2 mm.min-1 was set during the tensile test (Figure 3).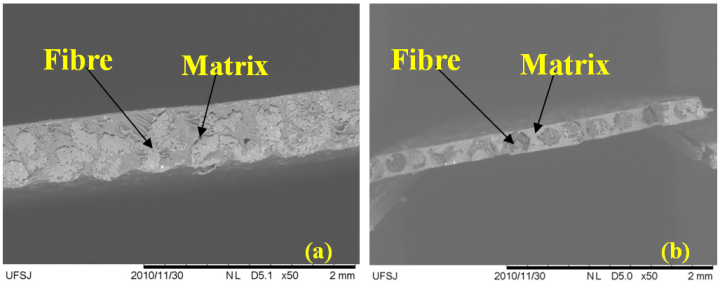 | Figure 2. Backscattering electron images of sisal composite: (a) and banana composite (b) |
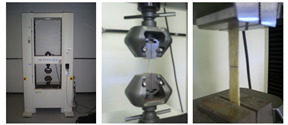 | Figure 3. Tensile test for sisal fibre composite. |
The experimental stress-strain curve was compared to the Finite Element Analyses (FEA) results. The FEA was conducted based on the elastic properties obtained via micromechanical models and tensile test. Table 2 shows the modulus of elasticity of the composites obtained by tensile testing. The banana fibre composites (8.44 GPa) exhibit a superior modulus of elasticity to the sisal fibre composites (6.22 GPa).| Table 2. Modulus of elasticity of the composites |
| | Composite | E (GPa) | | Epoxy/sisal | 6.22 (±0.38) | | Epoxy/banana | 8.44 (±0.83) |
|
|
3. Finite Element Analyses (FEA)
In order to verify the efficiency of the FEA, experimental tests were conducted for the composites fabricated with 30% of sisal and banana fibres. The software Ansys® 12.1 was used to simulate the biocomposites under tensile loadings using two-dimensional (2D) and three-dimensional (3D) models.Some approaches were carried out in the FEA model, mainly when the 3D analysis was performed. The fibres were set as circular cross-section, parallel distributed and uniform along its length; the matrix phase was set as homogeneous, continuous and isotropic; and a perfect adhesion between the constitutive phases was set.The numerical model was fixed in one of the ends and the load was uniformly distributed in the cross section (pressure) of the other end, increasing its intensity from 0 up to 100 MPa, with increments of 10. The loading levels were chosen to assure a linear-elastic analysis during the simulation.The pressure increments were applied in the numerical specimen, and the displacements were collected. Based on these results the specific strain ( ) was calculated by Eq. 1, where ∆L is the length variation (mm) and L is the original length (mm) of the specimen.
 | (1) |
The numerical stress/strain curves were plotted and compared with the experimental tensile test in order to evaluate the interface condition. The FEA was carried out using a 2D and 3D model.
3.1. Two-Dimensional Simulation
In the two-dimensional (2D) model the composite behaviour was estimated using the elastic properties provided via micromechanical models: “Rule of mixture” and “Halpin-Tsai”. The material was considered isotropic and homogeneous. The Poisson ratio was calculated by the rule of mixture based on the Poisson ratio of the sisal fibres (zero) and the epoxy resin (0.4).
3.1.1. Sisal Fibre Composites
The maximum displacements were used to obtain the specific strain of the composites. Table 3 exhibits the numerical strain values obtained for each stress level. The absolute error corresponds to the percent difference between the experimental and numerical results.Figure 4 shows the stress/strain curves obtained via two-dimensional (2D) analyses for the numerical models (Rule of mixture and Halpin-Tsai) and experimental test. The curve identified as ‘Experimental modulus’ represents the numerical simulation data based on the elastic properties via mechanical testing. The large percent error indicates that the model was not able to predict the mechanical behaviour of the composites, even when the experimental elastic property was used (Table 2).| Table 3. Specific strain for the sisal fibre composites – two-dimensional model |
| | Stress(MPa) | Exp. | Specific strain (mm/mm) | | Rule of Mixture | Halpin-Tsai | Exp. Modulus | | 0 | 0 | 0 | Er % | 0 | Er % | | Er % | | 10 | 0.001238 | 0.001815 | 46.55 | 0.004160 | 235.98 | 0.001597 | 28.99 | | 20 | 0.002414 | 0.003629 | 50.33 | 0.008320 | 244,65 | 0.003195 | 32.33 | | 30 | 0.003714 | 0.005444 | 46.58 | 0.012481 | 236.05 | 0.004792 | 29.02 | | 40 | 0.005105 | 0.007258 | 42.18 | 0.016641 | 225.96 | 0.006389 | 25.15 | | 50 | 0.006513 | 0.009073 | 39.30 | 0.020801 | 219.37 | 0.007986 | 22.62 | | 60 | 0.007935 | 0.010887 | 37.20 | 0.024961 | 214.55 | 0.009584 | 20.77 | | 70 | 0.009348 | 0.012702 | 35.89 | 0.029121 | 211.54 | 0.011181 | 19.61 | | 80 | 0.010766 | 0.014517 | 34.83 | 0.033281 | 209.12 | 0.012778 | 18.69 | | 90 | 0.012218 | 0.016331 | 33.66 | 0.037442 | 206.44 | 0.014376 | 17.66 | | 100 | 0.013692 | 0.018146 | 32.53 | 0.041602 | 203.85 | 0.015973 | 16.66 |
|
|
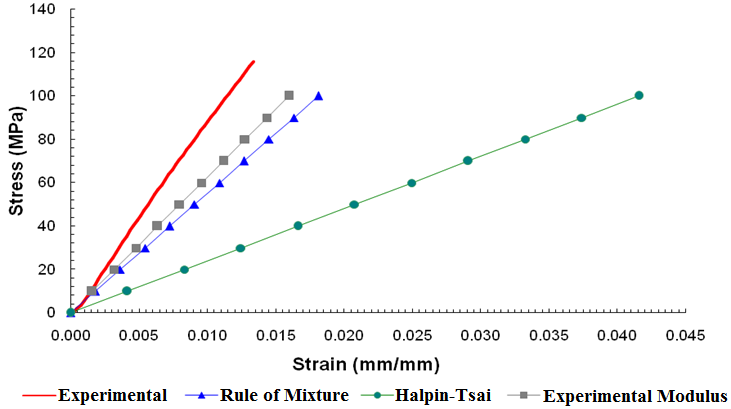 | Figure 4. Stress/strain plot model of the sisal fibre composites for 2D model |
The FEA based on the elastic properties from the “Rule of Mixture” exhibited better results compared to Halpin-Tsai model. This behaviour can be attributed to the good adhesion quality between the constitutive phases. The simulation using the experimental modulus of elasticity achieved better results compared to the micromechanical analysis model. However, a large percent error was observed, which can be attributed to the Poisson ratio predicted by the rule of mixture. The Poisson ratio of the sisal fibres and epoxy resin was considered zero and 0.4, respectively.
3.1.2. Banana Fibre Composites
The specific strains for the banana fibre composites are shown in Table 4. The specific strains determined by the rule of mixture and the experimental modulus exhibited a good agreement with the experimental results, except for the Halpin-Tsai model. The error is higher when the applied force is lower. This behaviour can be attributed to the sample adjustment in the beginning of the test. Figure 5 shows the stress/strain curves obtained by the experimental tensile test and 2D numerical simulations.The experimental and numerical results revealed a good agreement, except for Halpin-Tsai model. Halpin-Tsai model is a semi-empirical equation which considers a non-perfect interface condition. In this way, it is possible to conclude that the banana fibres provide a good adhesion with the matrix phase, showing a correlation between the numerical (rule of mixture and experimental modulus) and the experimental results.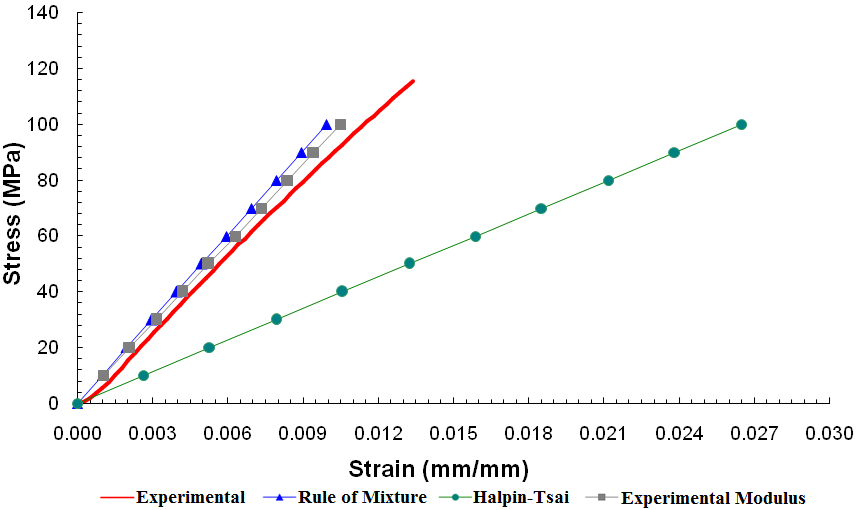 | Figure 5. Stress/strain plot for the two-dimensional analyses of banana fibre composites |
3.2. Three-Dimensional Simulation
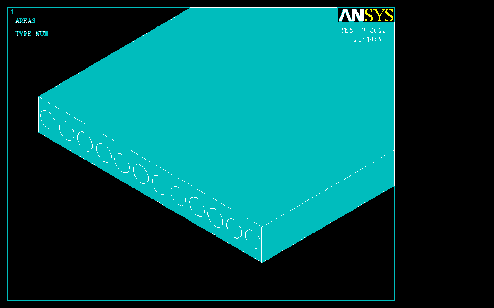
Based on the scanning electron microscopic images (Figure 2) of the composite cross section, it was possible to design a three-dimensional model (3D). In this case, the composite behaviour was investigated using the individual properties of the constitutive phases (matrix and fibres) reported in Table 1.The discretization of the 3D model was performed with the finite element Solid 185. This finite element is designed by eight nodes situated at the corner of the cube. Each node has six degree of freedom, three translations and three rotations around X, Y and Z axis.According to the SEM image of the sisal composite cross section detailed in Figure 2a, a 3D model was mounted with 55 parallel fibres oriented in the same direction of the tensile load (Figure 6). In order to minimize the computational work, only a part of the structure was simulated, as seen in Fig. 6. Figure 2b shows a good alignment and a uniform distance between the banana fibres. The banana fibre composites are more homogeneous than the sisal fibre composites. The 3D model for the banana fibre composites was designed as shown in Figure 7.The longitudinal moduli of elasticity of the phases (matrix and fibres) were used for the FEA. The determination of Poisson ratio of natural fibres is very complex. For this reason different levels of Poisson ratio (from 0.00 up to 0.35) were investigated in order to identify whether there is significant effect on the mechanical behaviour of the composites. According to[20] the Poisson ratio of the epoxy resin was taken as 0.4.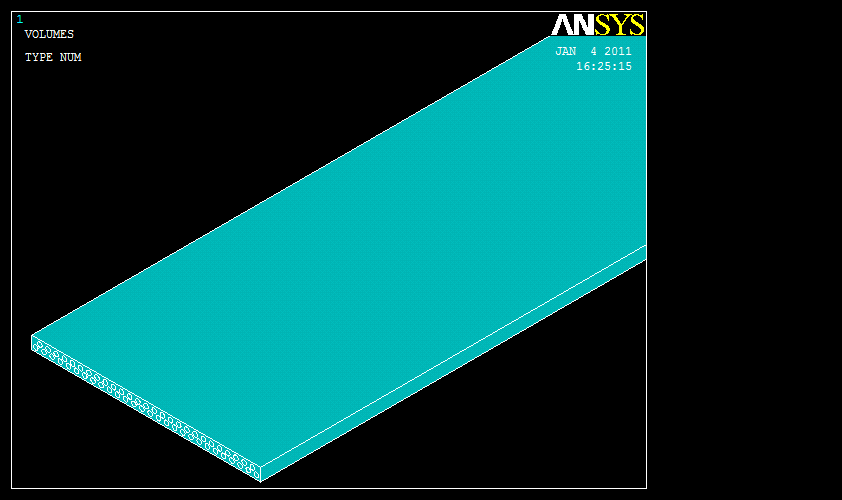 | Figure 6. Three-dimensional (3D) model of the sisal fibre composite |
 | Figure 7. Three-dimensional (3D) model of the banana fibres composite |
3.2.1. Sisal Fibre Composites
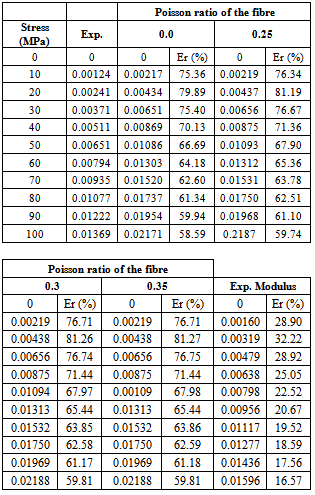
The 3D simulation results of the sisal fibre composites are exhibited in Table 5. As well as observed for the 2D simulation, high percent errors were obtained.Table 5. Specific strains for the sisal fibre composites – Three-dimensional model
 |
| |
|
Figure 8 shows the stress/strain curves related to numerical and experimental results. The 3D simulation data revealed that the Poisson ratio values of the sisal fibres do not affect significantly the linear-elastic behaviour of the composites.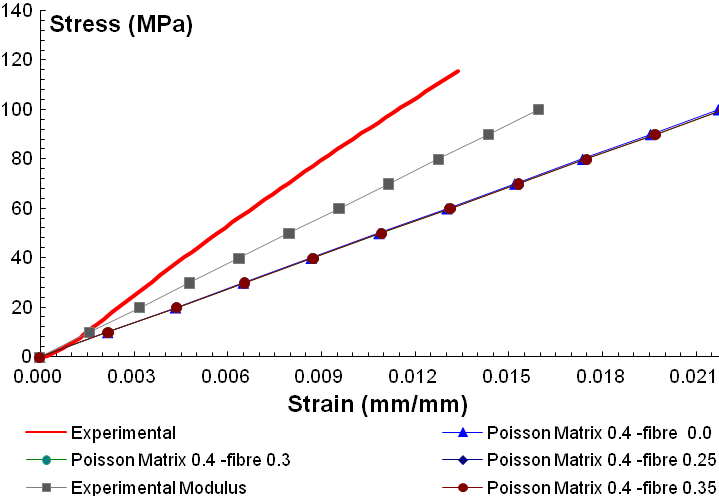 | Figure 8. Stress/strain curves of the sisal fibres composites for 3D model |
The 2D and 3D models were not able to simulate acceptably the mechanical behaviour of the sisal fibre composites. This fact can be attributed to the modelling hypothesis, such as the circular cross section and the uniform distribution of sisal fibres in the matrix phase.As it verified in the SEM image (Figure 2), the composite reinforced with sisal fibres exhibits an irregular cross section with heterogeneous fibre distribution, which hinders the design of 3D modelling. The 3D simulation carried out using the experimental modulus of elasticity showed better results, however it was not able to simulate the experimental behaviour of the composite.The 2D and 3D models for the sisal fibre composites exhibited similar results, as can be noted by the percent error values showed in Table 2 and 5, respectively. The 2D simulation, which was based on the properties of the “Rule of Mixture model”, well described the composite behaviour here analysed.
3.2.2. Banana Fibre Composites
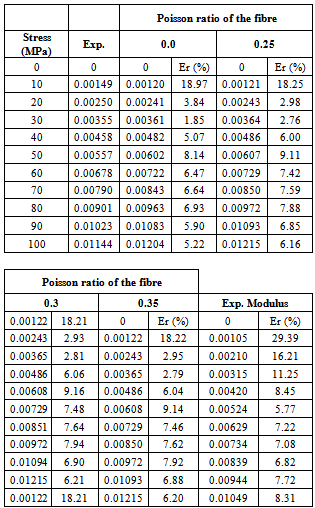
Table 6 shows the experimental and numerical specific strain data obtained by the 3D composite model. The results reveal a good correlation between the specific strains, except for the lower pressure (10MPa), which can be explained by the clamping effect in the beginning of the test, as seen in Figure 9.Table 6. Specific strain for the banana fibre composites – Three-dimensional model
 |
| |
|
As shown in Table 6, the numerical results exhibited good estimative showing percent errors lower than 10%. Fig. 9 reveals that the Poisson ratio variation does not affect the FEA results. The FEA performed using the experimental modulus of elasticity validates the 3D numerical model for the banana fibre composites.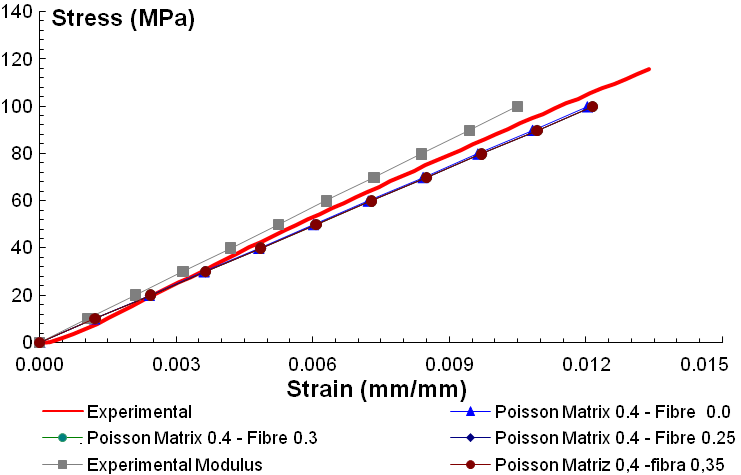 | Figure 9. Stress/strain curves of banana fibre composites for 3D model |
4. Conclusions
The uniformity and the arrangement of the natural fibres along the matrix phase are primary to achieve significant results from the finite element analysis.The 2D simulation using the elastic properties predicted by the Rule of mixture was able to describe the biocomposites behaviour, revealing a strong interface condition.The FEA joined with the micromechanical analysis was able to characterize the interface condition of the composite phases.The 3D model was able to simulate the experimental results of the banana fibre composites. The uniformity and homogeneity of banana fibre composites enhanced the model prediction efficiency. The variation of Poisson ratio (from 0.0 up to 0.4) of the fibres does not affect the FEA results.Otherwise, the 3D simulation was not able to predict the mechanical behaviour of sisal fibre composites which was attributed to the non-uniformity and heterogeneity of the fibres.The FEM can be applied to estimate the mechanical behaviour of biocomposites reinforced with unidirectional natural fibres, mainly when there is regularity and symmetry of fibre arrangements.
References
| [1] | K. Van De Velde, P. Kiekens. “Thermoplastic pultrusion of natural fibres reinforced composites.” Composite Structures, Vol. 54, p. 355–360, 2001. |
| [2] | M. A. Dweib, B. Hu, A. O’donnell, H. W. Shenton, R. P. Wool. “All natural composite sandwich beams for structural applications”. Composite Structures, Vol. 63, p. 147–157, 2004. |
| [3] | D. Nabi Saheb, J. P. Jog. “Natural Fibre Polymer Composites: A Review”. Advances in Polymer Technology, Vol. 18, No. 4, p. 351–363, 1999. |
| [4] | R. V. Silva. “Compósito de resina poliuretana derivada de óleo de mamona e fibras vegetais”. 2003, 139p. Tese (Doutorado) - Escola de Engenharia de São Carlos, Universidade de São Paulo, São Carlos. |
| [5] | K. M. Mohan Rao, K. Mohana Rao. “Extraction and tensile properties of natural fibres: Vakka, date and bamboo”. Composite Structures, Vol. 77, p. 288–295, 2007. |
| [6] | K. Alnefaie. “Finite element modeling of composite plates with internal delamination”. Composite Structures, Vol. 90, p. 21–27, 2009. |
| [7] | J. E. Saliba. “Use of Finite Element in Micromechanics of Natural Composites”. Computers & Structures, Vol. 61, n. 3, 415-420, 1996. |
| [8] | L. M. Junior, P. Brøndsted. “Micromechanical modeling of damage and fracture of unidirectional fibre reinforced composites: A review”. Computational Materials Science. Vol. 44, p. 1351–1359, 2009a. |
| [9] | S. J. Kim, C. S. Lee, H. J. Yeo, J. H. Kim, J. Y. Cho. “Direct numerical simulation of composite structures”. Journal of composite materials, Vol. 36, n. 24, p. 2765 – 2785, 2002. |
| [10] | G. Z. Kang, Q. Gao. “Tensile properties of randomly oriented short δ-Al2O3 fibre reinforced aluminium alloy composites: II. Finite element analysis for stress transfer, elastic modulus and stress-strain curve”. Composites Part A, Vol. 33, p. 657 – 667, 2002. |
| [11] | L. M. Junior, P. Brøndsted. “Micromechanisms of damage in unidirectional fibre reinforced composites: 3D computational analysis”. Composites Science and Technology, Vol. 69, p. 1036 – 1044, 2009b. |
| [12] | A. S. Virk, J. Summerscales, W. Hall, S. M. Grove, M. E. Miles. “Design, manufacture, mechanical testing and numerical modeling of an asymmetric composite crossbow limb”. Composites: Part B, Vol. 40, p. 249–257, 2009. |
| [13] | G. Wimmer, C. Schuecker, H. E. Pettermann. “Numerical simulation of delamination in laminated composite components – A combination of a strength criterion and fracture mechanics”. Composites: Part B, Vol. 40, p. 158–165, 2009. |
| [14] | A. A. Shaikh, S. A. Channiwala. “Experimental and Analytical Investigation of Jute Polyester Composite for Long Continuous Fiber Reinforcement”. Journal of Reinforced Plastics and Composites, Vol. 25, n. 8, p. 863 – 873, 2006. |
| [15] | S. Lee, S. Wang, G. M. Pharr, H. Xu. “Evaluation of interphase properties in a cellulose fiber-reinforced polypropylene composite by nanoindentation and finite element analysis”. Composites: Part A, Vol. 38, p. 1517–1524, 2007. |
| [16] | S. K. Al-Oraimi, A. C. Seibi. “Mechanical characterisation and impact behaviour of concrete reinforced with natural fibres”. Composite Structures, Vol. 32, p. 165-171, 1995. |
| [17] | American Society For Testing And Materials. ASTM. “Standard test method for tensile properties of single textile fibers”. ASTM D3822, Annual book of ASTM standards, 2007. |
| [18] | American Society For Testing And Materials. ASTM. “Standard test method for tensile properties of plastics”. ASTM D638, Annual book of ASTM standards, 2003. |
| [19] | British Standard. BS. “Glass fibre reinforced plastics: tensile test”. BS 2747, 1998. |
| [20] | V. Tita. “Análise dinâmica teórica e experimental de vigas fabricadas a partir de materiais compósitos poliméricos reforçados”. 1999, 155 p. Thesis. Escola de Engenharia de São Carlos da Universidade de São Paulo. São Carlos - SP. |
 Abstract
 Reference
 Full-Text PDF
 Full-Text HTML