Atanda. P. O. 1, Ijitona O. 1, Oluwole O. O. 2
1Materials Science and Engineering DepartmentObafemi Awolowo University, Ile-ife, Nigeria
2Mechanical Engineering Department, University of Ibadan, Nigeria
Correspondence to: Oluwole O. O. , Mechanical Engineering Department, University of Ibadan, Nigeria.
| Email: |  |
Copyright © 2012 Scientific & Academic Publishing. All Rights Reserved.
Abstract
The work investigated the corrosive effect of pineapple juice on the fatigue and hardness properties of austempered ductile iron in a stagnant fluid environment. The test data and the related material constants were used in the fatigue life prediction analysis to aid in the design of components made from ductile iron. Eighteen specimen were divided into three groups and were labelled A1,2,3,4,5,6 , B1,2,3,4,5,6 and C1,2,3,4,5,6. They were subjected to the corrosive medium and each group were removed from the medium at an interval of two weeks respectively. Fatigue and hardness tests were conducted on the samples as well as on control samples D1,2,3,4,5,6 at different corrosion levels. The results obtained showed that ductile iron corroded in pineapple juice and the fatigue strength reduced with increasing retention of samples in corrosive environment until there was no defined fatigue limit at the end of six weeks in the corrosive fluid. Hardness property was not significantly affected in pineapple juice environment. pH progressively went more acidic in the course of corrosion.
Keywords:
Corrosion, Fatigue, Hardness, Microstructure, Nodularity
Cite this paper:
Atanda. P. O. , Ijitona O. , Oluwole O. O. , "Corrosive Effect of Pineapple Juice on the Fatigue and Hardness Properties of Austempered Ductile Iron", International Journal of Materials Engineering , Vol. 1 No. 1, 2011, pp. 21-25. doi: 10.5923/j.ijme.20110101.03.
1. Introdution
In the past 40 years, the use of Ductile Iron has grown rapidly, mainly through conversions from Gray and Malleable Iron castings and steel castings, forgings and fabrications but also through its use in new components designed with Ductile Iron. Ductile Iron has been successful because it has offered the design engineer a combination of versatility and properties not available in any of its rivals. Its castability, machinability, damping properties, and economy of production are almost equal to those for which Gray Iron is famous, but its mechanical properties - strength, wear resistance, fatigue strength, toughness and ductility are competitive with many cast, forged and fabricated steel components. The conversion of Gray Iron castings to higher strength. Conversions from steel have offered similar, methods of improving cost effectiveness: new designs to improve performance and manufacturability, or the use of existing designs to provide equivalent performance, improved manufacturability and a 10 per cent reduction in weight. In summary, Ductile Iron has been successful because it has offered the designer superior value - higher quality and performance at lower cost (Keith, 2008).Ductile iron is a cast iron that has been treated while molten with an element such as magnesium or cerium to induce the formation of free graphite as nodules or sphere-lites, which imparts a measurable degree of ductility to the cast metal. Also known as, nodular cast iron, spherulitic graphite cast iron, and spheroidal graphite (SG) iron. Ductile Iron is not a single material, but a family of versatile cast irons exhibiting a wide range of properties, which are obtained through microstructure control. The most important and distinguishing microstructural feature of all Ductile Irons is the presence of graphite nodules which act as "crack-arresters" and give Ductile Iron ductility and toughness superior to all other cast irons, and equal to many cast and forged steels.As with most grades of cast iron, ductile irons display (AZoM, 2008): Good hardness and good wear resistanceHave tensile and yield strengths that vary widely across the various grades.Have compressive strengths that can be utilised more widely (than tensile strengths), with values tending to be about twice the tensile strength.Impact strengths are better than grey irons, with lower grades approaching values common for mild steel.Fatigue strengths are approximately 40 to 50% of tensile strengths.Electrical resistivities are significantly lower compared to grey ironsCorrosion resistance is similar to grey ironMachinability is dependent on hardness, with ferritic grades machining better.It might be assumed on the basis that there is little difference between the chemical analyses of ductile and gray cast irons that the corrosion resistance of the two materials also would be similar. However, there is disagreement as to whether or not ductile iron should have better corrosion resistance than has gray cast iron because of the spheroidal morphology of the graphite nodules. LaQue (1995) considered earlier that the interconnected and overlapping flakes of graphite in gray iron (as opposed to the well-dispersed and separate graphite nodules found in ductile iron) could tend to promote a greater depth of penetration of corrosion along the margins of the graphite flakes. This suggestion was supported by Fuller (1981) based on his analysis of data from ductile pipe that had been exposed in field installations. It was suggested that ductile iron would be less susceptible to deep localized pitting than was gray iron because its spheroidal graphite structure might encourage a given amount of corrosion attack to spread out over the surface of the metal. Ferguson and Nicholas (1984) reported from their tests on adjacent ductile and gray iron mains that the durability of ductile iron pipe was better than that of gray iron pipe due to lesser pitting rate, greater strength, and greater ductility. There is however, dearth of information of corrosion in pineapple juice.Pineapple is a source of vitamin C and this is always in form of ascorbic acid with low pH (Fasoyiro.et al, 2005). Therefore, pineapple can be said to be acidic.Corrosion of industrial metals is one of the oldest problems that have ever challenged the industrial world and is defined variously (Mailliard, 1985, Trethewey and Chamberlain,1995, Callister,1996). The work involved the study of effect of pineapple juice on fatigue and hardness properties of austempered ductile iron (ADI).Fatigue failures account for an overwhelming majority of all structural failures in cyclic devices such as engines, and design engineers must consider fatigue strength alongside elastic strength or ultimate strength, in their calculations. This research was done to study the behaviour of ductile iron when used where pineapple juice is extracted.
2. Methodology
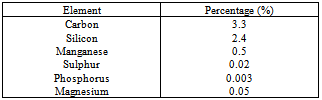
Austempered ductile iron alloyed with about 0.5% Mn was used in this study with composition as presented in Table 1.Table 1. Chemical composition of the austempered ductile iron under study
 |
| |
|
Samples PreparationThe ductile iron used for this research was produced and cast into rod forms. The ductile iron rod was carefully machined to the required sizes and shapes of the fatiguespecimen. The fatigue specimen is such that the fatigue-testing machine can grip it easily. Twenty four samples were machined out and were divided into four groups of six samples in a group. The samples in group A were labelled A1, A2, A3, A4, A5 and A6; the samples in group B were labelled B 1, B 2, B 3, B 4, B 5 and B 6 and the samples in group C were labelled C 1, C 2, C 3, C 4, C 5 and C 6. The samples in the last group D which were made the control samples were also labelled D 1, D 2, D 3, D 4, D 5 and D 6.The pineapple juice was extracted and the pH was measured. The pineapple juice was divided into three containers labelled A, Band C. Another species of pineapple juice was extracted, the pH was tested and was put into another container D. This was done to evaluate the effect of pH on corrosion.A reasonable flat surface was first obtained from the each of control sample. This was done by using a fairly coarse file. Care was taken to avoid overheating the specimen by rapid grinding methods. Intermediate and fine grinding was then carried out on emery papers of progressive finer grades to remove all the scratches. The grinding was done using different grit paper ranging from No. 220, No. 320, No. 400 to No. 600 papers from coarse to fine. The special hard-wearing cloth was used to cover the polishing disc. A constant drip of water was fed to the rotating pad. Light pressure was used and absolute cleanliness was ensured. The specimen was washed to be free of any adhering polishing compound and care was taken in touching the polished surfaces. The specimen was then etched after it has been polished and ensured to be absolutely clean. The etching was done by being plunged into the etching reagent and agitated vigorously for several seconds. The specimen was then quickly transferred to running water to wash away the etching reagent, and then examined to see the extent to which etching took place. When successfully etched, the surface appeared slightly dull. After etching, the specimen was washed and then dried for a few minutes. The specimen was then examined under a metallurgical microscope.Using the electronic weighing balance, the weights of the machined specimens were measuredFatigue Testing: Each of the control samples in group D (labelled as D 1, D 2, D 3, D 4, D 5 and D 6) was tested using an Avery® fatigue-testing machine. Fully reversed bending stresses were used. The test piece was in form of a cantilever held in a chuck.The load, W, was applied at the ‘free’ end. Thus, the stress-range was 2W with a mean value of zero (Higgins, 1998). To determine the fatigue limit (or endurance limit), a number of test pieces were tested in this way, each at a different value of W, until failure occured. The number of cycles were taken and recorded.Hardness Testing: A flat surface was made on the specimen and then grinding and polishing was done on the surface. The compression attachment was assembled in the machine, one compression die was inserted, and a Brinell ball bolster, the mercury on the hardness-testing machine was set to zero, the polished surface was held against the Brinell ball and the load was applied with the quick-acting handle. The handle was turned until the mercury level reached the 750kg graduation. The handle was left for about 15 second. Having obtained the desired impression, the specimen was removed from the machine and the diameter of the impression was measured with the Brinell reading Microscope. The corresponding Brinell hardness number was obtained.Corrosion Testing: The pH of the squeezed pineapple juice was measured. The pH meter was first standardised by using distilled water. The pH meter was dipped inside the distilled water, shaken until the neutral pH (pH = 7) was gotten. The pH meter was then dipped into pineapple juice and the pH was taken at a point where the pH reading was stable. The pH value was recorded.The pineapple juice was then divided and poured into three different containers labelled A, B and C. Each group of the samples was then dipped into the corresponding container containing the pineapple juice (samples A into container A, Samples B into container B and samples C into container C). Samples A spent 2 weeks in the pineapple juice, samples B spent 4 weeks in the pineapple juice and samples C spent 6 weeks in the pineapple juice.Some tests were done on the samples at intervals. Out of which were the pH testing, weight, microstructure, fatigue testing and hardness testing of each of the samples used in the experiment.The pH of the pineapple juice in the containers was tested once in every week. That is, at an interval of 7 days. The pH meter after been standardised to seven was used in getting the pH of the juice in the containers. The pH of the juice in container A was found for 2 weeks (that is 2 times), that in container B for 4 weeks (i.e. 4 times) and that in container C for 6 weeks (i.e. 6 times).In addition, the weights of the samples A, B, C and D were determined weekly. The average weight of samples in each groups were calculated. These will enable the calculation of the average weight loss, which tells much about effect and rate of corrosion. The measuring scale was used for determining the weight of the sample every week.At the end of every two weeks, the samples, which were removed from the pineapple, were taken to the microscope for microstructural analyses. No grinding or polishing were done to these corroded samples before taking their microstructures. Likewise, the etchant was not used on the surfaces (Higgins, 1998). Since no grinding and polishing was to be done after the samples corrode, it was ensured that the specimen was free from scratches from the onset of the experiment.After the materials have corroded, fatigue tests were carried out. The values of the fatigue properties were recorded. The results from the fatigue test of the control samples were compared to the results gotten for samples A1,2,3,4,5,6 , B1,2,3,4,5,6 and C1,2,3,4,5,6. The graphs plotted for each of the samples were compared. Some properties of the fatigue such as the fatigue life, endurance limit and others were compared.Hardness tests were carried out on the samples after fracturing and comparisons made between the control samples and the corroded samples.The differences between the average weights of the samples at the end of every week were gotten. The graph of the average weight losses was plotted against time. This was used in calculating the corrosion rates.At the end of the experiment, the effects of corrosion on the different properties of ductile iron were taken by comparing the fatigue and hardness properties of ductile iron and determining the weight loss on each of the samples.
3. Results and Discussion
3.1. Results
Weight, weight loss and pHFigure 1 shows the pH of the fluid as corrosion proceeded in each corrosion cell. It shows a decreasing trend into more acidity in each of the cells.Figure 2 shows the average weight taken every week in the three corrosion cells.Figure 3 shows the average weight loss in each corrosion cell every week. This shows corrosion reducing with time because of the no-flowing corrosion fluid environment and passivation due to corrosion products.Figurte 4a shows the microstructure of the control samples D and the microstructures of the corroded samples ( Figure 4 b,c,d) A, B and C respectively in the three corrosion cells after the completion of corrosion in each cell. Nodules of graphite on ferrite background could be clearly observed in the control sample whereas in the corroded samples the severity of corrosion with longevity in the corrosion cell could be observed as well.Figure 5 shows the fatigue curve for the samples after 2 weeks(A), 4 weeks(B) and 6 weeks(C) in the corrosive environment and the control sample(D) that was not placed in any corrosive fluid. It shows a clearly defined endurance limit for the sample in air and still defined after 2 weeks and 4 weeks albeit lowered with increasing exposure to the corrosive environment. After six weeks, there was no more defined endurance limit showing the severity of effect of corrosion on the material microstructure.Figure 6 shows the hardness values of the austempered ductile iron after 2, 4 , 6 weeks in the corrosive fluid compared with the sample in air. It shows little effect on hardness values for the duration under study.
3.2. Discussion of Results
From Figure 1, it was observed that the pH of the pineapple juice decreased with time. That is, the pineapple juice became more acidic as time goes. At the beginning of the experiment, the pH was 5.85 (slightly acidic) and at the end of the experiment, the pH was 5.24 (although still slightly acidic). This pH decrease was gradual and uniform. The decrease in the pH can be explained in association with the exposure of pineapple to air and moisture in the atmosphere and the fermentation of the pineapple juice. Pineapple is known to contain ascorbic acid. This acid is known to be a weak acid and confirmed by this experiment.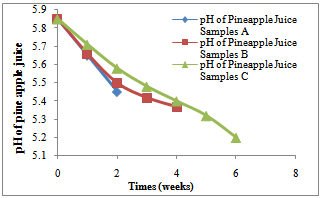 | Figure 1. Variation of pH of the pineapple juice for samples A, B and C with time for the first two weeks, 4 weeks and 6weeks respectively |
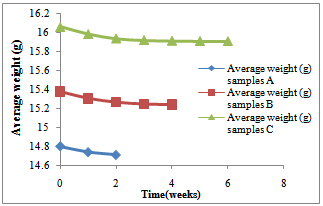 | Figure 2. Variation of average weight (g) for samples A, B and C with time for the first two weeks, 4 weeks and 6weeks respectively |
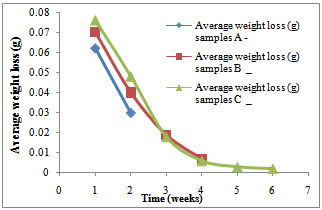 | Figure 3. Variation of average weight loss (g) for samples A, B and C with time for the first two weeks, 4 weeks and 6weeks respectively |
The weight of the samples reduced with time, which means the corrosion still had a little effect on the weight of ductile iron and because of the free graphite content of ductile iron (3% - 4% by weight or about 10% by volume); an insoluble graphitic layer of corrosion products was left behind in the process of corrosion. These corrosion products were very dense, adherent, had considerable strength, and formed a barrier against further corrosion (CISPI, 2008). This is why the corrosion rates decreased with time. This can better be explained in figures 2 and 3 above since corrosion rates is usually directly proportional to the weight lost. This seems to support the statement made by Shreir (1963) that pitting rates tend to decrease with time. It was observed from the shape of the graphs in figures 2 and 3 above that as the time increases, the rate of corrosion reduces until it got to a stage where the slope of the corrosion rate is very small. Therefore, if ductile iron is used in service, although it will corrode at the beginning of its life, its corrosion rate will reduce with time and it will get to a stage where the corrosion of the ductile iron becomes insignificant in a non- flowing fluid environment.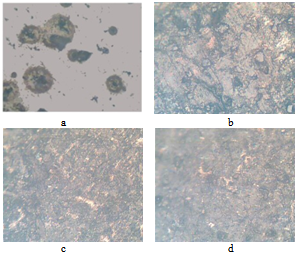 | Figure 4. (a-d) (a)The microstructure of the as-cast ductile iron. Nodules of graphite, pearlite (dark islands) and ferrite (light background). Etchant: Nital 2% (b) The microstructures of ductile iron after corrosion for 2 weeks, (c) The microstructures of ductile iron after corrosion for 4 weeks and (d) The microstructures of ductile iron after corrosion for 6 weeks |
Considering the microstructures of the ductile iron as shown above (Fig.4), the nodules were observed in the samples before they were subjected to the corrosive environments (Fig.4a). These nodules were seen clearly. After 2 weeks of subjecting samples A to the corrosive environments, it was observed that the attack started from the nodules (Fig.4b). The nodules were the first part in the microstructure to be attacked by the pineapple juice. The corrosion products were also observed from the micrograph and this is an implication that the pineapple juice caused the ductile iron to corrode. This corrosion product increased at the end of the fourth week and the attack on the nodules became more significant (Fig.4c). The nodules became smaller as time goes on. Finally, at the end of the sixth week, the corrosion products were much on the surface of the sample (Fig.4d). The nodules were still observed in the ductile iron though the corrosion attack was much on the nodules. At the end of six weeks, the nodules could not be seen clearly, as it was before it was subjected to corrosion. The effect of corrosion was seen on the ferrite at the end of the experiment.Fatigue properties were observed to be seriously affected by corrosion environment (Fig.5). The S-N curve plotted in figure 5 for the control samples D, samples A, samples B and samples C, showed the fatigue limit to be 220MPa, 195MPa, 185MPa and 170Mpa respectively. The fatigue strength decreased as the time in the corrosion fluid increased. This decrease in fatigue strength was as a result of the action of water and the ascorbic acid present in the pineapple juice.The hardness property of the ductile iron subjected to corrosive environment was observed to be insignificant at the end of the six weeks of exposure as seen in Fig.6.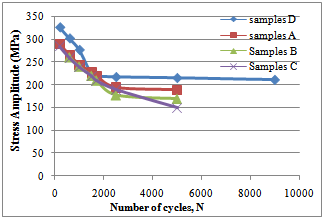 | Figure 5. S-N Curve for the samples A, B C and D |
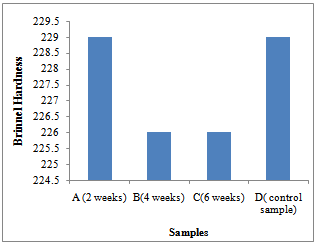 | Figure 6. Hardness values of samples in pineapple juice after 2, 4, 6 an 0 weeks |
4. Conclusions
Austempered ductile iron corroded in slightly acidic medium of pineapple juice. Its rate of corrosion decreased with time. Fatigue properties were significantly affected by the corrosive environment. However, hardness property was not seriously affected. Effect of corrosiove environment need to be factored in during design for the service environment.
References
| [1] | AzoM ( Assessed Aug.2008). ‘Ductile iron’ |
| [2] | http://www.azom.com/Details.asp?ArticleID=787#_Designation |
| [3] | Callister, W. D.(1996) Materials Science and Engineering: an Introduction. 4th edition. John Wiley and Sons, Inc, New york. |
| [4] | CISPI (Assessed July 2008), ‘Corrosion Resistance’. |
| [5] | http://www.cispi.org/cgi-bin/fmsearch/fmsearch.cgi. |
| [6] | Fasoyiro, S.B. Babalola, S.O. and Owosibo 1.T. (2005). ‘Chemical Composition and Sensory Quality ofFruit-Flavoured Roselle (Hibiscus sabdariffa) Drinks’ World Journal of Agricultural Sciences 1 (2): 161-164. |
| [7] | Ferguson, P. and Nicholas D. (1984) Corrosion Australasia , p12 |
| [8] | Fuller, A.G. (1981) "Corrosion resistance of Ductile Iron Pipe", BCIRA Report 1442, |
| [9] | Higgins, R.A. (1998) ‘Engineering Metallurgy’ Sixth ed. Viva Books Private Limited, New Delhi. |
| [10] | Keith, M. ( assessed July,2008) ‘DIS meetings: symposium on Ductile cast iron’ |
| [11] | http://www.corpmeetings.com/register/ductile/dis102008/index.html?p_aid |
| [12] | LaQue, F.L. (1995) “The Corrosion Resistance of Ductile Iron", in “Corrosion of Ductile Corrosion of Ductile Iron Piping”, Edited by Michael J. Szeliga, NACE International. |
| [13] | Mailliard, O. (1985) "Polyurethane Resin Base External Coating for the Protection of Buried Ductile Iron Mains", Proceedings of the 6th International Conference on the Internal and External protection of Pipes, Nice, France, Paper F1. |
| [14] | Shreir, L.L. (1963)“Corrosion”, John Wiley & Sons, Inc., New York, 1963, p3. |
| [15] | Trethewey, K. R. and Chamberlain, J. (1995). Corrosion for Science and Engineering. 2nd ed. Addison Wesley Longman Limited, England. |
 Abstract
 Reference
 Full-Text PDF
 Full-Text HTML