Makhbuba A. Mirsagatova
Institute of Geology and Exploration of Oil and Gas Fields, Tashkent, Uzbekistan
Correspondence to: Makhbuba A. Mirsagatova, Institute of Geology and Exploration of Oil and Gas Fields, Tashkent, Uzbekistan.
| Email: |  |
Copyright © 2026 The Author(s). Published by Scientific & Academic Publishing.
This work is licensed under the Creative Commons Attribution International License (CC BY).
http://creativecommons.org/licenses/by/4.0/

Abstract
This study presents the results of field and laboratory investigations of the gas–condensate system of Well No. 7 at the Muynak field. The gas composition, field yield of stabilized condensate, physicochemical properties, atmospheric and fractional distillation characteristics, hydrocarbon group composition, and temperature dependence of kinematic viscosity were determined. Depending on the well operating conditions, the yield of stabilized condensate ranged from 4.5 to 6.2 cm³/m³, while the potential content of C₅+ hydrocarbons in the reservoir gas ranged from 16.53 to 18.60 g/m³. The density of the stabilized condensate at 20 °C was 0.7772 g/cm³, its average molar mass was 127 g/mol, and the total sulfur content was 0.0013 wt.%. According to the atmospheric distillation data, the initial boiling point was approximately 90 °C; 50 vol.% of the condensate was distilled by 143 °C, 80 vol.% by 190 °C, and 98 vol.% by 345 °C. Fractional distillation showed that the total mass yield of fractions boiling below 200 °C was 82.32 wt.%, while the yield of the residue boiling above 200 °C was 16.18 wt.% and distillation losses amounted to 1.50 wt.%. In the normalized hydrocarbon group composition of the IBP–200 °C fraction, aromatic, naphthenic, and paraffinic hydrocarbons accounted for 15.09, 38.80, and 46.11 wt.%, respectively. As the temperature increased from 0 to 50 °C, the kinematic viscosity decreased from 3.28 to 1.40 mm²/s. The obtained results characterize the investigated sample as a relatively light, low-viscosity stabilized gas condensate of the paraffinic–naphthenic type.
Keywords:
Gas condensate, Muynak field, Component composition, Atmospheric distillation, Fractional distillation, Stabilized gas condensate, Hydrocarbon group composition, Kinematic viscosity, Gas chromatography, Field separation
Cite this paper: Makhbuba A. Mirsagatova, Physicochemical Properties and Temperature-Dependent Viscosity of Gas Condensate from the Muynak Field, International Journal of Materials and Chemistry, Vol. 16 No. 4, 2026, pp. 73-84. doi: 10.5923/j.ijmc.20261604.03.
1. Introduction
Gas condensate is a complex multicomponent hydrocarbon system in which a liquid hydrocarbon phase may form when the reservoir pressure decreases below the dew-point pressure or when the pressure and temperature change during production and surface separation [1]. Its fractional composition and physicochemical properties determine its potential use as a feedstock for the production of fuel and petrochemical fractions [12]. The properties of the produced condensate depend on the composition of the original reservoir fluid, the geological and thermodynamic reservoir conditions, the pressure and temperature of separation, and the procedures used for sample collection and preparation. Condensate dropout below the dew-point pressure may alter fluid mobility in the near-wellbore region and change the composition and recovery of the produced liquid phase. Recent experimental studies have also demonstrated that phase separation in gas–condensate systems may exhibit non-equilibrium behavior, which should be considered when interpreting field and laboratory results [1,3].Gas chromatography is one of the principal methods used to determine the composition of stabilized and unstabilized gas condensates. This method enables the identification of individual hydrocarbons, determination of their compositional and fractional distributions, and quantification of the light and heavy components of the feedstock [4–6]. Modern chromatographic and gas chromatography–mass spectrometry techniques provide a more detailed characterization of complex hydrocarbon mixtures, including compounds differing in molecular weight, structure, and polarity [7]. For a comprehensive characterization of gas condensate, chromatographic data should be evaluated in conjunction with its density, average molar mass, viscosity, boiling-range characteristics, sulfur content, fractional composition, and hydrocarbon group composition [2,4].The multicomponent composition of gas condensate governs its complex phase and rheological behavior during production, field processing, transportation, and storage. In addition to low-molecular-weight normal and branched paraffinic hydrocarbons, gas condensate contains naphthenic and aromatic compounds, while its high-boiling fractions may include heavy paraffinic components. The relative proportions of these hydrocarbon groups affect the density, viscosity, volatility, gelation tendency, and low-temperature stability of the gas–condensate system. It has been established that gas condensates with comparable paraffinic hydrocarbon contents may nevertheless differ substantially in their rheological properties and tendency to form structured systems [8]. Changes in temperature, pressure, and phase ratio during the transportation of gas–condensate fluids may increase hydraulic resistance and disrupt the steady flow of the multicomponent stream [9].One of the most significant operational challenges encountered during the development of gas-condensate fields is the crystallization of paraffinic hydrocarbons. As the temperature decreases, the solubility of high-molecular-weight n-alkanes declines, resulting in the formation of primary wax crystals. Upon further cooling, these crystals grow and aggregate and may eventually form a three-dimensional structure that restricts the mobility of the liquid phase. Consequently, viscosity increases, fluidity deteriorates, and the likelihood of wax deposition on the surfaces of field equipment, pipelines, and storage tanks increases [10].The intensity of wax formation is governed not only by temperature but also by the molecular-weight distribution of the hydrocarbons, the proportions of normal and branched alkanes, and the presence of naphthenic, aromatic, resinous, and asphaltenic components. Studies of wax-containing gas condensates have shown that decreasing temperature affects the composition, quantity, and structure of the precipitated solid phase. High-molecular-weight n-alkanes exhibit a greater tendency toward molecular ordering and the formation of stable crystalline structures, whereas branched hydrocarbons and aromatic compounds may influence both the solubility and growth behavior of wax crystals [10]. Therefore, the low-temperature properties of gas condensate cannot be reliably evaluated solely on the basis of its density or total paraffin content. Such an assessment requires an integrated investigation of the component, fractional, and hydrocarbon group compositions, together with the viscosity–temperature characteristics of the feedstock.The need for the individual investigation of gas condensates is supported by studies conducted at fields in the Central Asian region. Condensates from different fields and productive horizons vary in the distribution of normal and branched alkanes, naphthenic and aromatic compounds, and high-boiling components [11]. Previous work involving the author examined methodological approaches to the integrated field and laboratory investigation, identification, and classification of gas condensate [12]. However, no consistent comparative assessment has previously been conducted for the gas–condensate system of Well No. 7 at the Muynak field that combines field performance parameters, gas composition, atmospheric and fractional distillation data, hydrocarbon group composition, and viscosity–temperature characteristics.The aim of this study was to provide a comprehensive characterization of the gas–condensate system of Well No. 7 at the Muynak field by determining its field performance parameters, gas composition, physicochemical properties of the stabilized condensate, atmospheric and fractional distillation characteristics, hydrocarbon group composition, and temperature dependence of kinematic viscosity.
2. Materials and Methods
2.1. Object of Study
The object of this study was the hydrocarbon gas–liquid system of Well No. 7 at the Muynak field. The wellstream was obtained during testing of the depth intervals 4993.54–4902.10, 4890.66–4787.51, and 4776.25–4685.66 m.The investigated system was a multicomponent mixture of light and heavy hydrocarbons whose phase composition varied depending on pressure, temperature, and separation conditions. Separator gas, degassing gas, and stabilized and unstabilized gas condensates were analyzed to provide a comprehensive characterization of the wellstream. The composition of the reservoir gas was calculated from the separator-gas composition and the amount of separated condensate, taking into account the condensate shrinkage factor.The use of different sample types enabled the gas–liquid system to be characterized at the individual stages of field separation, degassing, and condensate stabilization.
2.2. Field Gas-Condensate Testing
Field gas-condensate tests were conducted sequentially under three steady-state well operating conditions established using chokes with diameters of 8, 10, and 12 mm. The corresponding gas flow rates were 113.593, 139.128, and 156.631 × 10³ m³/day.As the choke diameter increased, the wellhead pressure decreased from 10.54 to 6.67 MPa, while the annular pressure decreased from 21.08 to 16.87 MPa. The separator pressure was maintained at approximately 5.9 MPa under all operating conditions, corresponding to 60 kgf/cm². The separator temperatures for choke diameters of 8, 10, and 12 mm were 24, 27, and 29 °C, respectively.Before measurements and sample collection, the well was operated under each condition until stable pressure, temperature, and gas-flow-rate values were achieved. The wellstream was directed to a field separator, where the gas, hydrocarbon-liquid, and aqueous phases were separated. Wellhead and separator parameters, gas flow rate, volume of separated condensate, and water volume were recorded under each operating condition.The yield of stabilized condensate was determined as the ratio of the condensate volume obtained after degassing and stabilization of the liquid hydrocarbon phase to the gas volume passing through the separator, corrected to the specified reference conditions. The result was expressed as cubic centimetres of condensate per cubic metre of gas. The condensate shrinkage factor was determined as the ratio of the stabilized-condensate volume to the initial volume of unstabilized condensate. Field investigations were conducted in accordance with the general procedures for integrated testing of gas and gas-condensate wells [17].
2.3. Sample Collection and Preparation
Samples were collected after steady-state well operating conditions had been achieved. Separator-gas samples were collected from the gas line downstream of the field separator, degassing-gas samples were collected after gas separation from the unstabilized condensate, and liquid hydrocarbon samples were collected from the separator liquid line. Stabilized condensate was obtained by degassing the unstabilized condensate and allowing it to stand until the visible evolution of dissolved gases had ceased.Spot gas samples were collected in sealed pressurized sampling cylinders. Before the cylinders were filled, the sampling line was purged with the gas being investigated to remove air and residues from the previous sample. Sampling was performed under conditions that prevented condensation and phase separation in the sampling line and cylinder. The procedure complied with GOST 31370–2023, according to which the composition and phase state of a sample must be representative of the gas at the sampling point [15].Unstabilized condensate was collected in sealed metal samplers designed to retain dissolved light hydrocarbons. Stabilized condensate was placed in clean, tightly sealed containers filled with minimum headspace to limit evaporative losses. Each sample was labelled with the well number, test interval, choke diameter, separator pressure and temperature, sample type, and sampling date.During transportation and storage, heating, exposure to direct sunlight, loss of containment, and prolonged contact of the samples with air were avoided. Before laboratory analysis, the stabilized-condensate samples were equilibrated at room temperature and gently mixed until a homogeneous liquid phase was obtained. The unstabilized-condensate samples were prepared in accordance with the requirements for preserving their compositional and fractional characteristics [16].
2.4. Determination of Gas Composition
The gas composition was determined by gas chromatography using a Kristallux-4000M analytical gas chromatograph. Chromatographic separation was performed using a capillary column with an internal diameter of 0.10–0.53 mm and a stationary-phase thickness of 0.25 μm. High-purity helium was used as the carrier gas. The carrier-gas flow rate and pressure were controlled automatically according to the specified analytical conditions.Detector-signal acquisition, integration of chromatographic peak areas, component identification, and concentration calculations were performed using the Khromos software package. Gas chromatographic analysis was conducted in accordance with GOST 31371.7–2020 [13]. The molar fractions of methane, ethane, propane, isobutane, n-butane, isopentane, and n-pentane, as well as nitrogen, carbon dioxide, and C₆+ hydrocarbons, were determined. Hydrocarbons heavier than n-pentane were treated as a lumped C₆+ pseudocomponent.The components were identified by their retention times using certified calibration gas mixtures. Quantitative determination was based on the areas of the corresponding chromatographic peaks, taking into account the calibration factors. The methane molar fraction was calculated as the difference between 100% and the sum of the molar fractions of all other components. The results were normalized so that the sum of the molar fractions of all components was equal to 100%.The total molar fraction of C₅+ hydrocarbons was calculated as follows: | (1) |
where — Xi-C5, Xn-C5, XC6+ are the molar fractions of the corresponding components, %.The mass concentration of C₅+ hydrocarbons in the gas was calculated using their molar fraction, the average molar mass of the pseudocomponent, and the molar volume of the gas under the specified standard conditions. The hydrogen sulfide and carbon dioxide contents were additionally monitored under field conditions using an absorption system. The hydrogen sulfide content of the gas was assessed in accordance with O‘z DSt 948:2016.
2.5. Determination of the Physicochemical Properties of the Condensate
The physicochemical properties were determined for a stabilized-condensate sample obtained from the wellstream produced from the investigated intervals of Well No. 7. Before the measurements, the sample was homogenized while preventing the loss of light components.The condensate density was determined at 20 °C using the hydrometer method. Measurements were performed after thermal equilibrium had been established between the sample and the measuring cylinder. The densities of the fractions obtained by distillation were also reported at 20 °C.The average molar mass of the condensate was calculated from the results of its compositional and fractional analysis. The refractive index was measured by refractometry at a constant temperature.Kinematic viscosity was determined by the capillary method at temperatures of 0, 10, 20, 30, 40, and 50 °C. The sample was thermostatically equilibrated at each specified temperature, after which its flow time through a calibrated capillary was measured. Kinematic viscosity was calculated as the product of the flow time and the viscometer constant and was expressed in mm²/s.The total sulfur content was determined instrumentally in accordance with the laboratory procedure employed. The corrosive effect of the condensate was additionally evaluated using the copper-strip corrosion test, and its specific heat of combustion was determined. All properties were reported under the corresponding standard or laboratory-specified measurement conditions.
2.6. Atmospheric and Fractional Distillation of the Stabilized Condensate
The distillation characteristics of the stabilized gas condensate were determined in two independent laboratory experiments: atmospheric distillation and fractional distillation. The results were reported separately because the atmospheric-distillation yields were expressed in volume percent, whereas the fractional-distillation yields were expressed in mass percent.Atmospheric distillation was performed using 100 cm³ of the homogenized stabilized condensate. The initial boiling point, the temperatures corresponding to recoveries of 10, 20, 30, 40, 50, 60, 70, 80, 90, and 98 vol.% of the sample, and the final boiling point were recorded. The volumes of the distillate, residue, and process losses were recorded separately.Fractional distillation was performed by sequentially collecting the fractions boiling below 60, 60–95, 95–122, 122–150, and 150–200 °C. The portion of the condensate that was not distilled below 200 °C was recorded as the residue boiling above 200 °C. The yields of the individual fractions, residue, and losses were expressed as percentages of the initial sample mass. The overall mass balance of the fractional-distillation experiment was taken as 100%.The two experiments were compared while accounting for the different bases used to report their results. Atmospheric-distillation data expressed in volume percent were not used to calculate directly the mass yields of the narrow boiling fractions.
2.7. Determination of the Hydrocarbon Group Composition
The hydrocarbon group composition of the 95–122, 122–150, and 150–200 °C fractions was determined using the aniline-point method, followed by calculation of the aromatic, naphthenic, and paraffinic hydrocarbon contents. The method is based on differences in the solubility of the hydrocarbon groups in aniline and on the change in the aniline point after removal of the aromatic components.The aromatic hydrocarbon content was determined first. The naphthenic and paraffinic hydrocarbon contents were calculated from the physicochemical properties of the original and dearomatized fractions, taking into account their boiling ranges. For each fraction, the sum of the mass fractions of the paraffinic, naphthenic, and aromatic hydrocarbons was taken as 100%. The hydrocarbon group composition of the fractions boiling below 95 °C was not determined separately. When calculating the mass balance of the broad IBP–200 °C fraction, the combined mass fraction of these light fractions, equal to 2.83%, was conditionally assigned to paraffinic hydrocarbons. This assignment constituted a calculation assumption and was taken into account when interpreting the normalized hydrocarbon group composition.The mass fraction of each hydrocarbon group in the original condensate was calculated as follows: | (2) |
where ωi,k — is the mass fraction of the corresponding hydrocarbon group in the original condensate, %; Yf — is the mass yield of the investigated fraction, %; and ωi,f — is the mass fraction of the corresponding hydrocarbon group in that fraction, %.The overall hydrocarbon group composition of the broad IBP–200 °C fraction was determined by summing the values calculated for the individual narrow fractions. The chemical type of the condensate was established from the relative proportions of paraffinic (P), naphthenic (N), and aromatic (A) hydrocarbons. The predominance of paraffinic hydrocarbons together with a substantial naphthenic content and a P > N > A relationship was used as the criterion for classifying the condensate as paraffinic–naphthenic.
2.8. Data Processing and Presentation
The results of the field and laboratory investigations were reported using the adopted units of measurement. Pressure was expressed in MPa, temperature in °C, gas flow rate in 10³ m³/day, condensate and water yields in cm³/m³, density in g/cm³, kinematic viscosity in mm²/s, and the mass concentration of C₅+ components in g/m³.For the periodic chromatographic analysis of spot samples, two consecutive measurements were performed. The arithmetic mean of the two values was accepted as the result provided that the difference between them did not exceed the specified repeatability limit. The component-analysis results were normalized to 100%. This data-processing procedure complied with GOST 31371.7–2020 [13].Chromatograms were processed using the Khromos software package. The software was used for detector-signal acquisition, determination of component retention times, integration of chromatographic peak areas, construction of calibration curves, and calculation of component molar fractions.The average molar mass, gas density, and other calculated physicochemical properties were determined from the molar composition. The calculations were performed for dry gas under the adopted standard conditions and included components with molar fractions of at least 0.005%. Density, relative density, and calorific value were calculated from the component composition in accordance with GOST 31369–2021 [14].The reservoir-gas composition was calculated by material balance using the separator-gas composition, the amount of stabilized condensate recovered, and the condensate shrinkage factor. Chromatograms were processed using the standard software supplied with the gas chromatograph, whereas tabulated calculations were performed using spreadsheet software.
3. Results
3.1. Results of Field Gas-Condensate Testing
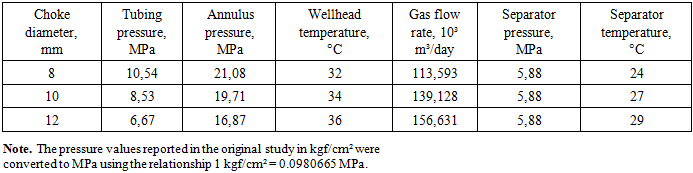
Field gas-condensate tests of Well No. 7 at the Muynak field were conducted under three steady-state operating conditions corresponding to choke diameters of 8, 10, and 12 mm. The wellstream obtained during the combined testing of the depth intervals 4993.54–4902.10, 4890.66–4787.51, and 4776.25–4685.66 m was investigated. The operating parameters and results of gas–liquid separation are presented in Tables 1 and 2.Table 1. Operating parameters of field gas-condensate tests of Well No. 7 at the Muynak field
 |
| |
|
Table 2. Gas–liquid separation performance under the investigated operating conditions
 |
| |
|
As the choke diameter increased from 8 to 12 mm, the tubing pressure decreased from 10.54 to 6.67 MPa, while the annulus pressure decreased from 21.08 to 16.87 MPa. At the same time, the gas flow rate increased from 113.593 to 156.631 × 10³ m³/day. The separator pressure was maintained at 5.88 MPa under all operating conditions, whereas the separator temperature increased from 24 to 29 °C.The specific yield of stabilized condensate decreased progressively from 6.2 cm³/m³ at a choke diameter of 8 mm to 5.3 cm³/m³ at 10 mm and 4.5 cm³/m³ at 12 mm. Thus, the maximum specific yield of stabilized condensate was recorded when the well was operated through the 8 mm choke. Over the same range of operating conditions, the water yield increased from 198 to 208 cm³/m³.The condensate density varied only slightly under the investigated operating conditions, decreasing from 0.781 to 0.779 g/cm³. The water density remained constant at 1.01 g/cm³. The condensate shrinkage factor decreased from 0.86 to 0.82 as the choke diameter increased.Thus, increasing the choke diameter resulted in a higher gas flow rate but a lower specific yield of stabilized condensate and a lower condensate shrinkage factor. Operation with the 8 mm choke provided the maximum stabilized-condensate yield per unit volume of gas, whereas the maximum gas flow rate was obtained with the 12 mm choke.
3.2. Gas Composition and C₅+ Hydrocarbon Content
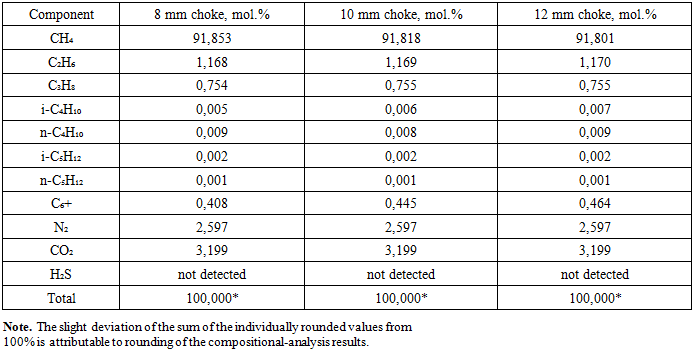
The calculated composition of the reservoir gas, determined from the chromatographic analysis of the separator and degassing gases together with the field measurement data, is presented in Table 3. The gas composition varied only slightly among the three well operating conditions.Table 3. Calculated composition of the reservoir gas from Well No. 7 at the Muynak field
 |
| |
|
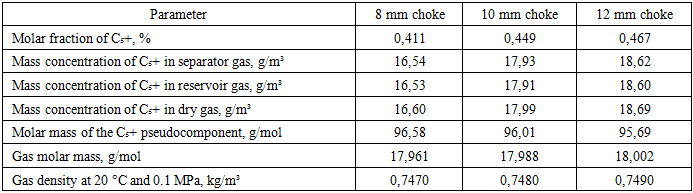
Methane was the principal component of the gas, with a molar fraction ranging from 91.801 to 91.853%. The ethane content ranged from 1.168 to 1.170%, while the propane content ranged from 0.754 to 0.755%. The combined molar fraction of isobutane and n-butane was 0.014–0.016%, and the combined isopentane and n-pentane content was approximately 0.003%.The molar fraction of the C₆+ fraction increased from 0.408% at a choke diameter of 8 mm to 0.445% at 10 mm and 0.464% at 12 mm. Accordingly, the total molar fraction of C₅+ hydrocarbons increased from 0.411 to 0.467%.The nitrogen content was 2.597% under all operating conditions, while the carbon dioxide content was 3.199%. Hydrogen sulfide was not detected using the analytical methods employed.The calculated parameters characterizing the C₅+ hydrocarbon content of the separator, reservoir, and dry gases, together with the molar mass and density of the gas, are presented in Table 4.Table 4. C₅+ hydrocarbon content and calculated gas properties
 |
| |
|
As shown in Table 4, the mass concentrations of C₅+ hydrocarbons in the separator gas were 16.54, 17.93, and 18.62 g/m³ at choke diameters of 8, 10, and 12 mm, respectively. The corresponding values in the reservoir gas were 16.53, 17.91, and 18.60 g/m³, while those in the dry gas were 16.60, 17.99, and 18.69 g/m³.The maximum potential C₅+ hydrocarbon content was observed when the well was operated through the 12 mm choke: 18.60 g/m³ in the reservoir gas and 18.69 g/m³ in the dry gas.According to Table 4, the molar mass of the C₅+ pseudocomponent decreased from 96.58 to 95.69 g/mol. The gas molar mass ranged from 17.961 to 18.002 g/mol, while its density at 20 °C and 0.1 MPa ranged from 0.7470 to 0.7490 kg/m³.The chromatogram of the degassing gas released from the unstabilized condensate obtained during the investigation of Well No. 7 at the Muynak field is shown in Figure 1.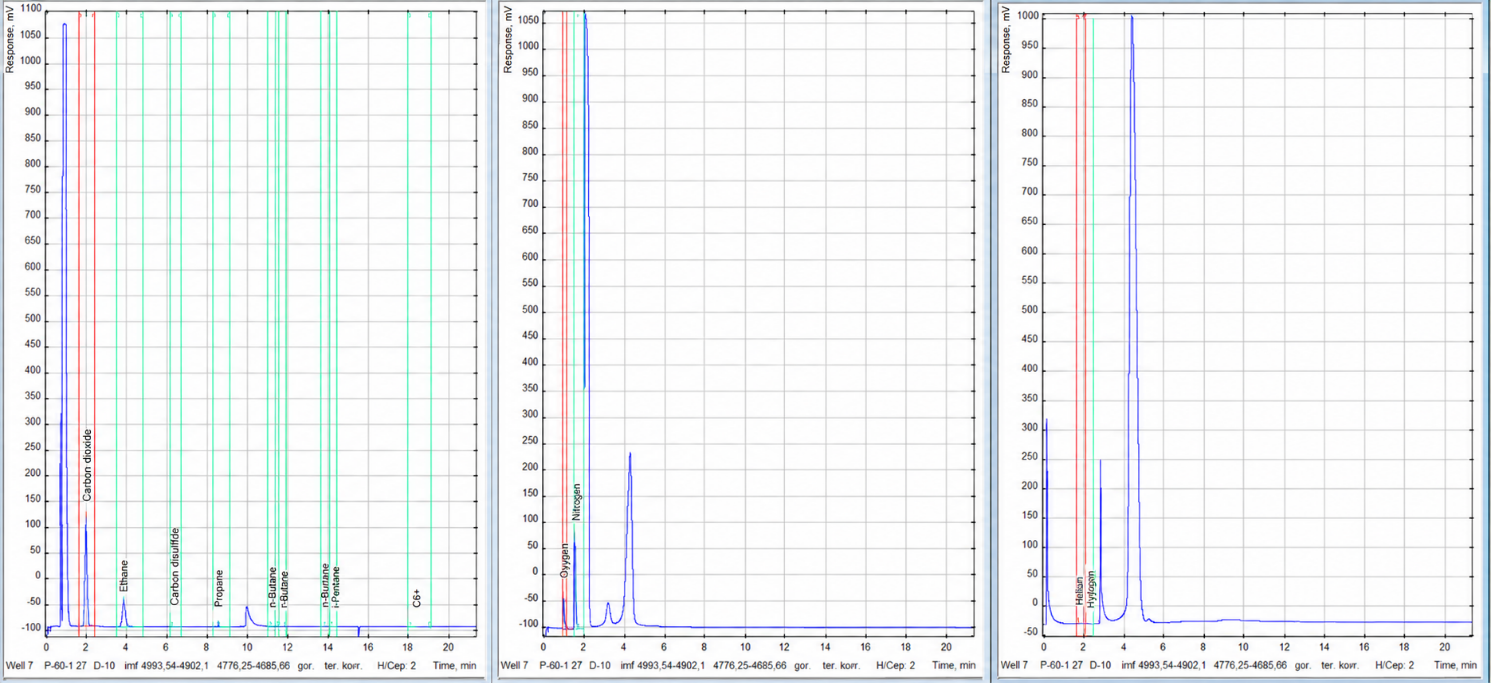 | Figure 1. Chromatogram of the degassing gas released from the unstabilized gas condensate of Well No. 7 at the Muynak field at a separator pressure of 5.88 MPa, a temperature of 27 °C, and a choke diameter of 10 mm |
The degassing-gas chromatogram shows the light hydrocarbons released from the unstabilized condensate as the pressure decreased. This confirms that a portion of the dissolved light components remained in the unstabilized condensate after field separation. Chromatogram processing, retention-time determination, and peak-area integration were performed using the Khromos GC-1000 software package.
3.3. Physicochemical Properties of the Stabilized Condensate
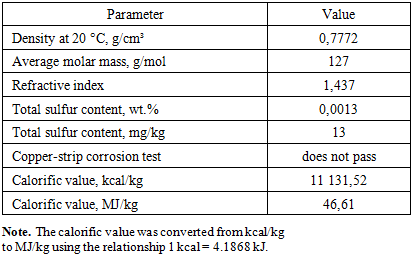
The physicochemical properties of the stabilized gas condensate obtained from the combined wellstream of the investigated intervals of Well No. 7 at the Muynak field are presented in Table 5.Table 5. Physicochemical properties of the stabilized gas condensate from Well No. 7 at the Muynak field
 |
| |
|
The density of the stabilized condensate at 20 °C was 0.7772 g/cm³. This value should be distinguished from the field condensate-density values presented in Table 2, which were 0.781, 0.780, and 0.779 g/cm³ under the individual well operating conditions. Table 5 characterizes a prepared stabilized-condensate sample at a specified laboratory temperature, whereas the values in Table 2 refer to the condensate obtained directly under field conditions.The average molar mass of the stabilized condensate was 127 g/mol, and its refractive index was 1.437. The total sulfur content was 0.0013 wt.%, corresponding to 13 mg/kg.According to the copper-strip corrosion test, the sample was reported as “does not pass.” Considering the low total sulfur content, this result requires experimental verification by repeat testing and determination of the active sulfur-containing compounds.The calorific value of the stabilized condensate was 11,131.52 kcal/kg, corresponding to approximately 46.61 MJ/kg.
3.4. Temperature Dependence of Kinematic Viscosity
The kinematic viscosity of the stabilized gas condensate measured over the temperature range from 0 to 50 °C is presented in Figure 2. A systematic decrease in the viscosity of the investigated sample was observed with increasing temperature. The kinematic viscosity was 3.28 mm²/s at 0 °C, 2.22 mm²/s at 10 °C, 1.70 mm²/s at 20 °C, 1.60 mm²/s at 30 °C, 1.50 mm²/s at 40 °C, and 1.40 mm²/s at 50 °C.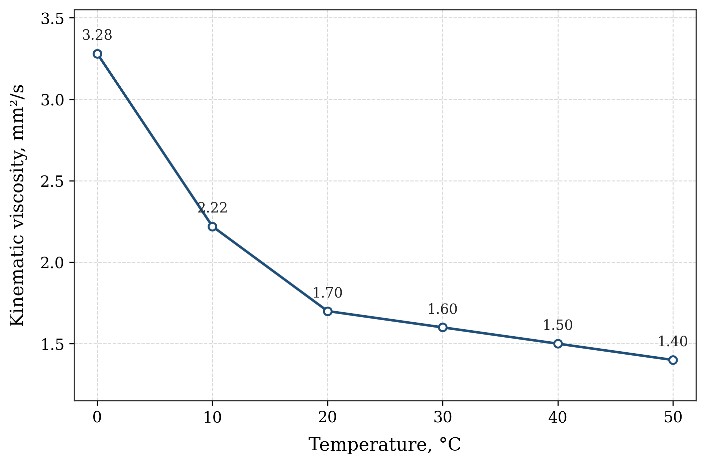 | Figure 2. Temperature dependence of the kinematic viscosity of the stabilized gas condensate from the Muynak field |
As shown in Figure 2, the most pronounced decrease in kinematic viscosity occurred between 0 and 20 °C, over which the value decreased from 3.28 to 1.70 mm²/s, corresponding to approximately 48.2%. With a further increase in temperature from 20 to 50 °C, the change in viscosity became less pronounced, decreasing from 1.70 to 1.40 mm²/s.Overall, as the temperature increased from 0 to 50 °C, the kinematic viscosity of the condensate decreased by approximately 57.3%. This behavior can be attributed to the increased molecular mobility and weaker intermolecular interactions within the hydrocarbon system upon heating. The viscosity changed smoothly, with no abrupt deviations or anomalous regions observed over the investigated temperature range.The obtained values characterize the stabilized condensate from the Muynak field as a low-viscosity hydrocarbon liquid. However, the noticeable increase in viscosity with decreasing temperature confirms that temperature conditions should be considered during condensate storage and transportation, particularly during the cold season.
3.5. Atmospheric Distillation of the Stabilized Condensate
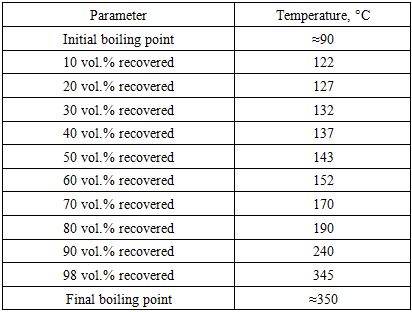
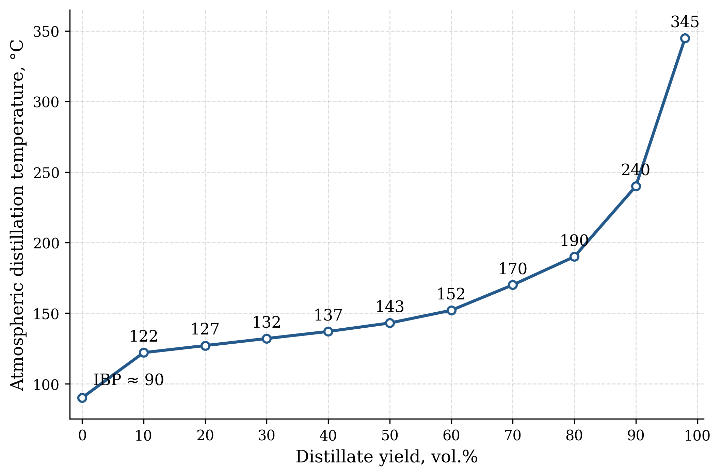
The results of atmospheric distillation of the stabilized gas condensate are presented in Table 6 and Figure 3. The initial boiling point of the investigated sample was approximately 90 °C. The temperature increased progressively with increasing distillate recovery: 50 vol.% of the condensate was distilled by 143 °C, 80 vol.% by 190 °C, 90 vol.% by 240 °C, and 98 vol.% by 345 °C.Table 6. Atmospheric-distillation data for the stabilized gas condensate
 |
| |
|
 | Figure 3. Atmospheric-distillation curve of the stabilized gas condensate from the Muynak field |
The atmospheric-distillation curve indicates that the stabilized condensate consists predominantly of light- and medium-boiling components. At 190 °C, 80 vol.% of the sample was distilled, while at 200 °C the calculated recovery was approximately 82 vol.%. A further increase in temperature was associated with the distillation of a relatively small high-boiling portion of the sample. Therefore, the final boiling point of approximately 350 °C does not imply that most of the condensate evaporates at this temperature.From the initial 100 mL sample, 98 mL of distillate was recovered. The residue volume was 1 mL, and the losses amounted to 1 mL; thus, the overall volumetric material balance of the atmospheric-distillation experiment was 100%.
3.6. Density of the Stabilized-Condensate Fractions
The variation in the density of the stabilized gas-condensate fractions with distillate recovery is presented in Figure 4. The density of the first 10 vol.% distillate fraction was 0.7205 g/cm³. As the distillate recovery increased to 50 vol.%, the density increased to 0.7539 g/cm³; at 80 vol.%, it reached 0.7818 g/cm³; and at 98 vol.%, it was 0.7994 g/cm³.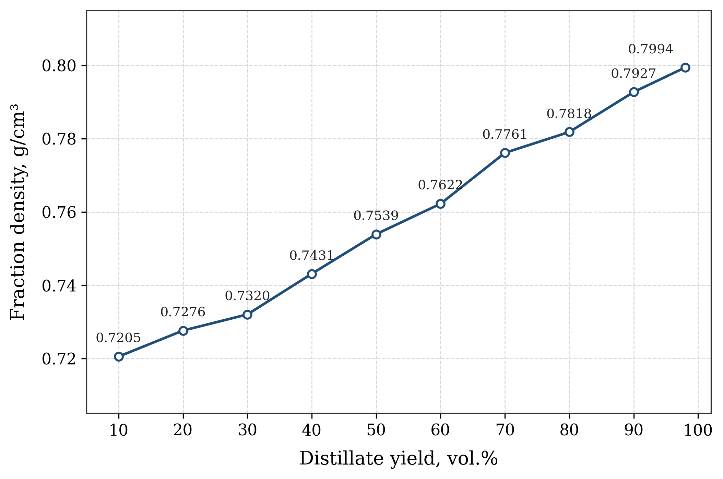 | Figure 4. Dependence of the density of the stabilized gas-condensate fractions from the Muynak field on distillate recovery |
As shown in Figure 4, increasing distillate recovery was accompanied by a progressive increase in the density of the collected fractions. Over the investigated range, the density increased from 0.7205 to 0.7994 g/cm³. The absolute increase was 0.0789 g/cm³, corresponding to approximately 10.9% relative to the density of the first collected fraction.The density of the residue after completion of the distillation was 0.8387 g/cm³, exceeding that of the final distilled fraction. This trend is consistent with the atmospheric-distillation results and indicates the progressive accumulation of heavier hydrocarbons in the later fractions and the distillation residue.
3.7. Fractional Distillation and Hydrocarbon Group Composition
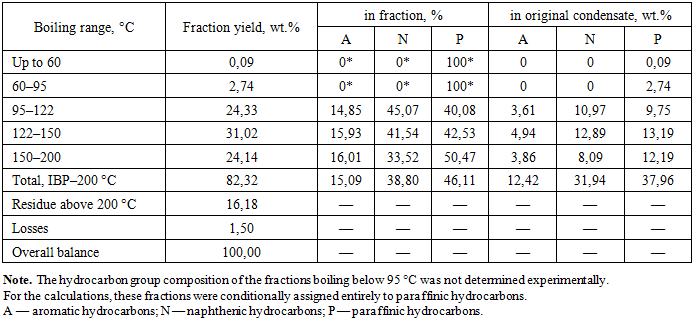
The mass yields of the narrow boiling fractions and their hydrocarbon group compositions are presented in Table 7. The total mass yield of the fractions boiling below 200 °C was 82.32 wt.%. The yield of the residue boiling above 200 °C was 16.18 wt.%, while losses amounted to 1.50 wt.%; thus, the overall mass balance of the experiment was 100%.Table 7. Mass yields and hydrocarbon group composition of the stabilized gas-condensate fractions
 |
| |
|
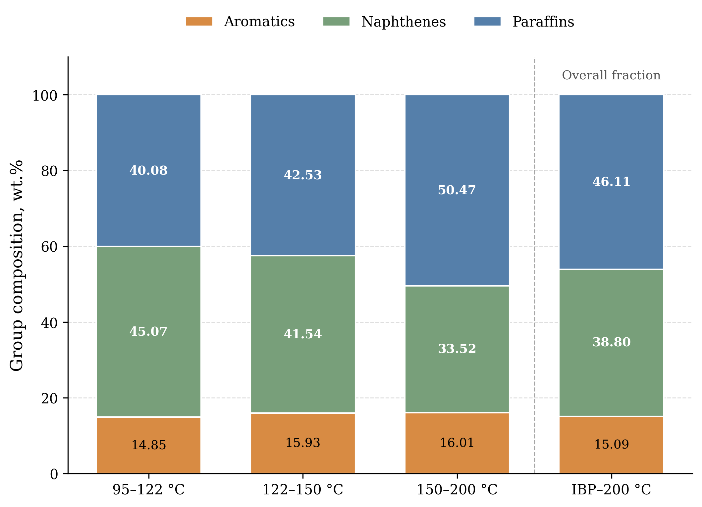 | Figure 5. Hydrocarbon group composition of the narrow fractions and normalized composition of the broad IBP–200 °C fraction |
With increasing boiling temperature, the aromatic hydrocarbon content varied only slightly, from 14.85 to 16.01%. The proportion of naphthenic hydrocarbons decreased from 45.07% in the 95–122 °C fraction to 33.52% in the 150–200 °C fraction, whereas the paraffinic hydrocarbon content increased from 40.08 to 50.47%.On an original-condensate basis, the broad IBP–200 °C fraction contained 12.42 wt.% aromatic, 31.94 wt.% naphthenic, and 37.96 wt.% paraffinic hydrocarbons. After normalization of the composition of this fraction to 100%, the corresponding values were 15.09, 38.80, and 46.11%, respectively. The P > N > A relationship supports the classification of the investigated stabilized condensate as paraffinic–naphthenic. This conclusion takes into account the calculated assignment of 2.83 wt.% of the light fractions to paraffinic hydrocarbons.
4. Discussion
4.1. Effect of Well Operating Conditions on Field Performance
Changes in choke diameter had opposing effects on the gas and liquid components of the wellstream. As the choke diameter increased from 8 to 12 mm, the gas flow rate increased from 113.593 to 156.631×10³ m³/day. At the same time, the wellhead pressure decreased from 10.54 to 6.67 MPa, the annulus pressure decreased from 21.08 to 16.87 MPa, and the specific yield of stabilized condensate decreased from 6.2 to 4.5 cm³/m³.The decrease in the specific yield of stabilized condensate did not result in a proportional reduction in its daily production because the volume of produced gas increased simultaneously. The calculated daily volume of stabilized condensate was approximately 0.704 m³/day for the 8 mm choke, 0.737 m³/day for the 10 mm choke, and 0.705 m³/day for the 12 mm choke. Therefore, among the investigated operating conditions, the maximum calculated daily recovery of stabilized condensate was achieved using the 10 mm choke.The separator pressure remained nearly constant under all operating conditions at approximately 5.9 MPa, whereas the separator temperature increased from 24 to 29 °C. An increase in temperature promotes the retention of some hydrocarbons in the gas phase and may reduce the amount of liquid condensate separated. An additional contributing factor could have been the higher velocity of the gas–liquid mixture through the separation equipment, which may have promoted the entrainment of fine condensate droplets by the gas stream.This interpretation is consistent with the increase in the molar fraction of C₅+ hydrocarbons in the gas from 0.411 to 0.467% and their mass concentration in the separator gas from 16.54 to 18.62 g/m³. Thus, with increasing choke diameter, a larger proportion of the heavy hydrocarbons remained in the gas phase, which was accompanied by a decrease in the specific yield of stabilized condensate. Similar relationships between component composition, liquid-phase yield, and separation conditions have been reported in field studies of gas–condensate systems [1,3,12].From an operational perspective, the maximum calculated daily recovery of stabilized condensate obtained with the 10 mm choke can be considered a favorable result among the three investigated operating conditions. With the 8 mm choke, the specific condensate yield was the highest (6.2 cm³/m³); however, the lower gas flow rate limited the calculated daily condensate recovery to approximately 0.704 m³/day. Increasing the choke diameter to 12 mm raised the gas flow rate but reduced the specific condensate yield to 4.5 cm³/m³, resulting in a daily condensate recovery of approximately 0.705 m³/day. The 10 mm choke provided an intermediate gas flow rate while maintaining a sufficiently high specific condensate yield, which resulted in the maximum calculated recovery of 0.737 m³/day. Therefore, this operating condition provided the most favorable balance between gas production and liquid hydrocarbon recovery. Nevertheless, the observed advantage was relatively small, and the 10 mm choke should be regarded as the most favorable condition only within the three short-term tests performed rather than as a definitive long-term operating optimum.
4.2. Relationship Between Gas Composition and Properties
The limited variation in the concentrations of the principal light gas components can be explained by the phase behavior of these hydrocarbons under the investigated conditions. All three tests were performed in the same well and productive interval; therefore, the original reservoir fluid composition remained essentially unchanged. Moreover, the separator pressure was maintained at approximately 5.9 MPa, while the separator temperature varied only from 24 to 29 °C. Owing to their high volatility, methane, ethane, and propane remained predominantly in the gas phase, and the changes in choke diameter did not cause their substantial redistribution between the gas and liquid phases. The methane molar fraction changed only from 91.853 to 91.801%, while the ethane content changed from 1.168 to 1.170% and the propane content from 0.754 to 0.755%. These small variations indicate that the operating conditions primarily affected the phase distribution of the heavier C₅+ hydrocarbons rather than the composition of the light gas fraction [12].A more pronounced dependence on the operating conditions was observed for the C₅+ hydrocarbons. As the choke diameter increased from 8 to 12 mm, the molar fraction of C₅+ increased from 0.411 to 0.467%, while their mass concentration in the separator gas increased from 16.54 to 18.62 g/m³. Given the nearly unchanged concentrations of the light components, this increase does not indicate a change in the composition of the original reservoir fluid. Instead, it primarily reflects the redistribution of heavy hydrocarbons between the gas and liquid phases as a function of temperature, pressure, and separation conditions [1,3,12].The degassing-gas chromatogram shown in Figure 1 confirms that a portion of the dissolved light hydrocarbons remained in the unstabilized condensate after field separation. As the pressure subsequently decreased, these components were released into the gas phase. Quantitative characterization of the gas composition should be based on the integrated areas of the chromatographic peaks rather than solely on their visual heights.Hydrogen sulfide was not detected using the analytical methods employed, indicating that its concentration was below the detection limit of the applied procedure. This is a favorable characteristic of the investigated gas in terms of gas processing and the reduction of hydrogen-sulfide corrosion. However, the carbon dioxide content was 3.199 mol.%. At a separator pressure of approximately 5.9 MPa, this corresponds to an estimated CO₂ partial pressure of about 0.19 MPa. Carbon dioxide itself is not corrosive in a completely dry gas system. However, when free or condensed water is present, CO₂ dissolves in the aqueous phase and forms carbonic acid, thereby decreasing the pH and promoting the electrochemical dissolution of carbon steel. The actual corrosion rate also depends on the water content, CO₂ partial pressure, temperature, flow conditions, dissolved salts, and the formation of protective iron carbonate layers. Since the water content and corrosion rate were not determined in the present study, the measured CO₂ concentration indicates a potential corrosion risk rather than confirming active corrosion. Therefore, effective gas dehydration and corrosion monitoring should be considered during gas processing and transportation [18].The stabilized condensate was characterized by a low total sulfur content of 0.0013 wt.%, corresponding to approximately 13 mg/kg. However, the copper-strip corrosion test result reported in the laboratory record as “does not pass” is not fully consistent with the low total sulfur content. This discrepancy may be related to trace concentrations of active sulfur-containing compounds capable of affecting the copper strip even when their total concentration is low. To verify this result, the test should be repeated, and the individual sulfur-containing compounds should be determined by gas chromatography with selective detection [4–6].Thus, the technological properties of the investigated gas–condensate system should be evaluated by considering not only its predominant methane content but also the distribution of C₅+ hydrocarbons between the phases, the presence of carbon dioxide, and the possible occurrence of trace corrosive compounds.
4.3. Relationships Among Physicochemical, Distillation, and Hydrocarbon Group Characteristics
The density of the stabilized condensate at 20 °C of 0.7772 g/cm³, its average molar mass of 127 g/mol, and its refractive index of 1.437 characterize the investigated sample as a relatively light hydrocarbon feedstock. This conclusion is consistent with both the atmospheric-distillation curve and the mass yields of the narrow boiling fractions. According to the atmospheric-distillation data, 50 vol.% of the stabilized condensate was distilled by 143 °C and 80 vol.% by 190 °C, while the calculated distillate recovery at 200 °C was approximately 82 vol.%. In the independent fractional-distillation experiment, the total mass yield of the IBP–200 °C fractions was 82.32 wt.%. Despite the different volumetric and mass bases used to report the results, both experiments consistently demonstrate that most of the investigated condensate boils below 200 °C. In the fractional-distillation experiment, the residue boiling above 200 °C accounted for 16.18 wt.%, while losses amounted to 1.50 wt.%.The increase in the density of the collected fractions from 0.7205 to 0.7994 g/cm³ with increasing distillate recovery, as shown in Figure 4, indicates the progressive accumulation of components with higher molar masses and boiling points in the later fractions. The residue density was 0.8387 g/cm³, further confirming the concentration of heavier hydrocarbons in the undistilled portion of the condensate.The hydrocarbon group composition also varied with the boiling temperature of the fractions. As shown in Figure 5, the paraffinic hydrocarbon content of the 95–122, 122–150, and 150–200 °C fractions increased from 40.08 to 42.53 and 50.47%, respectively, whereas the proportion of naphthenic compounds decreased from 45.07 to 41.54 and 33.52%. The aromatic hydrocarbon content varied only slightly, remaining within the range of 14.85–16.01%. Thus, the higher-boiling fractions investigated were characterized by a higher proportion of paraffinic hydrocarbons.In the normalized composition of the broad IBP–200 °C fraction, paraffinic hydrocarbons accounted for 46.11%, naphthenic hydrocarbons for 38.80%, and aromatic hydrocarbons for 15.09%. The P > N > A relationship allows the stabilized condensate from Well No. 7 at the Muynak field to be classified as paraffinic–naphthenic. However, the assignment of 2.83 wt.% of the condensate to paraffinic hydrocarbons represents a calculation assumption because the hydrocarbon group composition of this portion was not determined separately. The predominance of paraffinic hydrocarbons and the presence of a heavy residue may indicate the occurrence of high-molecular-weight n-alkanes capable of crystallizing upon cooling. However, the hydrocarbon group-analysis method employed does not distinguish between normal and branched paraffinic hydrocarbons. Therefore, the obtained results cannot be used to quantify the solid-wax content or determine the onset temperature of wax crystallization or the pour point of the condensate.Further investigations are required to evaluate the wax-formation tendency of the condensate. These should include high-temperature gas chromatography, determination of the solid-wax content, differential scanning calorimetry, and low-temperature rheological testing [8,10].
4.4. Temperature Dependence of Viscosity and Low-Temperature Properties
The temperature dependence of kinematic viscosity shown in Figure 2 is consistent with the general behavior of light hydrocarbon systems. As the temperature increased from 0 to 50 °C, the kinematic viscosity of the stabilized condensate decreased from 3.28 to 1.40 mm²/s, corresponding to a reduction of approximately 57.3%.The most pronounced change was observed between 0 and 20 °C, over which the viscosity decreased from 3.28 to 1.70 mm²/s. With a further increase in temperature from 20 to 50 °C, the change was less substantial, with the viscosity decreasing from 1.70 to 1.40 mm²/s. This behavior is attributable to weaker intermolecular interactions and increased mobility of hydrocarbon molecules upon heating.The relatively low kinematic viscosity of 3.28 mm²/s at 0 °C can be explained by the predominance of light- and medium-boiling hydrocarbons in the investigated condensate. Its density at 20 °C was 0.7772 g/cm³, and 82.32 wt.% of the sample consisted of fractions boiling below 200 °C. These compositional characteristics indicate a comparatively low resistance to molecular motion and, consequently, a relatively low viscosity. Moreover, the smooth viscosity–temperature curve and the absence of a sharp increase in viscosity at 0 °C suggest that a continuous three-dimensional network of wax crystals had not formed under the investigated conditions. Therefore, the condensate remained a mobile, low-viscosity liquid at the lowest temperature studied. However, this result does not exclude the possible precipitation of wax or a substantial increase in viscosity at temperatures below 0 °C [8,10].However, these measurements cannot be used to determine the pour point or the limiting temperature at which the condensate retains its fluidity because no tests were conducted at subzero temperatures. Furthermore, the onset temperature of wax crystallization, solid-wax content, dynamic viscosity, and yield stress were not determined in this study.During cooling, the solubility of long-chain n-alkanes in the liquid hydrocarbon phase decreases. Higher-molecular-weight n-alkanes generally crystallize first because of their lower solubility, whereas shorter-chain homologues remain dissolved to lower temperatures. An increase in the total concentration of n-alkanes produces a larger number of crystal nuclei and increases the probability that individual crystals will aggregate into a continuous three-dimensional network. The molecular-weight distribution is also important because a broad range of n-alkanes causes crystallization to occur over a wider temperature interval and affects the size, shape, and interaction of the resulting crystals. Once an interconnected crystalline structure is formed, resistance to flow increases sharply and the condensate may lose its mobility. Naphthenic and aromatic hydrocarbons can modify this process by maintaining the fluidity of the liquid phase and interfering with crystal aggregation [8,10]. However, the concentrations and molecular-weight distribution of individual n-alkanes were not determined in the present study; therefore, this mechanism is provided as a general explanation and not as direct evidence of wax formation in the investigated condensate.The presence of a heavy residue in the investigated condensate and the increasing proportion of paraffinic hydrocarbons in the higher-boiling fractions indicate the need for further investigation of its behavior at subzero temperatures. However, these characteristics alone do not confirm wax precipitation and cannot be used to predict a specific temperature at which fluidity would be lost.Thus, the established temperature dependence of kinematic viscosity characterizes the rheological behavior of the stabilized condensate only within the range of 0–50 °C. Additional measurements at subzero temperatures are required to substantiate the conditions for its winter storage and transportation, including direct determination of the pour point, onset temperature of wax crystallization, and rheological properties of the resulting dispersed structure.
5. Conclusions
A comprehensive field and laboratory investigation of the gas–condensate system of Well No. 7 at the Muynak field was conducted. As the choke diameter increased from 8 to 12 mm, the gas flow rate increased from 113.593 to 156.631 × 10³ m³/day, whereas the specific yield of stabilized condensate decreased from 6.2 to 4.5 cm³/m³. The maximum potential C₅+ hydrocarbon content was determined for operation with the 12 mm choke: 18.60 g/m³ in the reservoir gas and 18.69 g/m³ in the dry gas.Methane was the principal gas component, with a molar fraction ranging from 91.801 to 91.853%. The CO₂ content was 3.199%, while hydrogen sulfide was not detected using the analytical methods employed. The density of the stabilized condensate at 20 °C was 0.7772 g/cm³, its average molar mass was 127 g/mol, and its total sulfur content was 0.0013 wt.%. As the temperature increased from 0 to 50 °C, the kinematic viscosity decreased from 3.28 to 1.40 mm²/s.According to the atmospheric-distillation data, the initial boiling point of the stabilized condensate was approximately 90 °C; 50 vol.% of the sample was distilled by 143 °C, 80 vol.% by 190 °C, and 98 vol.% by 345 °C. In the fractional-distillation experiment, the mass yield of the IBP–200 °C fractions was 82.32 wt.%, while the residue boiling above 200 °C accounted for 16.18 wt.% and losses amounted to 1.50 wt.%. In the normalized hydrocarbon group composition of the IBP–200 °C fraction, aromatic, naphthenic, and paraffinic hydrocarbons accounted for 15.09, 38.80, and 46.11%, respectively, corresponding to a paraffinic–naphthenic condensate type.The obtained data may be used to select appropriate conditions for the separation, transportation, and downstream processing of the stabilized gas condensate. Further investigations are required to evaluate its behavior at subzero temperatures, including determination of the onset temperature of wax crystallization, pour point, n-alkane content, and low-temperature rheological properties.
References
| [1] | Dorhjie D.B., Pereponov D., Aminev T., Gimazov A., Khamidullin D., Kuporosov D., Tarkhov M., Rykov A., Filippov I., Mukhina E., Shilov E., Grishin P., Cheremisin A. A microfluidic and numerical analysis of non-equilibrium phase behavior of gas condensates. Scientific Reports, 2024, 14, 9500. https://doi.org/10.1038/s41598-024-59972-x. |
| [2] | Riaz M., Kontogeorgis G.M., Stenby E.H., Yan W., Haugum T., Christensen K.O., Løkken T.V., Solbraa E. Measurement of liquid–liquid equilibria for condensate + glycol and condensate + glycol + water systems. Journal of Chemical & Engineering Data, 2011, 56 (12), 4342–4351. https://doi.org/10.1021/je200158c. |
| [3] | Al-Meshari A.A., Kokal S.L., Jenden P.D., Halpern H.I. An investigation of PVT effects on geochemical fingerprinting of condensates from gas reservoirs. SPE Reservoir Evaluation & Engineering, 2009, 12 (1), 88–95. https://doi.org/10.2118/108441-PA. |
| [4] | Arystanbekova S.A., Volynskii A.B., Prudnikov I.A. Sovremennye metody gazokhromatograficheskogo analiza nestabil'nogo gazovogo kondensata [Modern methods of gas chromatographic analysis of unstable gas condensate]. Moscow, Gazprom VNIIGAZ Publ., 2011, 180 p. (In Russ.). |
| [5] | Arystanbekova S.A., Skryabina A.E. Opredelenie polnogo sostava prob nestabil'nogo gazovogo kondensata metodami gazovoi khromatografii [Determination of the complete composition of unstable gas condensate samples by gas chromatography]. Neftyanoe khozyaistvo, 2006, (7), 98–100. (In Russ.). |
| [6] | Arystanbekova S.A., Volynskii A.B., Skryabina A.E. Opredelenie khimicheskogo sostava nestabil'nogo gazovogo kondensata metodom gazovoi khromatografii: novye NTD [Determination of the chemical composition of unstable gas condensate by gas chromatography: new regulatory and technical documentation]. Tekhnologii nefti i gaza, 2008, (4), 46–52. (In Russ.). |
| [7] | Kondyli A., Schrader W. High-resolution GC/MS studies of a light crude oil fraction. Journal of Mass Spectrometry, 2019, 54 (1), 47–54. https://doi.org/10.1002/jms.4306. |
| [8] | Wylde J.J., Majid A.A.A. Multi-component waxy model oil design to mimic rheologically complex gas condensate liquids. Geoenergy Science and Engineering, 2025, 245, 213516. https://doi.org/10.1016/j.geoen.2024.213516. |
| [9] | Ismayilov G.G., Iskanderov E.Kh., Fataliyev V.M., Gurbanov A.G., Ismayilova F.B. Some aspects for improving the efficiency of the development of gas condensate resources in marine conditions. SOCAR Proceedings, 2023, (4), 99–105. https://doi.org/10.5510/OGP20230400922. |
| [10] | Cao L., Ren Y., Wu H., Pan Z., Li Z., Zhang C. Temperature-dependent wax precipitation characteristics in gas condensates: composition, aggregation, and crystallization patterns. ACS Omega, 2025, 10 (5), 4809–4826. https://doi.org/10.1021/acsomega.4c10044. |
| [11] | Seithaziyev Y.Sh. Geochemical studies of condensate, gas and core samples derived from gas-condensate fields in the Moynkum Sag (Kazakhstan). News of the National Academy of Sciences of the Republic of Kazakhstan, Series of Geology and Technical Sciences, 2023, 3 (459), 242–261. https://doi.org/10.32014/2023.2518-170X.312. |
| [12] | Mirsagatova M.A., Sodikova M.R., Abdumavlyanova M.K. Kompleksnye promyslovye i laboratornye issledovaniya gazovogo kondensata (sostav, fiziko-khimicheskie svoistva) i podkhody k ego identifikatsii i klassifikatsii [Comprehensive field and laboratory studies of gas condensate (composition, physicochemical properties) and approaches to its identification and classification]. Universum: tekhnicheskie nauki, 2025, 10 (139). (In Russ.). https://doi.org/10.32743/UniTech.2025.139.10.21103. |
| [13] | GOST 31371.7–2020. Gaz prirodnyi. Opredelenie sostava metodom gazovoi khromatografii s otsenkoi neopredelennosti. Chast' 7. Metodika izmerenii molyarnoi doli komponentov [Natural gas. Determination of composition by gas chromatography with uncertainty assessment. Part 7. Measurement procedure for the mole fraction of components]. (In Russ.). |
| [14] | GOST 31369–2021. Gaz prirodnyi. Vychislenie teploty sgoraniya, plotnosti, otnositel'noi plotnosti i chisla Wobbe na osnove komponentnogo sostava [Natural gas. Calculation of calorific value, density, relative density and Wobbe index from composition]. (In Russ.). |
| [15] | GOST 31370–2023. Gaz prirodnyi. Rukovodstvo po otboru prob [Natural gas. Sampling guidelines]. (In Russ.). |
| [16] | MM 51-00159093-004-04. Nestabil'nye zhidkie uglevodorody. Metody opredeleniya komponentno-fraktsionnogo sostava [Unstable liquid hydrocarbons. Methods for determining component and fractional composition]. Moscow, IRTs Gazprom Publ., 2003, 65 p. (In Russ.). |
| [17] | Zotov G.A., Aliev Z.S., eds. Instruktsiya po kompleksnomu issledovaniyu gazovykh i gazokondensatnykh skvazhin [Instructions for comprehensive testing of gas and gas-condensate wells]. Moscow, Nedra Publ., 1980, 301 p. (In Russ.). |
| [18] | Jones M., Owen J., de Boer G., Woollam R.C., Folena M.C., Farhat H., Barker R. Numerical exploration of a fully mechanistic mathematical model of aqueous CO₂ corrosion in steel pipelines. Corrosion Science, 2024, 236, 112235. https://doi.org/10.1016/j.corsci.2024.112235. |


 Abstract
 Reference
 Full-Text PDF
 Full-text HTML