-
Paper Information
- Paper Submission
-
Journal Information
- About This Journal
- Editorial Board
- Current Issue
- Archive
- Author Guidelines
- Contact Us
International Journal of Materials and Chemistry
p-ISSN: 2166-5346 e-ISSN: 2166-5354
2023; 13(2): 19-22
doi:10.5923/j.ijmc.20231302.01
Received: Sep. 3, 2023; Accepted: Sep. 23, 2023; Published: Sep. 28, 2023

The Enrichment of Quartz Sands of the Khiva Deposit for Glass Production
 Abstract
 Reference
 Full-Text PDF
 Full-text HTML
Dinara B. Buranova1, Mirjalil Y. Yunusov2, Zabibulla K. Babaev3, Sherzod R. Kurambaev3, Sherzod K. Matchanov4
1Independent Researcher, Urgench State University, Urgench, Uzbekistan
2Doctor of Technical Sciences, Professor, Tashkent Institute of Chemical Technology, Tashkent, Uzbekistan
3Doctor of Technical Sciences, Associate Professor, Urgench State University, Urgench, Uzbekistan
4Candidate of Technical Sciences, Associate Professor, Urgench State University, Urgench, Uzbekistan
Copyright © 2023 The Author(s). Published by Scientific & Academic Publishing.
This work is licensed under the Creative Commons Attribution International License (CC BY).
http://creativecommons.org/licenses/by/4.0/

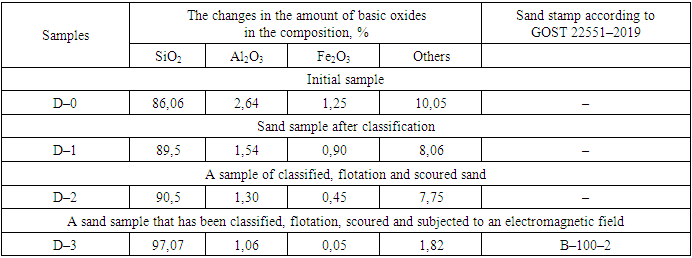
The article provides information on determining the suitability of the Khiva mine for use in glass production by enrichment of feldspar quartz sand. Based on complex physical and chemical analysis, it was found that quartz sand mainly belongs to quartz and feldspar, as well as a small amount of hematite, chlorite and calcite minerals. It was found that the chemical composition of quartz sand consists of 86–87% silicon oxide, but iron oxide, which has a negative effect on glass production, is up to 1.25%. Based on the selected enrichment technology, reduction of iron oxide from 1.25 to 0.05% and other harmful additives from 10.05% to 1.82% was achieved.
Keywords: Glass production, Quartz sands, Khiva deposit, Minerals, Feldspar, Enrichment, X–ray phase analysis, Iron oxide, Glass, Silicate materials, Silicon oxide
Cite this paper: Dinara B. Buranova, Mirjalil Y. Yunusov, Zabibulla K. Babaev, Sherzod R. Kurambaev, Sherzod K. Matchanov, The Enrichment of Quartz Sands of the Khiva Deposit for Glass Production, International Journal of Materials and Chemistry, Vol. 13 No. 2, 2023, pp. 19-22. doi: 10.5923/j.ijmc.20231302.01.
1. Introduction
- In the production of inorganic materials on a global scale, great attention is being paid to the development of technologies for the enrichment of raw and man–made resources and the production of low–cost, high–quality products. The quality indicators of the used raw materials are considered to be the main factor, and it is noted that the reserves of high quality raw materials are decreasing, and the quality indicators of the new mining raw materials do not meet the standard requirements. The glass products produced on the basis of raw materials are becoming one of the most important industries worldwide and determine the development of a number of production sectors. Based on this, it is important to produce glass products based on concentrates obtained from inorganic and man–made raw materials using enrichment technologies [1,2].However the large numbers of siliceous raw materials, which are considered important for the production of silicate materials, there are few mines that use them without enrichment for the production of glass and glass products [3]. The quality of glass and ceramic products depends on the chemical and mineralogical properties of the raw materials used [4]. One of the main problems of processing silicate materials is the high consumption of energy in the processing of raw materials.Currently, a number of researches are being carried out in the world on enrichment of low–quality raw materials and man–made waste, acceleration of technological processes in the production of inorganic materials, and improvement of their properties and characteristics. In this regard, in the production of glass products, special attention is paid to the production of glass with high transparency, the development of new effective compositions, and the introduction of innovative technologies that save energy and resources [5,6].This article describes the research on the enrichment of quartz sands of the “Khiva” deposit which is located in Khorezm province of the Republic of Uzbekistan, as well as their use in the silicate industry.
2. Material and Methods
- The quartz sands of the “Khiva” deposit, located in the Khorezm region, were studied as a research object.IR transmission spectra of glass samples were obtained at room temperature in the wavelength ranges of 4000–400 cm–1 and 4000–300 cm–1 using a SPECORD M–80 (Carl Zeiss JENA) spectrophotometer with a spectral resolution of 4 cm–1. The research analysis is based on the principle of two–beam measurement with the determination of the electrical zero point and double interruption [7].To identify the phase composition of the component used and the obtained samples, X–ray phase analysis was used on a LABX XRD–6100 SHIMADZU diffractometer using CuKα radiation (β–filter–Ni, wavelength 1.5418 Å, current mode and tube voltage 30 mA, 30 kW) [8].The granulometric, chemical, chemical–mineralogical composition of raw materials was determined by physical–chemical analysis [9-11].
3. Results and Discussions
- “Khiva” mine, in the upper part of the earth’s surface, the depth is from 2.0–3.0 m to 20.7 m, in some places the height of the piles reaches 10–25 m. Mineral deposits in the mine belong to the group of eolian sands and are located in the form of mine plast. The color of the sand grains is light yellow and it belongs to quartz sand according to its composition [12-13] (Figure 1).
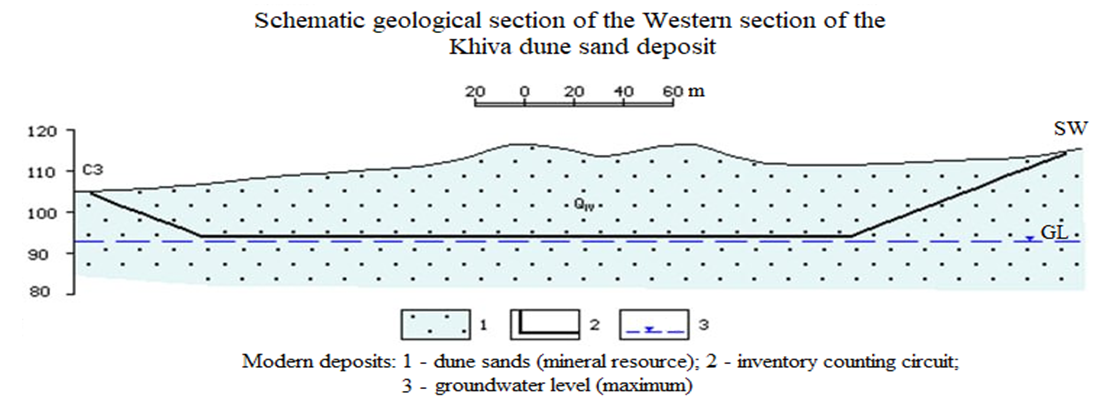 | Figure 1. The scheme of the geological section of the western division of the Khiva deposit |
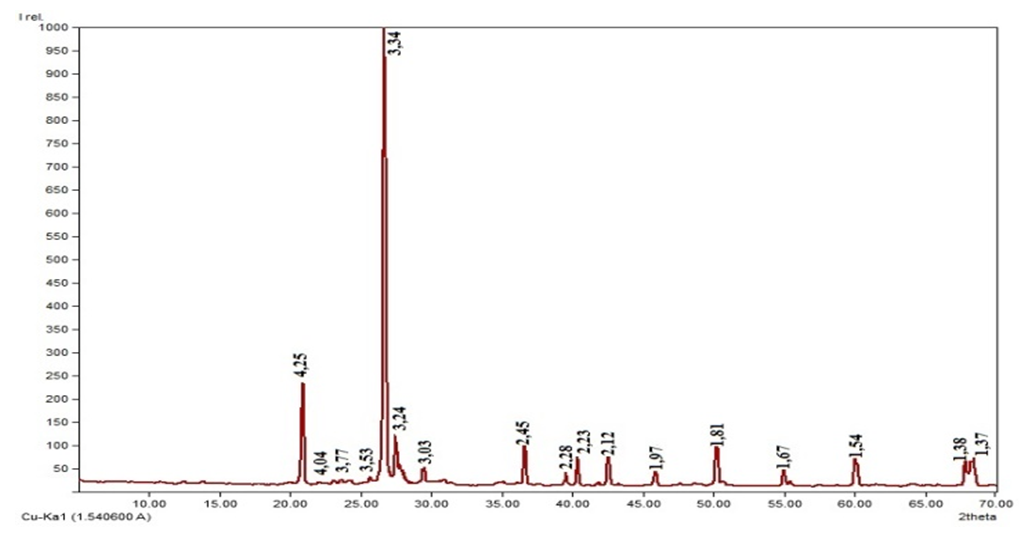
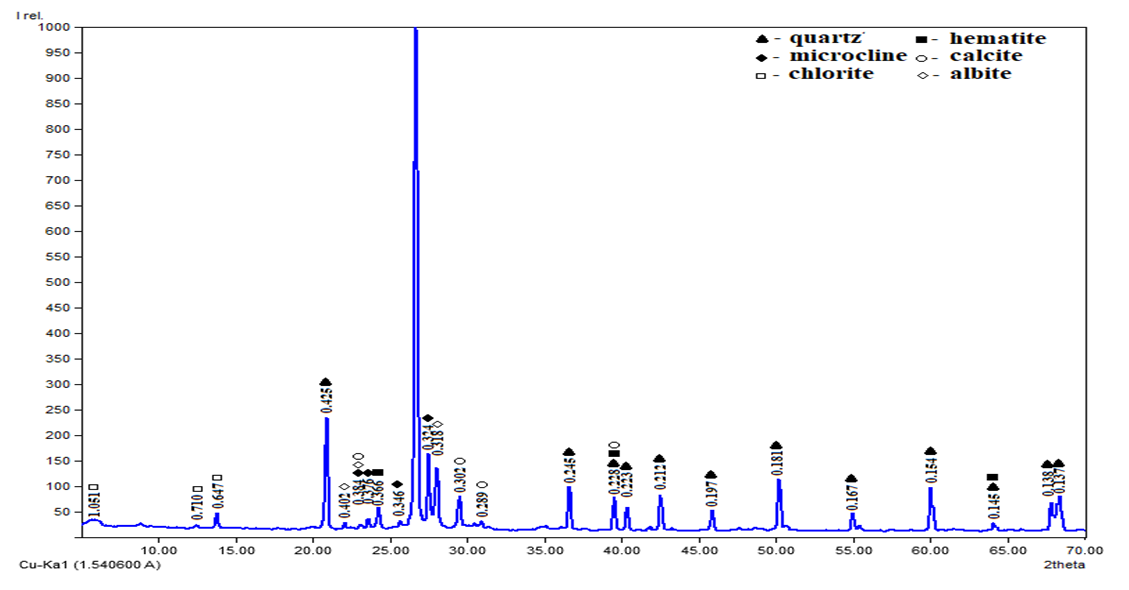 | Figure 2. X–ray of quartz sand sample |
|
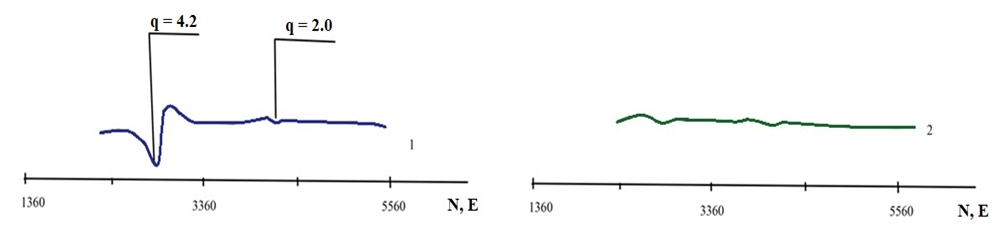 | Figure 3. The image of EPR analysis of Khiva quartz feldspar sands. 1–unenriched sample; 2–sample after enrichment |
 | Figure 4. X–ray image of an enriched sample quartz sand of Khiva deposit |
4. Conclusions
- The quartz sand of the “Khiva” mine was subjected to a comprehensive physical and chemical analysis. Based on complex physical and chemical analysis, it was found that quartz sand mainly belongs to quartz and feldspar, as well as a small amount of hematite, chlorite and calcite minerals. It was found that the chemical composition of quartz sand consists of 86–87% silicon oxide, but iron oxide, which has a negative effect on glass production, is up to 1.25%. Based on the selected enrichment technology, reduction of iron oxide from 1.25 to 0.05% and other harmful additives from 10.05% to 1.82% was achieved.