Mutembei Peterson Kugeria, Fidelis Ngugi
Faculty of Science, Engineering and Technology Department of Basic Sciences, Tharaka University College, Marimanti, Kenya
Correspondence to: Mutembei Peterson Kugeria, Faculty of Science, Engineering and Technology Department of Basic Sciences, Tharaka University College, Marimanti, Kenya.
| Email: |  |
Copyright © 2022 The Author(s). Published by Scientific & Academic Publishing.
This work is licensed under the Creative Commons Attribution International License (CC BY).
http://creativecommons.org/licenses/by/4.0/

Abstract
The mineral data from Kenya shows several deposits of low grade titanium yet the country has been importing titanium products. Some regions of Tharaka Nithi County contain titanium minerals. These deposits have never been earmarked for extraction because the common extraction methods known are expensive. Titanium minerals are known to occur mixed with iron minerals. The objective of this study was concentrating titanium from low grade ores using carbonized biomass. The samples were obtained from the selected deposits in Maragwa location in Tharaka Nithi County. The samples were obtained from 30 cm depth and labelled level A and further one-meter depth and labelled level B. The samples were then dried at 105°C for 9 hours and later ground to 60.0 meshes (250 microns) using a ball mill. Titanium in the ore was concentrated using carbonized biomass at 800-900°C. The analyses of the minerals for the mineralogical and chemical composition were done using X-ray Diffraction Spectroscopy (XRD), X-ray Fluorescence Spectroscopy (XRF) and Atomic Absorption Spectroscopy (AAS). The mean composition of rutile was found to be 0.77±0.16% before concentration and 1.84±0.24 after concentration. The results show that rutile improved with a range of about 1.0 to 2.5% in all the deposits.
Keywords:
Rutile, Ilmenite, Titanium concentration, Biomass
Cite this paper: Mutembei Peterson Kugeria, Fidelis Ngugi, Concentration of Rutile Using Thermally Heated Mixture of Low Grade Ilmenite Ores with Biomass from Maragwa Location in Tharaka Nithi County Kenya, International Journal of Materials and Chemistry, Vol. 12 No. 2, 2022, pp. 21-26. doi: 10.5923/j.ijmc.20221202.01.
1. Introduction
Several studies have been done on concentration of titanium from laterites using biomass [1]. The same technique was done on laterites from Mbeu, Gitong’o, Gitara Kianderi and Kaharate, in Kenya [2]. From the study, the mixture of laterite and biomass in the ratio of 1:10 respectively at temperatures from 500 to 800°C increased rutile in the tailing with 5 percent. Further studies on concentration of titanium have also been done [3]. Studies done on increasing magnetic susceptibility of ilmenite and further separation from the minerals has been done [4,5]. Extraction of rutile from ilmenite by reduction process using carbon has also been done at temperature range of 730 and 800°C [6]. Further studies on ilmenite containing laterites have been done at temperatures ranging 800 to 1200°C, [7]. From their studies, it was found that ilmenite was able to be reduced to rutile and metallic iron. The concentration of ilmenite from Teri sand in Tamil Nadu in India has been done using the spiral method [8]. The ilmenite concentrate obtained was found to be 99.1 percent with 3.5 percent recovery. From these studies, concentration of iron was done on laterites and beach sand rich in iron minerals. Investigation on low grade ilmenite ores with no relationship with lateritic material or beach sand has not been done using biomass. In this study concentration of rutile was done from low grade ilmenite ores using biomass. The minerals investigated had no relation with lateritic materials or beach sand. The study was done at temperature range of 800-900°C.
2. Methodology
2.1. Biomass and Sample Collection and Treatment
The process of biomass preparation, sample collection and treatment was done according to [9].
2.2. Sample Preparation for XRD and AAS Analyses
The methods of sample preparation using XRD and XRF were done according to [1].
2.3. Concentration of Titanium Using Biomass
2.3.1. Optimization Studies
The concentration chamber was assembled in accordance with [10]. A mixture of 5.0 g of the ground mineral sample and 1.0 g of ground biomass was put into the concentration chamber. The chamber was then placed on the heat exchanger. The mixture was then heated at a temperature range of 800–900°C for two hours while monitoring the temperature using a thermocouple. A current of air was allowed to pass through from an air cylinder at a flow rate of 0.5 - 0.7 cm3 per second. After two hours, the samples were allowed to cool to the room temperature. The samples were then spread on a wooden flat surface. A permanent horseshoe magnet of about 92 milliTeslas was wrapped using a polythene paper. The magnet was passed over the sample to pick the magnetic portion as per [1] and [9]. Both the tailing and the concentrate were analyzed for chemical constituent and mineralogy using AAS and XRD. The experiment was repeated by varying the mass of the mineral sample from 5.0 g to 50.0 g at an interval of 5.0 g. The mass of the biomass was maintained at 1.0 g. The flow rate and the temperature were held constant at 0.5 - 0.7 cm3 per second and 800 - 900°C respectively.
3. Results
3.1. Chemical Composition of the Ores
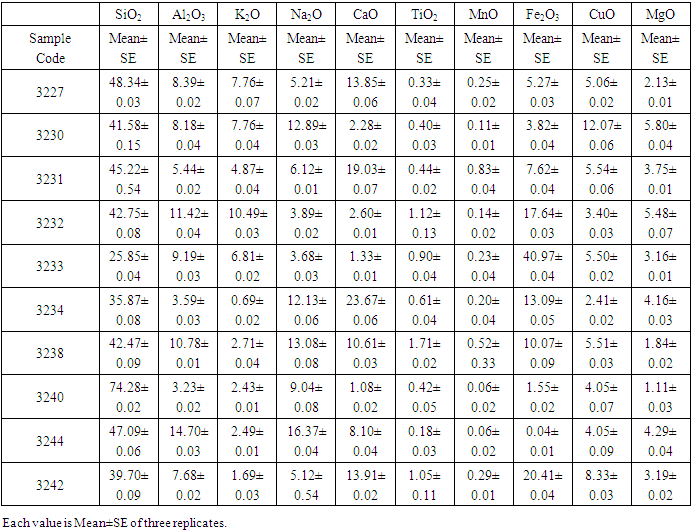
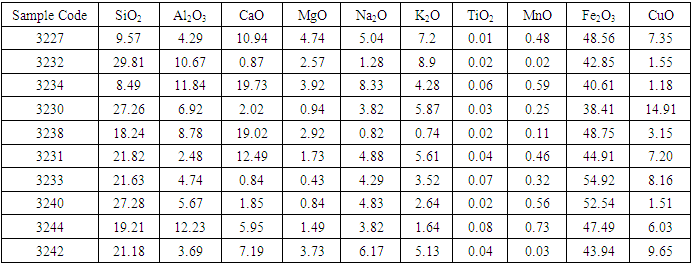
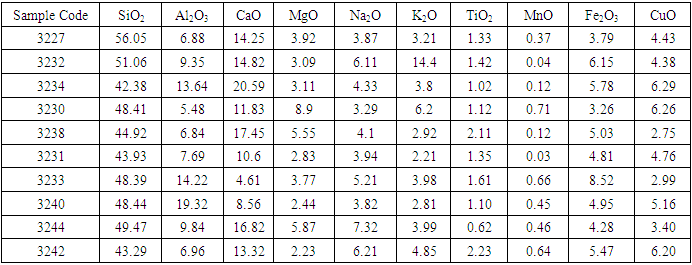
Table 1 below gives the mean chemical composition for each of the ore deposits from Maragwa Location.Table 1. The Elemental Analysis
 |
| |
|
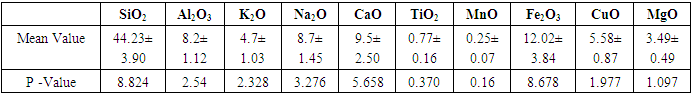
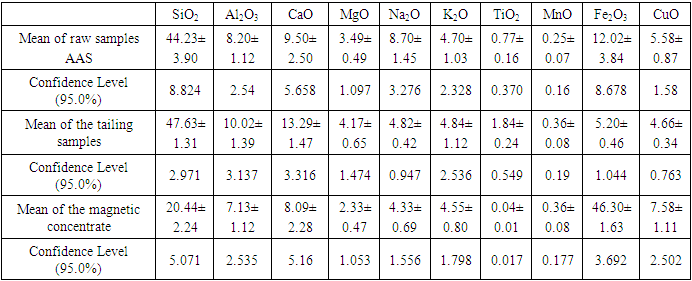
Table 2. The Mean Statistical Analysis of Minerals at 95.0 % Confidence Level, n = 30
 |
| |
|
The titanium oxide was found to have a mean of 0.77±0.16. Other mineral found include silica, calcium oxide, alumina, and iron oxides. From the p – values, there was no significant difference in the mineralogical composition of all mineral deposits (p>0.05). The deposit 3244 had the lowest rutile values with 0.18±0.03 and deposit 3238 had the highest value with 1.71±0.02. In all deposits silica composition was the highest impurity with a mean of 44.23±3.90, followed by iron oxide minerals with 12.02±3.84.
3.2. Optimization Values for Concentration of Titanium Using Biomass
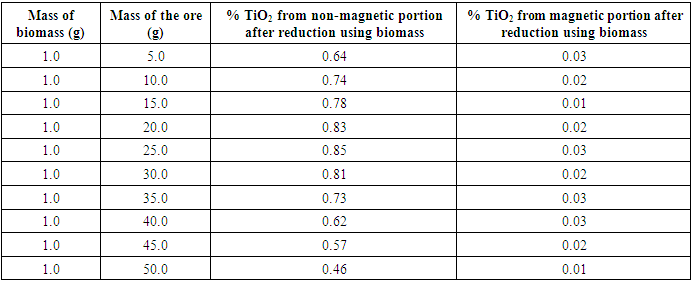
Tables 3 give the optimized results of the reduction of sample 3231 using biomass. The mineral sample used for the reduction had a mean of 0.44± 0.02 TiO2.Table 3. Percentage Rutile in Magnetic and Non-Magnetic Samples Obtained after Reduction of the Ore Using Biomass
 |
| |
|
The results show that 25.0 g of the mineral and 1.0 g of the biomass gave the highest concentration of titanium. The results obtained had 0.85 percent TiO2 in non-magnetic concentrate and 0.03 percent in magnetic concentrate. Further increase of the mineral ore at the constant mass of biomass decreases TiO2 content in the non-magnetic concentrate. The analysis of the magnetic concentrate contained low values of TiO2 ranging between 0.01 to 0.03 percent TiO2. There was no noted relationship between TiO2 in magnetic concentrate, the mass of the biomass used and mass of the ore used. The results showed that the optimum amount of ore sufficiently reduced by 1.0 g of biomass to be 25.0 g of the ore. Combustion of biomass under oxygen controlled condition produces syngas that reduces the ore components. When low amounts of ore are used, it is expected that the excess syngas would give excess energy and thus other reaction products than the desired would be formed. On the other hand, when excess ore is used, the syngas energy would not be sufficient for the desired reaction products.
3.3. Rutile Concentration Using the Optimised Values
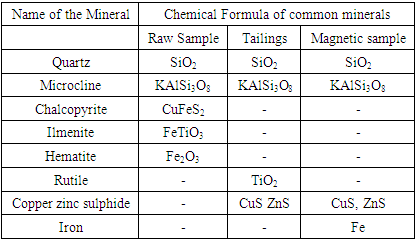
Table 4 shows the summary of rutile in raw sample, magnetic and non-magnetic concentrate. Figures 1, 2, and 3, shows the mineralogical transformation after reduction.Table 4. Common Minerals in the Raw Sample, Magnetic and Non-Magnetic Sample
 |
| |
|
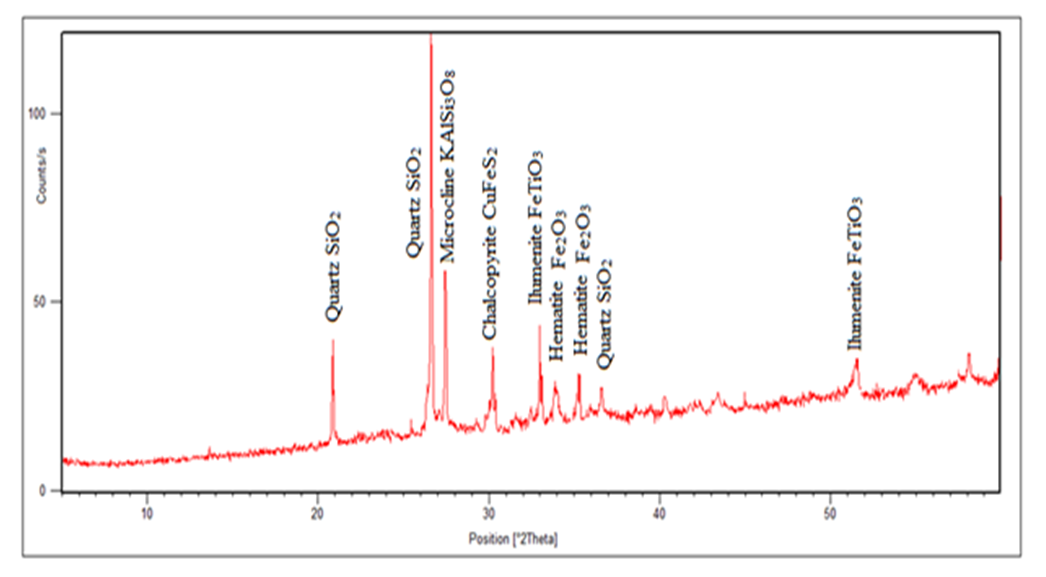 | Figure 1. The Spectrum of Raw Sample before Heat Treatment (3231) |
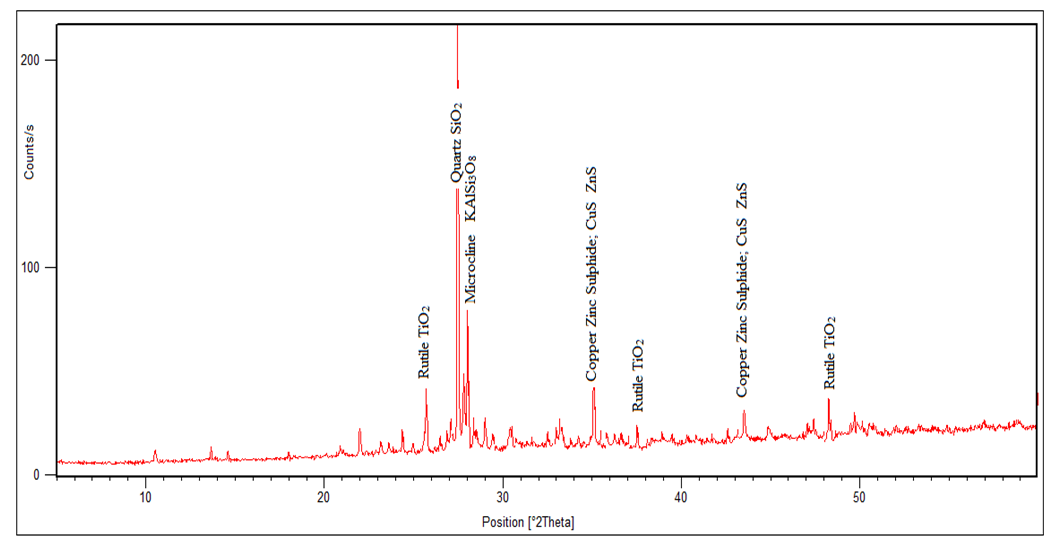 | Figure 2. The Spectrum of the Tailing (Non - Magnetic Sample) after Heat Treatment (3231) |
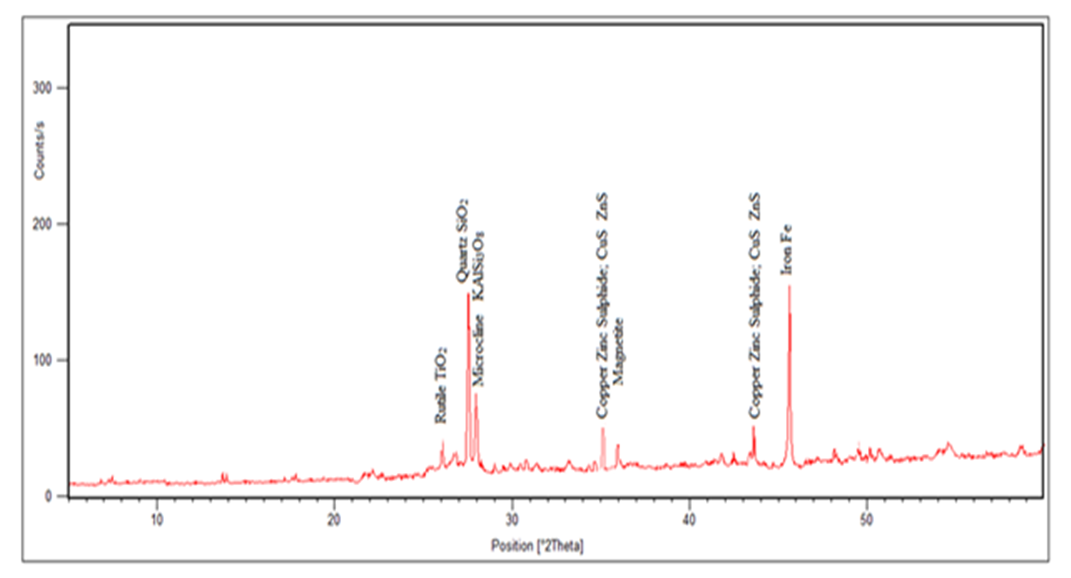 | Figure 3. The Spectrum of the Magnetic Sample after Heat Treatment (3231) |
In the magnetic sample, the rutile reduced significantly and the iron peak was observed. This occurs because rutile is not magnetic susceptible hence collected in the tailing. In the tailing, the ilmenite, and hematite peaks disappeared while the rutile peak increased. Table 5 and 6 shows the results of reduction of other ores using biomass. Table 7 shows statistical summary of the results in raw, concentrate and in tailing after separation using biomass.Table 5. Magnetic Separated Sample after Reduction of Samples Using Biomass
 |
| |
|
Table 6. Non-Magnetic Separated Sample after Reduction Using Biomass
 |
| |
|
Table 7. The Statistical Summary of the results in Raw, Concentrate and in Tailing after Separation Using Biomass
 |
| |
|
The results in table 5 shows that rutile composition decreased with a range of 0.01 to 0.08%, while iron oxides increased significantly with a range of 38% to 54.92%. Silica composition was also observed to reduce significantly in the magnetic separated samples. In the non magnetic sample, rutile increased with a range of 0.62 to 2.23%. Iron oxides reduced significantly with a range of 3.79 and 8.52%. However, silica which is the greatest impurity increased with a range of 42 to 56.05%. The results of the analysis shows no significance difference in the means of raw samples, tailing, and in magnetic concentrate, at 95% confidence level (P>0.05). Figure 4 gives the comparisons of the rutile in raw, magnetic and in non magnetic concentrate in all deposits.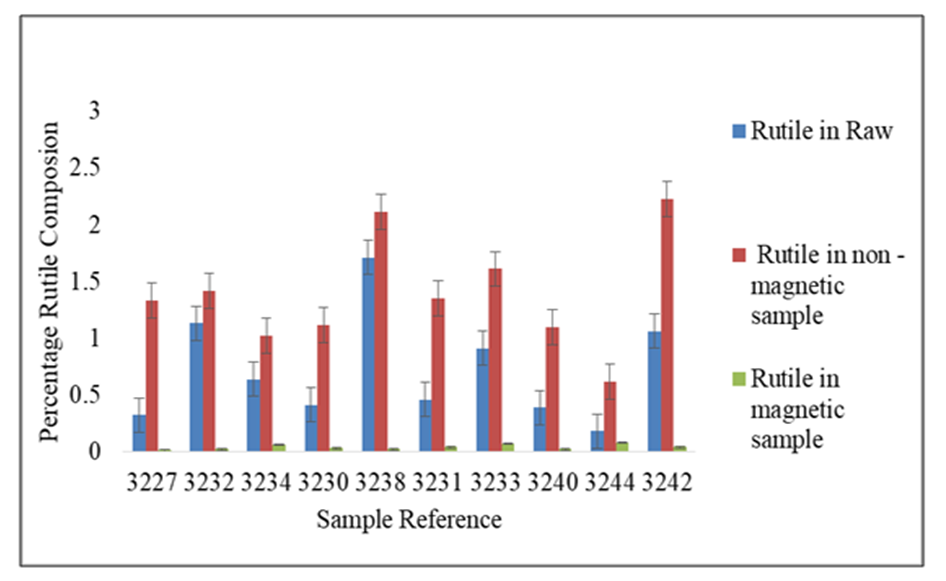 | Figure 4. Percentage Rutile Before and After the Concentration of the Ore Using Biomass |
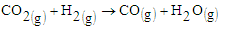
The results show an increase in the tailing in all samples and relatively low rutile in the magnetic concentrate. Comparing the results of sample 3227, the rutile content in the raw sample was 0.32 percent. After concentration rutile content increased to 1.33 percent which represents a 315.63 percent increase. The gasification process of biomass is known to decompose lignocelluloses components to char and volatiles [2]. This syngas therefore is responsible for reduction of the titanium ore to non-magnetic rutile. The possible reactions are given in equations 1,2,3, and 4. | (1) |
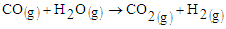 | (2) |
 | (3) |
 | (4) |
The hot carbon and carbon (II) oxide are the reducing agents for ilmenite in the mixture at a temperature range of 800-900°C as shown in equations 5 and 6.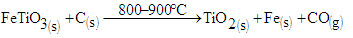 | (5) |
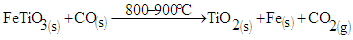 | (6) |
Rutile and aluminosilicates minerals have low magnetic susceptibility and therefore were not picked by the magnet. This increased the rutile composition in the non-magnetic sample by 315 percent in sample 3227.
4. Conclusions
The use of this method in rutile concentration would thus enable the achievement of the required grade for further extraction of titanium. In addition, use of biomass is an economic way of using organic waste which is a great problem especially the municipal wastes. This offers a suitable method of cleaning the environment. The temperatures involved are also economical for the establishment of the titanium concentration industry. The by – product gases produced therefore are useful by recycling for further reduction thus reducing the effect of the environmental pollution.
ACKNOWLEDGEMENTS
The authors acknowledge the department of Mines and Geology in the Ministry of Environment and Natural, where the experiments were done. The authors also acknowledge the funding of the National Research Fund through the University of Embu.
References
| [1] | Mutembei, P. K. (2013). Concentration of iron in laterites containing titanium from different localities of Tunyai Division in Tharaka Nithi County in Kenya using magnetic separation. Kenyatta University. |
| [2] | Warui, K. S. (2015). Beneficiation of low grade titanium ores from selected sites in Meru, Murang’a Tharaka Counties kenya. Thesis. Kenyatta University Kenya. |
| [3] | Raieevio, K., Lastra, R., & Mathieu, G.I. (1990). Concentration OF Magnetite, Ilmenite and Associated Vanadium from Brazeau - Wood Deposit. |
| [4] | Cui, Z., Liu, Q., & Etshell, T.H. (2002). Magnetic properties of ilmenite, hematite and oilsand minerals after roasting. Mineral Engineering, 15(12), 1121-1129. |
| [5] | Steenkamp, P. C. & Pistorius, J. D. (2003). Kinetics of chromites vs. ilmenite magnetization during oxidative roasting of ilmenite concentrates. Journal of the Southern African Institute of Mining and Metallurgy, 103(8), 501 – 507. |
| [6] | Williams, G. E., & Steenkamp, J. D. (2006). Heavy Mineral Processing at Richards Bay Minerals. Southern African Pyrometallurgy, (3), 5–8. |
| [7] | Mutembei, P. K., Muriithi, N. T., Njoroge, P. W., & Muthengia, J. W. (2014). Effects of Temperature on Ilmenite During Concentration of Iron in Laterites Using Charcoal and Separation using Magnetic Separation. International Journal of Scientific Engineering and Technology, 3(6), pp : 707-711 711(3), 707–711. |
| [8] | Babu, N., Vasumathi, N., & Rao, R. B. (2009). Recovery of Ilmenite and Other Heavy Minerals from Teri Sands (Red Sands) of Tamil Nadu, India. Journal of Minerals and Materials Characterization and Engineering, 08(02), 149–159. https://doi .org/10.4236/jmmce.200982013. |
| [9] | Kugeria, P. M., Mwangi, I., Wachira, J., & Njoroge, P. (2018). Copper extraction by wet chemical method. Journal of Sustainable Mining, 17(4), 202–208. https://doi.org/10.1016/j.jsm.2018.07.003. |
| [10] | Waithaka, P. N., Mutembei, P. K., Wachira, J. M. and Wanjau, R. N. (2014). Magnetic Concentration of Iron in Lateritic Soils from Kamahuha, Murang ’ a County, in Kenya using Carbon Monoxide Generated In-Situ. International Journal of Scientific Engineering and Technology, 1046(3), 1043–1046. |

 Abstract
 Reference
 Full-Text PDF
 Full-text HTML