-
Paper Information
- Paper Submission
-
Journal Information
- About This Journal
- Editorial Board
- Current Issue
- Archive
- Author Guidelines
- Contact Us
International Journal of Materials and Chemistry
p-ISSN: 2166-5346 e-ISSN: 2166-5354
2018; 8(1): 15-21
doi:10.5923/j.ijmc.20180801.03

Synthesis and Characterization of New Dental Composites Using Calcium Fluoroaluminosilicate Glass
 Abstract
 Reference
 Full-Text PDF
 Full-text HTML
Rafid M. Albadr1, Kareema M. Ziadan2, Mohamad S. Al Ajely3
1College of Dentistry, University of Basrah, Basrah, Iraq
2Department of Physics, College of science, University of Basrah, Basrah, Iraq
3Department of Chemistry, College of Education, University of Mosul, Mosul, Iraq
Correspondence to: Rafid M. Albadr, College of Dentistry, University of Basrah, Basrah, Iraq.
| Email: |  |
Copyright © 2018 The Author(s). Published by Scientific & Academic Publishing.
This work is licensed under the Creative Commons Attribution International License (CC BY).
http://creativecommons.org/licenses/by/4.0/

New dental composites prepared from Bis_GMA/TEGDMA with different ratios of Calcium fluoroaluminosilicate glass used as filler. The particle size of Calcium fluoroaluminosilicate glass was within (1-10) µm. visible light with 480nm wavelength and duration time of 40sec.was used in the polymerization process. Physical and mechanical properties of the dental material prepared were studied. These properties including, shrinkage; depth of cure, thermal expansion coefficient, Degree of conversion and diametral tensile strength (DTS). The static flexural strength and flexural modulus were measured using a three-point bending set up according to the ISO-4049 specification. The volumetric shrinkage values was found ranging between 2.6% to 2.9%, The degree of conversion was found between 79.57% to 68.27%, The depth of cure is 2.6 to 3.3mm, thermal expansion coefficient was also between 46.7 and 58.4×10⁻⁶ °C-1. While the mechanical properties such as the highest flexural strength was found about 90.35MPa, the flexural modulus measurements revealed the value of (11.29GPa), and finally DTS measurements showed 54.27MPa. All tested composite samples were complied with the requirement of ISO 4904: 2008 and ANSI/ADA specification No. 27 for cure resins.
Keywords: Dental composites, Calcium fluoroaluminosilicate glass, Mechanical properties, BisGMA/TEGDMA, Degree of conversion, Shrinkage
Cite this paper: Rafid M. Albadr, Kareema M. Ziadan, Mohamad S. Al Ajely, Synthesis and Characterization of New Dental Composites Using Calcium Fluoroaluminosilicate Glass, International Journal of Materials and Chemistry, Vol. 8 No. 1, 2018, pp. 15-21. doi: 10.5923/j.ijmc.20180801.03.
Article Outline
1. Introduction
- In Dentistry, posterior class I or II restorations require composites that show high mechanical properties whereas anterior restorations need composites that have superior aesthetics [1]. Composite material consist a resin matrix, filler and matrix-filler coupling. The organic matrix based on methacrylate chemistry, especially cross-linking agent dimethacrylates [2]. Much effort has been devoted to investigations of the relationship between filler particles in composite resins and their properties. Dental properties for composite significantly associated with values of mechanical properties, biocompatibility, color stability and would therefore be expected to be associated with clinical success of the restoration, influenced by numerous factors, including the a type and size of fillers [3], Risen Base Campsites shade [4, 5], photoinitiator type and concentration [6, 7], refractive index mismatch, light irradiation source and irradiation duration [8, 9] intensity of light and for a given irradiance period [10]. Because of major influence of the fillers on the physical properties, the classification of dental filling composites is based on the type and the particle size of fillers [11]. The filler content seems to be the most important factor in the determination of the properties of composites [12]. Calcium fluoroaluminosilicate glass draw the attention of researchers due to its comparable properties such as rigidity which is near to the bone rigidity and its ability to release the fluoride ions which will sterilize the teeth on using this type of fillers in teeth filling [13-17]. Calcium fluoroaluminosilicate glass is treated with a fluoride in an amount of from 0.01 to 5 parts by weight based on 100 parts by weight [16]. The physical and mechanical properties of dental composites have been improved significantly. However, dental composites possess two undesired properties, polymerization shrinkage and stress, which contribute to clinical problems in the integrity of the restoration margin [18]. Flexural strength is the material property that implies the quantity of flaws within the material that may have the potential to cause catastrophic failure during loading. Complex geometric forms of dental composite restoratives can lead to the development of the tensile forces during mastication. The purpose of this study is to evaluate the effects of Calcium fluoroaluminosilicate glass as filler level on selection properties of ten composite resin series prepared using different filler compositions. The examined properties were depth of cure, strength shrinkage, and degree of conversion, flexural strength, and DTS.
2. Material and Method
2.1. Preparation of Composites
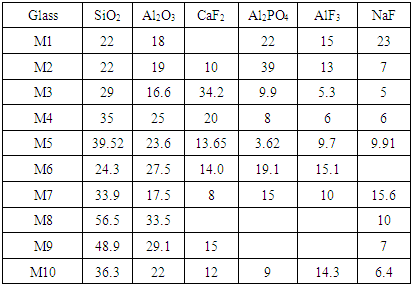
- Ten series of the prepared light-activated composites were tested, Resin composition was Bis_GMA (Sigma Aldrich (UK))/TEGDMA (Sigma Aldrich (UK)) with a w%/w% ratio of 70/30 while Camphorquinone (CQ, Aldrich (UK)) and dimethylaminoethylmethacrylate (DMAEMA, Wako Pure Chemical Industries) were catalysts added to the resin to initiate and crosslink the composite. Calcium fluoroaluminosilicate glass was synthesized and sintered in our laboratory using an elsewhere published procedure [17] (The average size of particles was within 1.2µm, density ~ 2.5g/cm3). These particles were then treated with silane-coupling agent γ-methacryloxypropyltrimethoxy (γMPS) silane (Aldrich (UK) 440159) was used, and loaded at 76 w% (60%Vol) to the resin. The compositions of the studied dental composites are shown in Table 1.
|
2.2. Preparation of Specimen
- Dental properties were determined according to the specification standard for composite (ISO 4049: 2000) [19]. Specimen where put inside mold for test, then, they were irradiated for 40sec. The light-curing unit with wave length 480nm (SDS Kerr Optilux 501 Halogen Bulb, USA) had an exit-window diameter of 8 mm and the light intensity used was 500 mW/cm2 with the curing tip placed 1mm from the glass plate.
2.3. Shrinkage Strain and Rate of Shrinkage
- The bonded disk technique [20] was used to measure the shrinkage of the samples during light curing. The Specimen were cured for 40sec. The shrinkage was measured continuously and total shrinkage strain of the samples was measured 500sec after starting the light radiation, at which time the contraction had plateaued-out.
2.4. Degree of Conversion
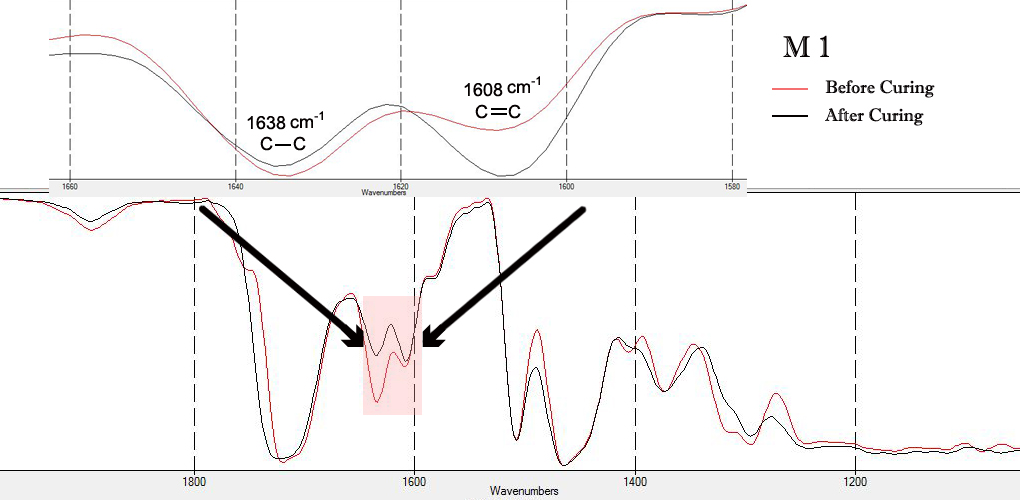
- Degree of conversion of the composites was measured using FTIR spectroscopy (Bruker, EQUINOX 55, D-76275 Ettlingen, Rudolf-Plank-st.23, Germany). The samples were placed between two polyethylene films, pressed to form a very thin film (0.10 mm) and the absorbance peaks of the uncured samples were obtained. The samples then light cured for 40sec and the peaks were collected for the cured samples. For calculating Degree of conversion (DC%), The aliphatic C = C (peak at 1638 cm-1). In addition, that for the aromatic C…C (peak at 1608 cm-1) were compared in each spectrum before and after the polymerization reaction. The ratio between the two peaks was then calculated as previously described [21], the degree of conversion was then calculated as follows:
 | (1) |
2.5. Depth of Cure
- Three specimens from each composites tested were condensed into a stainless steel mold; each specimen was of 4 mm in diameter and 10 mm in depth. The ISO defines depth of cure, as 50 percent of the length of the composite specimen after the uncured material is removed spatula with a plastic [19].
2.6. Thermal Expansion Coefficient
- Thermal expansion coefficient of cured composites was measured using a Thermo Mechanical analyzer (commercial thermo mechanical analyzer Germany) in the temperature range from 0 to 100°C. Specimen disks approximately 7 mm in diameter and 3-7 mm in thickness were fabricated in a stainless-steel mold, the specimens were then light cured for 40sec, after cured the Specimen were immersed in deionized water at 37°C for 24hrs. The linear coefficient of thermal expansion (α) was calculated according to the well-known formula [22]:
 | (2) |
2.7. Mechanical Properties
2.7.1. Flexural Strength and Flexural Modulus
- Flexural strength of the composites was conducted according to the 3-point bending method suggested in ISO 4049. The bar specimens (2mm × 2mm × 25 mm) were prepared in stainless-steel rectangular mold utilizing the light curing unit. An over lapping regime was applied to irradiate the whole specimens on both sides (40sec for each irradiation). Having stored in deionized water at 37°C for 24hrs, the three-point bending test was performed on the specimens using universal testing machine (SMT-20, Santam, Iran) at a crosshead speed of 1 mm/min. The flexural strength (FS) in MPa was calculated as [23]:
 | (3) |
2.7.2. Diametral Tensile Strength (DTS)
- Diametral tensile strength (DTS) test was performed adopting the procedure of ANSI/ADA specification No.27 for cure resins. The composite pastes were inserted into a cylindrical stainless-steel mold with internal diameter of 6mm and height of 4mm and cured for 40sec from both sides using the light-curing unit. The specimens were removed from mold and stored in deionized water for 24hrs at 37°C prior to the test. A universal testing machine (SMT-20, Santam, Iran) was utilized for the test at a crosshead speed of 1mm/min. The DTS (MPa) was then calculated according to the following equation [24]:
 | (4) |
3. Result and Discussion
3.1. Shrinkage Strain
- Three specimens were prepared for each composite materials tested. Figure 1 show the typical shrinkage strain carve for M10 composite test, also show the maximum shrinkage rate and the time at maximum. The maximum time of shrinkage rate of polymerization for all samples was found within 2~3sec. Mean values and standard deviation of the shrinkage of the materials tested are shown in Figure 2 the values varied from 2.65% for M10 to 2.97 for M2. We determine shrinkage until equilibrium about 400sec to denote the post cured. Post curing is important as it can effect on mechanical properties positively and increasing the degree of conversion [25]. The post curing range from 0.36% to 0.53%. The results of the present study demonstrated that the shrinkage strain of composites are about a half that of the methacrylate based composite, this decrease is due to the widespread dispersion of filler particles in the matrix because it's small size and filler content. Also post cure pooled to improve of mechanical properties. In a compared to the results of shrinkage strain obtained, which was between 2.65% for M10 and 2.97± 0.06% for M2 (Maximum value), with the work of some recent researchers David el at Admira of 2.64 ± 0.11%, Compoglass F was found 2.96 ± 0.02%, while for Fuji II LC is 3.25±0.17% and for Filtek P60 is 1.99±0.06% [26].
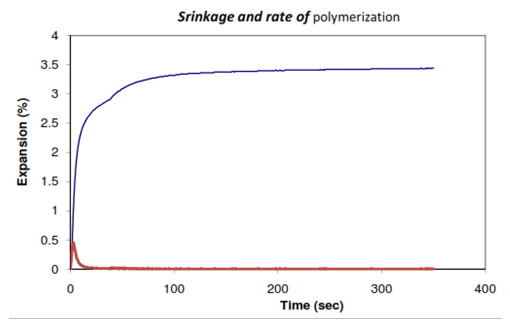 | Figure 1. Shrinkage carve and rate of polymerization for M2 composite test |
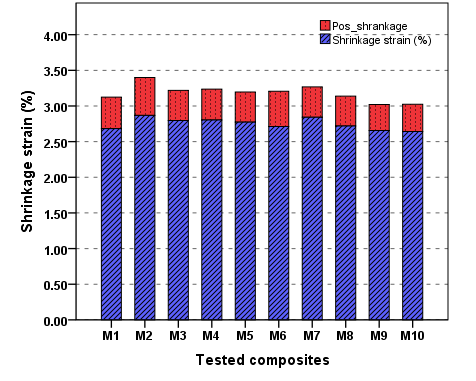 | Figure 2. The mean shrinkage and post shrinkage of composite tested |
3.2. Depth of Cure (DOC)
- Four specimens of each tested composites group were done. The length of the cured sample is measured to the nearest (0.0l mm) using a micrometer. Regarding the results of the present study, all samples at 40sec curing time passed the requirements of ISO 4049:2000, while the requested record of DOC is more than 2.5 mm.The result of DOC reported in Figure 3; DOC was found between 2.6 to 3.4mm this low value of DOC (< 3 mm) in some tested composite could be explained as the dark shade of the filler in the some tested composite which contribute to scattered the light cure, and there is positive correlation between transmittance of composites and depth cure. Furthermore, a possible explanation for the low depth of cure values due to the widespread of filler particles that could have impaired light transmission into the matrix and resulted in shallow curing depths.
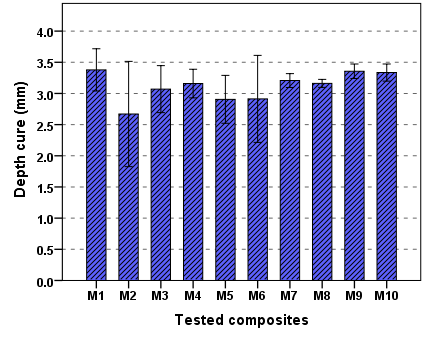 | Figure 3. The mean average of DOC of composite tested |
3.3. Degree of Conversion (DC)
- Figure 4 showed the FTIR spectrum for M1 tested composites and varies between uncured and cured within 1580 cm-1 to 1660cm-1. DC values obtained from the FTIR were ranged from 68 to 79%.
 | Figure 4. FTIR spectrums for M1 test composites |
3.4. Thermal Expansion Coefficient (CTE)
- In Figure 5, showed the versus of the thermal expansion coefficient respecting to temperature from 20°C to 100°C for M10 tested composites from TMA. The values of the linear coefficient of thermal expansion for the temperature range 0 - 60°C, which is the normal range of temperatures in the oral cavity, Figure 6 shown the mean and the standard deviation value for thermal expansion coefficient, the lowest coefficients for M4, which exhibit almost equal values (45 × 10-6 °C-1). Which are more heavily filled resins, Values of CTE for composite resins available, ranged from 46 to 58 × 10-6 °C-1 [27]. A strong inverse correlation has been reported between filler content and the coefficient of thermal expansion [28, 29]. Clinically, it is desirable for the thermal dimensional changes of restorative materials to approximate those of tooth structure to control marginal leakage and to maintain enamel bonding. The true clinical picture is quite complicated because thermal equilibrium seldom obtained in the oral environment. In this work the result of CTE, show good linearity between the change of height and temperature (correlation coefficient R2 > 0.99). Higher filler loading offer higher CTE of tested composites that approximate more closely that of the tooth crown.
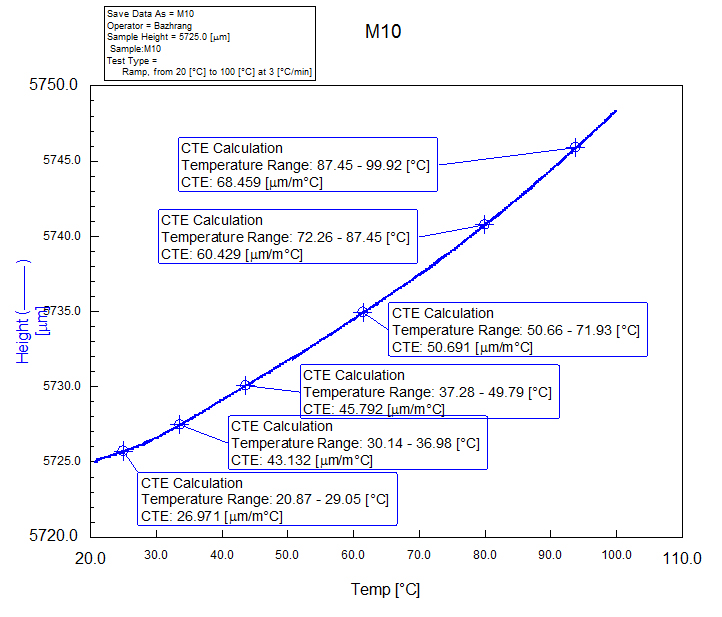 | Figure 5. Typical CTE curve, showing the dimensional change versus temperature and height of the specimen |
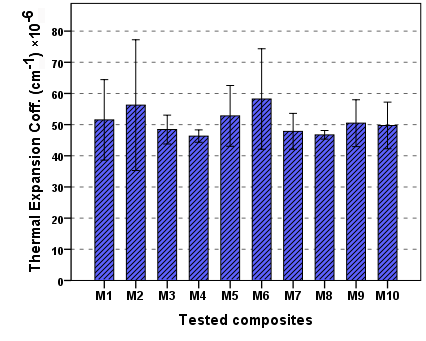 | Figure 6. The value of CTE of composite tested |
3.5. Flexural Strength (FS)
- Mean values and standard deviation of the flexural strength of the materials tested are shown in Figure 7. The values varied from 90.35MPa for M10 to 72.64 MPa for M5. Flexural strength (FS) is measure of the material strength under different force condition. The stronger material has the higher value of flexural strength. International Organization for Standardization (ISO) specification 4049 for polymer-based restoratives classifies dental polymer based restorative materials into two different groups, The lowest value of flexural strength required for group I is 80 MPa and 50 MPa for group II [30]. All materials investigated showed higher mean flexural strength values than ones recommended by the ISO suggesting. A positive correlation has been demonstrated between the mechanical properties and degree of conversion. In addition, the higher mechanical properties observed for tested composites are probably due to the high filler content in these composites. These materials can be used as direct restorative materials [18]. Also observed mean FS value for composite, which in turn were higher than the mean FS value reported by Palin et al. (92MPa) [31]. Herculite XRV Ultra exhibit FS mean value of (83.37 MPa) which is less than the mean values reported by Tran, 2010 (137 MPa) [32]. In addition, Tetric Evo Cerm exhibited mean value of (70.21 MPa) which was less than literature means (98.61MPa) [33, 34].Mean values and standard deviation of the flexural modulus of the materials tested are shown in Figure 8. The values varied from 11.04 GPa for M10 to 9.75 GPa for M5 test composites.
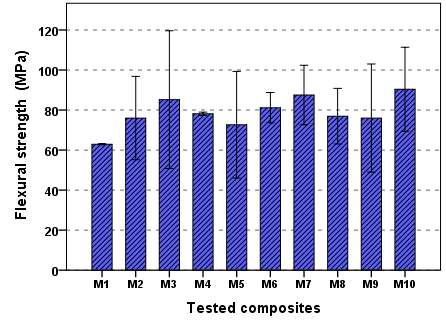 | Figure 7. The mean value of Flexural strength of composite tested |
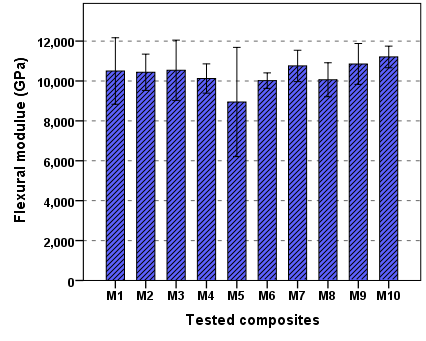 | Figure 8. The mean value of Flexural modulus of composite tested |
3.6. Diametral Tensile Strength (DTS)
- The diametral tensile strength is property, which is suited only for testing brittle materials, for this reason, DTS may be consider to have more Clinical relevance than the compressive strength [35]. DTS is an acceptable and common test for dental composites [25]. The mean and standard deviation value of the DTS of tested composites are shown in Figure 9. The values varied from 46.4 MPa for M4 to 55.32 MPa for M10.
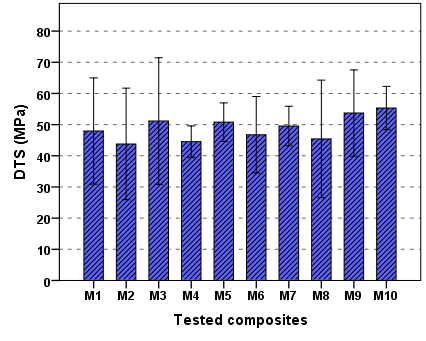 | Figure 9. The mean value of DTS for composites tested |
4. Conclusions
- Newly developed dental composites with new composition calcium fluoroaluminosilicate glasses as filler with fluoride content are expanding the armoury of restorative material to the dental practitioner. Within the limitations of this study, it can be summarized that:Ÿ Mechanical properties of the tested composites are matched those of a commercial composite without fluoride. Ÿ Lower values of shrinkage compared to composites based on conventional Bis_GMA.Ÿ Composites used calcium fluoroaluminosilicate glasses as filler shown better thermal properties due to degree of conversion.Ÿ Different compositions of calcium fluoroaluminosilicate glass used to get a filler with a good specification. M10 composites with composition (SiO2 36.6, Al2O3 22, CaF2 12, Al2PO4 9 and NaF 14.3%) which agrees well with beat physical and mechanical properties.Ÿ Finely, all tested composites with calcium fluoroaluminosilicate glasses complied with the requirement of ISO 4049: 2000.