-
Paper Information
- Paper Submission
-
Journal Information
- About This Journal
- Editorial Board
- Current Issue
- Archive
- Author Guidelines
- Contact Us
International Journal of Materials and Chemistry
p-ISSN: 2166-5346 e-ISSN: 2166-5354
2018; 8(1): 1-9
doi:10.5923/j.ijmc.20180801.01

Adsorption of Cadmium Ions on Geopolymers Derived from Ordinary Clay and Rice Husk Ash
 Abstract
 Reference
 Full-Text PDF
 Full-text HTML
F. M. Maingi, H. M. Mbuvi, M. M. Ng’ang’a, H. Mwangi
Department of Chemistry, Kenyatta University, Nairobi, Kenya
Correspondence to: H. M. Mbuvi, Department of Chemistry, Kenyatta University, Nairobi, Kenya.
| Email: |  |
Copyright © 2018 Scientific & Academic Publishing. All Rights Reserved.
This work is licensed under the Creative Commons Attribution International License (CC BY).
http://creativecommons.org/licenses/by/4.0/

The presence of heavy metals in water is of growing concern. One crucial global strain is the existing disparity in water distribution resulting into millions of people lacking access to safe clean water. This is exasperated by the looming climate change and increased pollution impendence posed by industrialization and population growth. Consequently, pursuance of sustainable materials and technologies for wastewater remediation is critical. Adoption of adsorbents for water treatment is desirable due to their simplicity and cheap materials involved. Geopolymers are prepared hydrothermally using alumina and silica gleaned from clay and rice husks waste materials respectively. These materials are locally attainable and environmentally benign. This work reports synthesis of geopolymers GP-1, GP-2 and GP-3 prepared using clays from three different regions. The XRD diffraction patterns obtained revealed the presence of quartz (SiO2), albite (NaAlSi3O8), vermiculite (Mg,Fe,Al)3((Al,Si)4O10)(OH)2.4H2O), microcline (KAlSi3O8), analcime (NaAlSi2O6•H2O) and natrite (Na2CO3) among other crystalline phases. The initial adsorption rates were found to increase as the Si/Al ratio of the geopolymers increased. The adsorption rates were found to fit into the second order kinetic model. This implies that Cd (II) ions adsorb on geopolymer adsorbents through chemisorption.
Keywords: Geopolymers, Characterized, Equilibrium, Thermodynamic, Kinetics
Cite this paper: F. M. Maingi, H. M. Mbuvi, M. M. Ng’ang’a, H. Mwangi, Adsorption of Cadmium Ions on Geopolymers Derived from Ordinary Clay and Rice Husk Ash, International Journal of Materials and Chemistry, Vol. 8 No. 1, 2018, pp. 1-9. doi: 10.5923/j.ijmc.20180801.01.
Article Outline
1. Introduction
- Rapid industrialization and technological advancement experienced in Kenya has led to increased use of cadmium metal. This metal is extremely toxic and of significant environmental and occupational concern [1] due to lack of homeostatic control in human body. This metal is one of the main causes of various human pathologies such as kidney damage, liver disorder, high blood pressure, stomach problems among other ailments [2]. Geopolymers have gained interest for use as adsorbents in wastewater treatment. They can be easily synthesized from simple clays, aluminosilicate and rice husk ash [3]. They consists of polymeric Si–O–Al and Si–O–Si frameworks joined together by sharing oxygen atoms to form a three dimensional network [4]. Moreover, in the approach to replace the traditional adsorbents, geopolymers are desirable because they are green materials that are easily prepared by a simple chemical reaction of readily available raw source of aluminosilicate [5]. For this reason, geopolymers have started being used as adsorbents within the procedures of elimination of metal ions from the wastewater as an alternative to commercial adsorbents within the industrial sector [6]. Preceding studies showed that higher Si: Al ratio caused increment in silica content within the framework that caused increased negatively charged groups of O-Si-O- within the geopolymer [7]. This study reports synthesis, characterization, their kinetics and thermodynamic effects of geopolymers on their use in the adsorption process of cadmium ions from aqueous phase.
2. Experimental Procedures
2.1. Chemicals and Reagents
- NaOH was used as an alkaline catalyst during geopolymer synthesis. Cd(NO3)2 and HNO3 were used in adsorption experiments and were of analytical grade supplied by Sigma Aldrich.
2.2. Clay and Rice Husk Materials
- The clays used in this study were acquired from Kakamega, Kuresoi and Molo in Kenya. They were transported to Kenyatta university laboratory, washed with distilled water, then air dried for 2 weeks. Calcination was done at 700°C in a furnace (Eisklo LN120) and later ground to powder with the use of grinder (Reutsch SR 200). Calcined clay was used as a supplier of Al2O3. Rice husk acquired from a rice processor in Mwea location in Kenya was washed with distilled water for 20 min at room temperature, using a liquid/solid ratio of 15 L: 1 kg. The solids were allowed to settle and dried at 60°C in an oven. Leaching was then achieved with 3% HCl solution, using reflux for 2 hours. The solids, after separation by means of settling and filtration, were washed with distilled water, to do away with the acid retained, and then dried at 60°C. Calcination was accomplished at 600°C for 2 hours using a muffle furnace to obtain ash which was used as a source of silica [8].
2.3. Preparation of Geopolymers
- Geopolymers were prepared following the procedure given by López et al [7] with slight modifications. Rice husk ash was blended with 8M NaOH solution in the liquid/solid ratio of 5 L: 1 Kg and stirred with the aid of a magnetic stirrer for 15 minutes to form an alkaline activator. According to Mustafa Al Bakri et al. [9], these reactions occur at a high rate when the alkaline activator contains soluble silicates. 50 g of clay powder was added to the mixture and thoroughly mixed using a ball mill for a period of 5 hours. The resultant pastes were vibrated for 5 minutes in pestles. The resulting pastes were then cured at 80°C for 12 hours in order to start the condensation reaction. The pastes were then removed from the molds, placed in an oven at 200°C for 12 hours in order for the polycondensation process to complete [7].
2.4. Characterization of Geopolymers
- Characterization of prepared geopolymer was done before the adsorption experiments using FT-IR (IRTracer 100 Shimadzu) for determination of molecular vibrations of the functional groups in the geopolymers. The crystal structures (mineral phases present) were determined using X-ray diffractometer (XRD) (D2 Phaser Bruker), X-ray fluorescence (XRF) (S1 Titan) to determine the chemical composition of principal components while SEM (Zeiss Evo LS 15) was used for microstructure analysis [7].
2.5. Adsorption Experiments
2.5.1. Effect of pH on Adsorption of Cd (II) ions
- Experiments were administered by adjusting pH from 2 to 6 of Cd (II) ions solution while maintaining all other experimental conditions constant. The pH modification was done using procedures given by Moreno-piraján and Giraldo [10]. 50 mL pH accustomed containing 100 mg/L of Cd (II) ions in monocomponent system was placed in 100 mL stoppered plastic bottles. 0.10g of the geopolymer materials were accurately weighed and put into stoppered bottles. The bottles were then shaken continuously for one hour placed in a thermostatic electric shaker (SHR-2D) at 120 rpm which was maintained at 25°C ± 1. All the experiments were carried out in triplicates and mean average values used for further calculations. The reagent bottles were then successively withdrawn and the supernatant solutions separated by filtering through whatman no 41 filter papers. The resultant solution was analyzed for cadmium ions using a FAAS (AA 6300 Shimadzu) following the procedure reported by Ryan et al. [11].
2.5.2. Kinetic Studies of Adsorption Process
- For the batch kinetic experiments, about 0.10 g of the geopolymer adsorbents were placed in 100 mL stoppered bottles. 50 mL of 100 mg/L cadmium ion solutions were added to each bottle and the mixture placed in a water bath electric shaker at residence time ranging from 20 to 80 minutes. The mixtures were subjected to a constant shaking speed of 120 rpm at 25°C ± 1 and then filtered. The metal ions concentration contained in the filtrate were measured using AAS spectrophotometer. Plots of log (qe - qt) against t and t/qt against t were used to determine kinetic parameters for Pseudo- first order and Pseudo- second order as per equations 1 and 2 respectively.
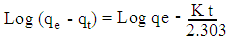 | (1) |
 | (2) |
 | (3) |
2.5.3. Thermodynamic Studies of Adsorption Process
- Batch sorption experiments at different temperatures were done to investigate the effect of temperature on thermodynamic parameters. Stoppered bottles containing 0.10 g of geopolymer adsorbents and 50 mL of 100 mg/L cadmium aqueous solutions of pH 5.0 were used. The stoppered bottles and their contents were placed on a water bath electric shaker at various temperatures of 293, 298, 308 318 and 328 K and shaken for one hour. The adsorbent/adsorbate mixture was then filtered and final concentration of metal ions in the filtrates analyzed using AAS. The data obtained was used to tabulate the thermodynamic parameters such as the adsorption standard free energy changes (ΔG°), the standard enthalpy change (ΔH°) and
 the standard entropy change (ΔS°) following equations 4 and 5 [13].
  | (4) |
 | (5) |
3. Results and Discussion
3.1. Chemical Composition of Geopolymer
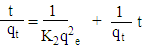
- The components of the geopolymer adsorbents GP-1, GP-2 and GP-3 were mainly silica and alumina as shown in table 1. Silica, SiO2 constituted 66.84, 66.21 and 73.99% while alumina, Al2O3 constituted 16.05, 15.83 and 8.93% of GP-1, GP-2 and GP-3 respectively. Additional elements found in lesser quantities include Fe at 6.42, 5.65 and 9.05%, K2O at 4.43, 6.08 and 2.89%, CaO at 1.88%, 1.43% and 0.92% and Ti at 1.38, 1.12% and 1.85% for GP-1, GP-2 and GP-3 respectively. The composition is in agreement with results obtained by Lopez et al. [7]
|
3.2. FTIR Spectra Analysis on Geopolymers
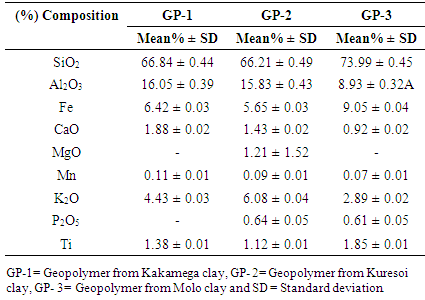
- The infra-red spectra of the various geopolymer adsorbents GP-1, GP-2, and GP-3 are shown in Figure 1. The broad bands at
 3400 cm-1 are attributed to –OH stretching mode. The spectral band at around 1410 cm-1 is characteristic of the asymmetric O-C-O bonds of CO32- stretching mode. This is associated with sodium bicarbonate formed due to atmospheric carbonation of alkaline NaOH aqueous phase and diffused on the geopolymeric materials surface [14, 15]. The characteristic Al-O and Si-O asymmetric stretching vibrations appear as strong peak at ~979 cm-1 [16]. The band in the region of 775-650 cm-1 attributed to symmetrical vibrations of tetrahedral groups (TO4) and at~460 cm-1 is assigned to in-plane bending of Al-O and Si-O linkages [16].
 | Figure 1. Shows the FT-IR spectra for geopolymer materials GP-1, GP-2, and GP-3 |
3.3. SEM Microstructure Analysis of Geopolymers
- Figure 2 shows the SEM micrographs of GP-1, GP-2, GP-3 and EDS. The images reveal that the geopolymeric adsorbents have compacted irregularly shapes. The cavities found in micrograph for GP-2 indicate that it consists of tubular vitreous network [17]. EDXRF analysis of gel showed that gel mostly consists of the phases containing Na-Si-Al in the bulk region. This is suggestive of formation of silicate-activated gel all over the inter particles volume [3, 18]. The major elements (e.g., Na, Al, Si, and O) make up geopolymers; Ca, Mg and Fe are also present and have influence in geopolymerization process [19]. These remnants (Fe, Ca, K, Mg) obviously represent the calcined clay and rice husk ash phases, which for various reasons, did not dissolve during alkali activation [17]. Literature report by Lloyd et al. [18]; suggested that during alkaline activation the remnants may disperse through the gel. This correlates with the published works of Lee and Van Deventer [14].
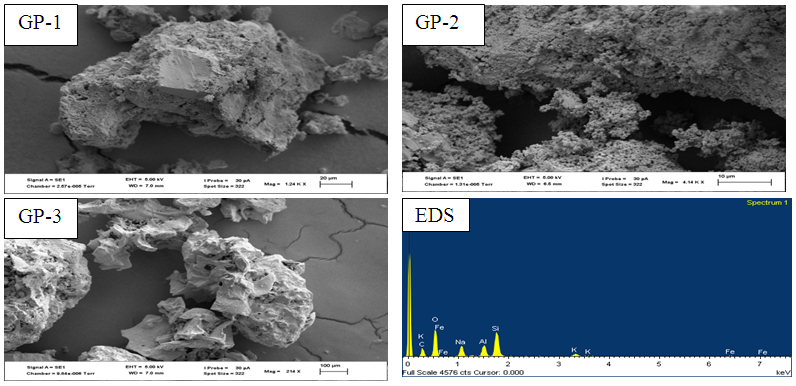 | Figure 2. Shows the SEM micrographs for GP-1, GP-2, GP-3 and EDS spectrum |
3.4. XRD Characterization of Geopolymers
- Quartz (SiO2), albite (NaAlSi3O8), vermiculite (Mg, Fe, Al)3((Al,Si)4O10)(OH)2.4H2O), microcline (KAlSi3O8), analcime (NaAlSi2O6·H2O) and natrite (Na2CO3) were the major mineral phases identified by XRD diffraction patterns as shown in figure 3. The formation of natrite (Na2CO3) is attributed atmospheric CO2 reacting with the sodium-rich pore solutions [20]. The characteristic amorphous geopolymer broad hump peak between 18-36˚ (2θ) [21, 22] was found in all the XRD patterns but was more pronounced in GP-3.
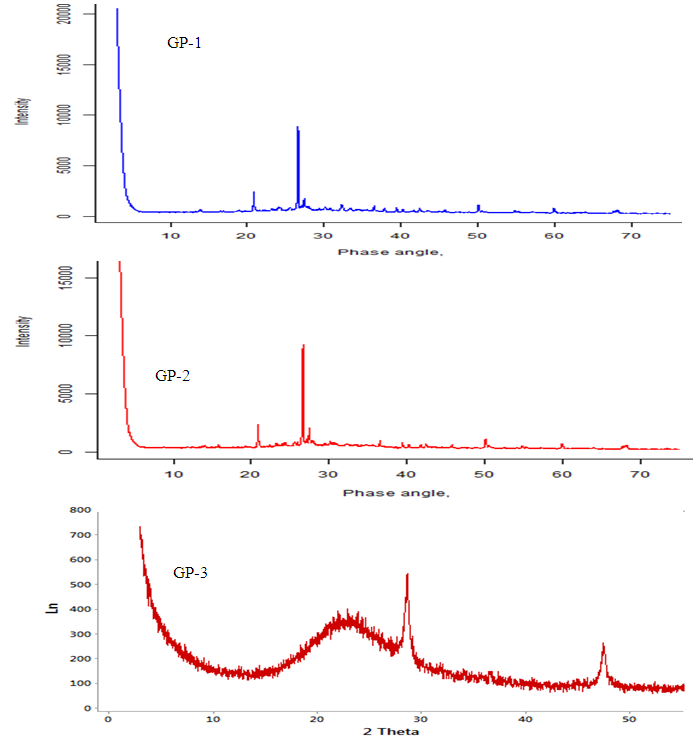 | Figure 3. Shows diffraction patterns for geopolymeric materials GP-1, GP-2 and GP-3 |
3.5. Adsorption Studies of Geopolymers
3.5.1. Effect of pH on Adsorption of Cd (II) ions
- The adsorption efficiency of the geopolymeric adsorbents for Cd (II) ions at various pH conditions are expressed in figure 4. The experiments were done using 0.1 g of adsorbent and 50 mL Cd (II) ions solutions at concentrations of 100 mg/L while the pH was varied from 2 to 6. The mean percentage removal increased from 82.85% ± 0.20, 82.93% ± 0.13 and 85.41% ± 0.11 to 86.16% ± 0.31, 86.71% ± 0.26 and 89.63% ± 0.18, when pH was varied from (pH2–5), for geopolymer materials GP-1, GP-2 and GP-3 respectively. The data obtained revealed that optimum adsorption was achieved at pH 5. Low adsorption at low pH was attributed to competition caused by hydronium ions on the sorption sites. This concurs with similar work on adsorption of cadmium reported by Kounou et al. [23]. Adsorbent GP- 3 showed higher efficiency for cadmium uptake than GP-1 and GP-2 at all pH values. Subsequently, pH 5.0 was chosen as the working value for all the other batch experiments.
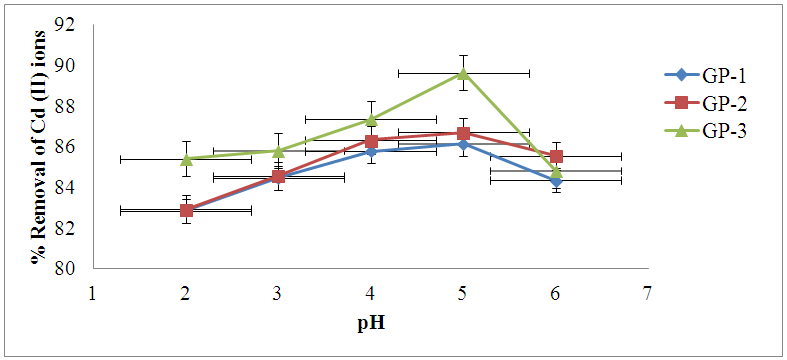 | Figure 4. Effect of pH on Cd (II) removal onto geopolymer materials (Cd (II) concentration=100 mg/L, adsorbent dose= 0.1 g/50 mL, shaking speed = 120 rpm, temperature = 25 ºC and error bars indicate the standard error from the mean) |
3.5.2. Effect of Contact Time
- The adsorption of Cd (II) ions by the geopolymeric adsorbents increases with increased to an optimum mean percentage uptake of 90.46% ± 0.48, 90.34% ± 0.12 and 90.85% ± 0.06 for GP-1, GP-2 and GP-3 respectively as shown in figure 5. The extent of sorption increased expeditiously till the optimum equilibrium values were reached at 80 min for all the geopolymers in concurrence with literature report by Zhang et al. [24].
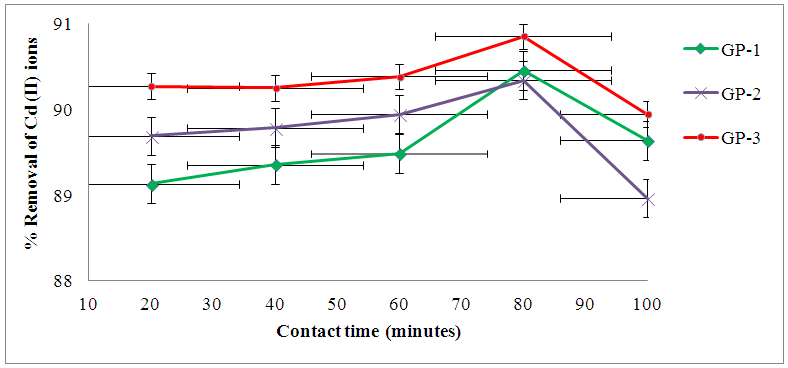 | Figure 5. Effect of contact time on Cd (II) removal onto geopolymer materials (Cd (II) concentration=100 mg/L, adsorbent dose= 0.1 g/50 mL, shaking speed = 120 rpm, pH = 5.0 temperature = 25°C and error bars with standard error from the mean) |
3.5.3. Effect of Temperature
- Figure 6 represents the change in extent of adsorption of cadmium with respect to temperature. The experiments were done by varying the temperature from 293 to 328K while keeping the rest of the parameters such as adsorbate concentration at 100 mg/ L, the pH at 5, and the adsorbent concentration at 0.1 g in 50 mL. The mean percent removal increased from 86.83% ± 0.11, 89.22% ± 0.19 and 90.49% ± 0.03 to 90.61% ± 0.07, 91.52% ± 0.48 and 95.04% ± 0.02 when temperature was adjusted from 293 to 328 K for adsorbents GP-1, GP-2 and GP-3 respectively. The increment of adsorption with temperature is attributed to increased ions mobility, thus increasing the number of ions that interact with active sites of the adsorbent surfaces [25]. Similar trends have been reported by other researchers for aqueous phase adsorption [26].
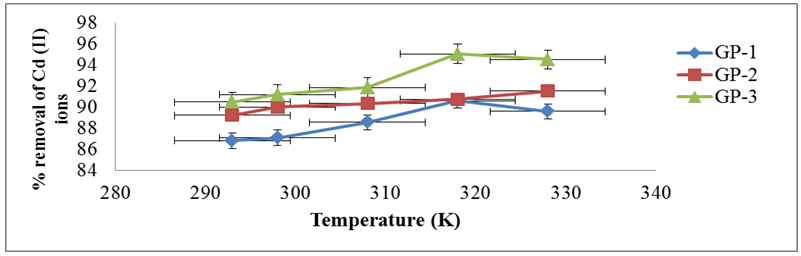 | Figure 6. Effect of temperature on Cd (II) removal onto geopolymer materials (Contact time = 60 minutes, shaking speed of 120 rpm, pH = 5.0 and adsorbent dose = 0.1g/50mL) |
3.5.4. Adsorption Thermodynamics for Cd (II) ions onto Geopolymeric Adsorbents
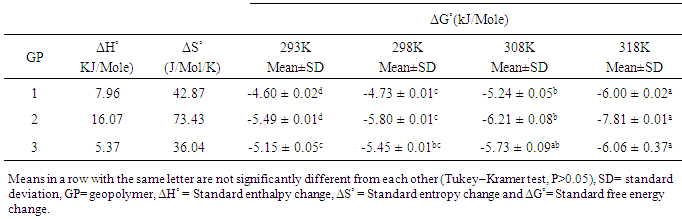
- The thermodynamic parameters for the adsorption of Cd (II) ions onto the geopolymeric adsorbents at the various temperatures are summarized in table 2. The values for changes in free energy, ΔG° were negative for all the adsorbents at all temperatures indicating spontaneity of process [27]. The values became more negative ranging from -4.60 ± 0.02, -5.49 ± 0.01 and -5.15 ± 0.05 at 293 K to -6.00 ± 0.02, -7.81 ± 0.01 and -6.06 ± 0.37 at 318 K for GP-1, GP-2 and GP-3 respectively. This is expected as rise in temperature increases the spontaneity of adsorption [28]. The decreased values of ΔG with increase temperature imply that the reaction is more spontaneous and favourable at higher temperature [29]. The values for entropy change were all positive and significant signifying that enormous structural changes took place at the active sites of the geopolymers during adsorption process. This is expected because for metal ions to be adsorbed, they have to get rid of part of their hydration sheath. The endothermicity of the dehydration energy supersedes the corresponding exothermicity of the ions getting attached to the surface [30].
|
3.5.5. Kinetic Modeling for Adsorption of Cd (II) ions
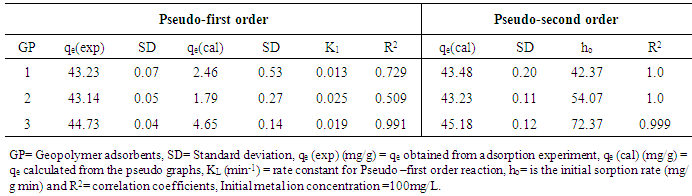
- The pseudo-first and pseudo-second order kinetic parameters calculated by linear regression for Cd (II) ions are summarized in table 3. As indicated in the table, the data correlated closely with pseudo- second order kinetics model with R2 coefficient values of 1.0, 1.0 and 0.999 for adsorbents GP-1, GP-2 and GP-3 respectively. The initial adsorption rate (ho) obtained were 42.37 to 54.07 and 72.37 mg /g min as the SiO2/Al2O3 ratio of geopolymer increased from 4.16 to 8.28 for adsorbents GP-1, GP-2 and GP-3 respectively. This is due to the increased driving force of Cd (II) ions from the liquid to the solid phase [31]. The first order rate constant k1 and equilibrium adsorption density qe were determined from the slopes and intercepts of plots of log (qe –qt) versus t and are shown in table 3. As indicated in the table, the calculated theoretical data deviated considerably from the experimental data. Further, the theoretical qe values found from the pseudo-first order model did not give reasonable values. The correlation coefficients obtained were greater than 0.99. The calculated qe values for the second order kinetic model agreed well with the experimental values. Thus, the adsorption system studied belonged to the pseudo-second order model. This implies that Cd (II) ions adsorption on geopolymer adsorbents occurs through chemical processes involving the valence forces or the shared exchangeable electrons [32]. This means that the chemisorption reaction or activation process is more predominant in the rate-controlling step for the cadmium system. Similar phenomena have been reported in the adsorption of copper and lead on tea waste [33].
|
3.5.6. Intraparticle Diffusion Models of Cd (II) Uptake onto Geopolymers
- The intraparticle plots of Cd (II) ions data exhibited multi linear plots as shown in figure 7. This implies that the adsorption process is governed by two or more steps. The first linear part is likely attributed to the abrupt exploitation of the readily available sorbing sites on the sorbent surface while the second portion possibly credited to the very slow diffusion of Cd (II) ions from the geopolymer surface sites into the inner pores [34].
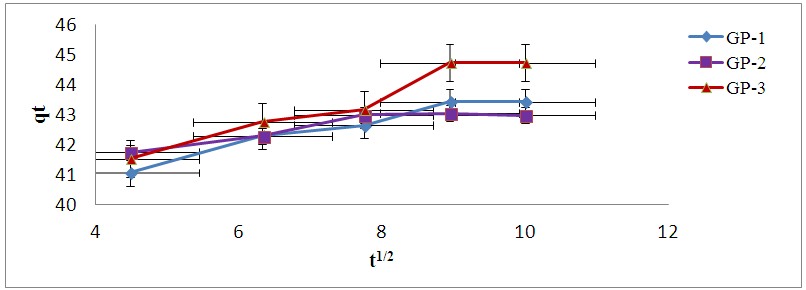 | Figure 7. Intra-particle diffusion plot for the adsorption process of Cd (II) (geopolymer dosage = 2g/L, Time 20-100 minutes, [Cd (II)] = 100mg/L, T = 298 K, pH 5.0, V = 0.050 L and error bars indicate the average deviation from the mean) |
4. Conclusions
- This study has shown that Kenyan common clays that are of very few economic endeavors may be good raw materials for synthesis of geopolymers for adsorption application of cadmium ions from contaminated water. The adsorbents showed increased the ability to remove Cd (II) ions from synthetic wastewater as the SiO2/Al2O3 ratio increased. The correlation coefficients for the pseudo-second order kinetic model obtained were greater than those of pseudo- first order and therefore indicating that adsorption system studied belonged to the pseudo-second order kinetic model. Thermodynamic studies have shown that the cadmium adsorption process was an endothermic process hence favoured by increase in operation temperatures.
ACKNOWLEDGEMENTS
- The authors would like to express great thanks to Kenyatta University and National Research Fund (NRF) for funding this study.